Long VisaFalling wedge.
Visa seems to have broken the falling wedge and downtrend.
I expect visa to reverse and head back up to 240/250 in a few months.
Imo visa is on sale right now and the holidays are usually good since everyone will be buying with their cards.
V trade ideas

Visa Correction over🐂From the start of this correction back in July Visa has lost 20% of its value. In my last post I stated that I didn't think Visa would close lower than 207 and here we are.
Short term were head to 224 where I think we'll consolidate some . There's alot of resistance in that 224-230 area And we might need a catalyst to push through (Maybe holiday season sells..
A move over 216 will began the start of a double bottom

Bought VBought NYSE:V
Visa Inc. is an American multinational financial services corporation headquartered in Foster City, California, United States. It facilitates electronic funds transfers throughout the world, most commonly through Visa-branded credit cards, debit cards and prepaid cards

V 1H wolfe wave bearishA Wolfe Wave is a chart pattern composed of five wave patterns in price that imply an underlying equilibrium price. Investors who use this system time their trades based upon the resistance and support lines indicated by the pattern.

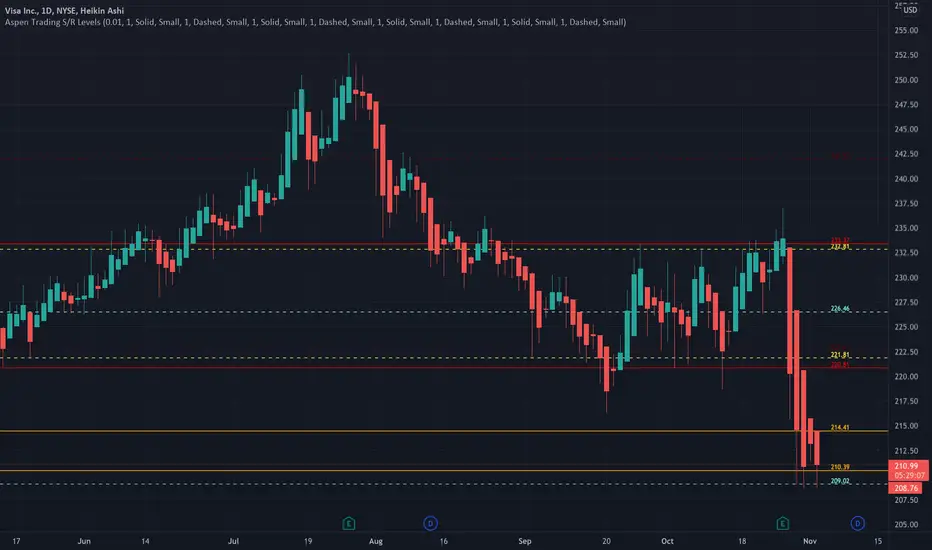
V looks bullish using Aspen Trading S/R LevelsAspen Trading S/R Levels are predicting support for Visa @ 209.02.
Visa is looking bullish for the remaining part of the year.
Another tailwind is that Visa typically displays seasonal strength this time of the year.
Please like, share and follow if you agree with the analysis.
Note - Aspen Trading S/R levels are invite only. They can be accessed through my profile information.
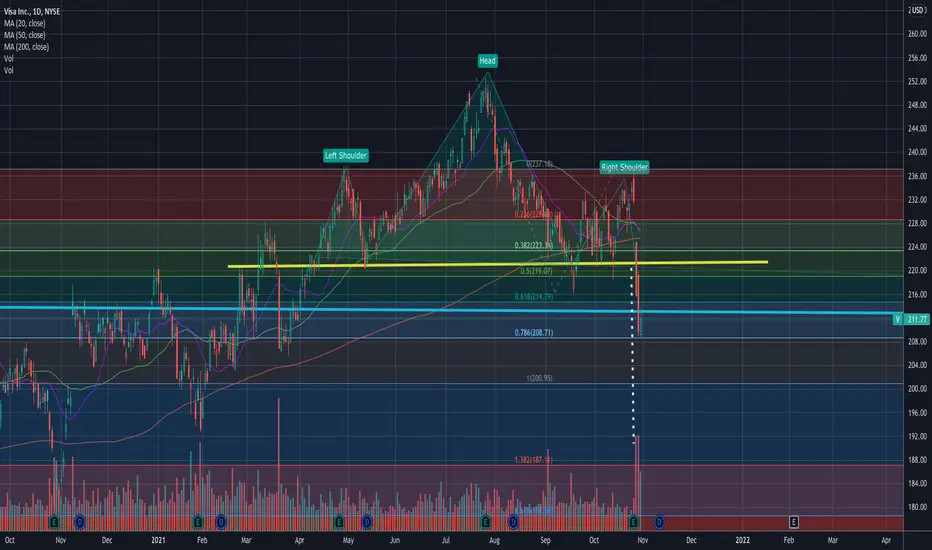
Head and Shoulders/OUCH!V beat earnings and raised dividend, but still manage to drop beneath the right shoulder of what appeared to be an inverse head and shoulder pattern earlier/not anymore as that pattern failed. The head and shoulder top has won this battle for now. Mastercard and GPN are struggling as well. Apparently this is not the best time for credit card stocks. I did not see this coming but I should have since there is a H&S pattern staring at me )o: and also because MA started falling as well.
V gapped down on a BAD candle, a Marubozu , which is also known as a candle that is "shaven" and is very bearish. The candle exhibits selling pressure throughout the trading session and a close at the low of the trading session. There is no top wick or a bottom shadow. The red candle opened at the top of the body and closed at the bottom of the candle body, exhibiting very little buying pressure to help it out. Then possible panic selling began to kick in.
Price is below the bands set on 80 which shows extreme selling pressure. I had
Long term high is 252.57 which is also the most recent high. The head is the all time high. Short interest is low at 1.6% and negative volume is still very high for Visa.
A head and shoulders top is not a valid pattern until the neckline which was support, now resistance, is broken. It is broken and Visa has done a nose dive past support levels even with good earnings . Oversold on RSI , but a security can dwell in oversold territory for an extended period of time, especially if there is a lot of supply at that level.
No recommendation. I am waiting on this to chill out so I can buy it )o: Possible bounce up very soon as price returns to the bands eventually, but I plan to be sure the move up is solid before buying this to hold on to for any length of time. William's alligator indicates that now is not that time as these shorter term moving averages that are used to build this indicator are out of chronological order and pointing down.
Price may fall to a fib level of the projected measurement down using the top of the head to the neckline as a gauge. There is always the chance V will not fall much, if any further, but 38% would be 208, 62% is 200.30 and 79% would be at 194.90. 187.95 is a fall of 100%. It is also possible to fall below 100% or an extension of 100% )o:
It is a good idea to look at the sky, the ground, and in the rearview mirror before making a decision.
V had a move up today but did not hold the high so far. Perhaps this will recover before down targets (in orange) are met.

$V - Head and shoulder break downIf you follow my charts, previously I noted that Visa would go to $150 and it went until $152. Congrats if you took the profit.
Now Visa just did the head and shoulder break down. The price bounced from 208ish which is around 50% of the breakdown target $192.
The 207 - 208 area is the fib support for both retracement as well as fib extension. It has also acted as previous support area from 12/2020 to 3/2021.
Patterns can reverse from 50% measured target.
Based on all these facts, I believe the bottom has been found.
It's still too early to call. But I have started my reentry.
Target 1 - $135
Target 2 - $150
Risk - fall below $207
———————————————————
How to read my charts?
- Matching color trend lines shows the pattern. Sometimes a chart can have multiple patterns. Each pattern will have matching color trend lines.
- The yellow horizontal lines shows support and resistance areas.
- Fib lines also shows support and resistance areas.
- The dotted white lines shows price projection for breakout or breakdown target.
Disclaimer: Do your own DD. Not an investment advice.
looking for resistance testcouldn't make it through the 233.00 resistance
didn't find support at 216
looking to see if it find support at 208.00, if so will be looking for long position (target 216.00, 233.00, 240.00, 250.00)
Visible range show a good volume a that 208.00 zone
New trader here so don't take my advise for cash!

VISA forms a HEAD-and-SHOULDER pattern!Visa reported strong numbers but conservative outlook. This led to huge selling pressure the last days. The chart forms a head and shoulder pattern and totday neckline broke.
Take a look and let me know what you think. Thanks!

Visa bear flag Has some strong support at 224 with fib and 200ma propping it up there.
Short trade setup
A fall below 224 and we be headed to 219 bear flag support.
Now here's where it gets crucial. if we bounce at 219 we could be headed back up to 224 acting now as resistance but if we fall through then our next support is 216 but I think it will eventually drop to 207 where there is a daily fibonacci support and weekly sma100
Long setup - if it bounces at 224 scalp it back up to 234-235

Visa Head and Shoulder Bearish pattern forming with Visa, which could turn into a 15-20% correction if pattern plays out.

V 1H wolfe wave bearishV 1H wolfe wave bearish
A Wolfe Wave is a chart pattern composed of five wave patterns in price that imply an underlying equilibrium price. Investors who use this system time their trades based upon the resistance and support lines indicated by the pattern.

VISA bearish analysisV, bear flag forming on the daily chart. plus looks like a Head and Shoulders pattern forming which is a bearish pattern. Visa has earnings this week.

VISA potential long-got a break of 232usd, not confimred to this point of time
- after 8h close above 233, i think next target would be 237, then 242
- got a lot of triggerwaves and increasing money flow on the 8 and 12h

Inverse Head and ShouldersPossible stop under lower shoulder. Long entry level is a break of the neckline with an uptrend.
Earnings are 10-26 AMC.
No recommendation.
Price appears to be trying to stay above the 50 SMA. The 20 may cross up through the 50 which is a bullish crossover, close but no cigar yet. The 200 is sloping up as is the 20.
I did not leave it on the but William's Alligator indicator is waking up and the shorter term moving averages this indicator uses are in order and pointing up.

Visa Is Starting to Rise Up !Hello everyone, as we all know the market action discounts everything :)
_________________________________Make sure to Like and Follow if you like the idea_________________________________
It looks like Visa Bearish movement has ended when a Breakout of the Descending Channel happened on the 23rd of Sep. after that the stock has started moving sideways with a small edge to the upper direction.
The breakout point has formed what seems to be a solid support level where the market was able to bounce twice from.
The 19th of Oct was a great day for the stock where the market value has jumped from 228.27 to 233.52, a 2,2% increase in 1 day and this bullish push doesn’t seem like it's going to stop yet.
Possible Scenarios for the market :
Scenario 1 :
The market seems to be having a good Bullish momentum at the time this will lead the stock value to push up and hit the resistance level located at 235.14, If the buyers were able to gather more force and breakout that resistance then we will be seeing the price zigzag until it gets to the resistance level located at 247.63.
Scenario 2 :
The Bears might attempt to drive the market back into the descending channel range but they will be met by a big support zone that’s located near the 224.00 range, where a lot of buy power is located, if the Bears were able to drive the price to that level then we will see a big battle where the price will most likely bounce back up and return to Scenario 1 movement.
Technical indicators show :
1) The market is above the 5 10 20 50 100 and 200 MA and EMA (Strong Bullish Sign)
2) The MACD line has crossed the 0 line indicating the market changing from a Bearish state to a Bullish state. With a positive crossover happening between the MACD line and the Signal line
3) The STOCH is in the overbought zone with a positive crossover between the %K and %D
Daily Support & Resistance points :
support Resistance
1) 228.28 1) 232.90
2) 225.90 2) 235.14
3) 223.66 3) 237.51
Weekly Support & Resistance points :
support Resistance
1) 222.71 1) 235.17
2) 214.44 2) 239.36
3) 210.25 3) 247.63
Fundamental point of view :
Large credit card giant Visa is moving into the cryptocurrency space with its own version of credit cards, opening up opportunities for certain large-cap growth ETFs.
With a stake in Visa, ETF investors can play VISA move towards the cryptocurrency space with the Invesco Dynamic Large Cap Growth ETF (PWB).
Indicators point to continued Q4 strength in the domestic air travel recovery, and that's good news for Visa.
The 7-day moving average of U.S. COVID-19 cases, a leading indicator for domestic restrictions and travel, continues to decline since mid-September and Transportation Security Administration screenings as a percentage of 2019 levels improved to 85% from 83% in Evercore's prior Global Air Travel Tracker issue.
This is my personal opinion done with technical analysis of the market price and research online from Fundamental Analysts and News for The Fundamental point of view, not financial advice.
If you have any questions please ask and have a great day !!
Thank you for reading.

Bullish Patterns IdentifiedBullish Engulfing followed by Multiple Bullish pin bars on weekly chart. The price has hit support levels thus increasing chances of reversal and rally with upside potential of about 20% untill next cool off.

Visa Inc. (V) bullish scenario:The technical figure Triangle can be found in US company Visa Inc. (V) at daily chart. Visa Inc. is an American multinational financial services corporation. It facilitates electronic funds transfers throughout the world, most commonly through Visa-branded credit cards, debit cards, and prepaid cards. Visa is one of the world's most valuable companies. The Triangle has broken through the resistance line on 16/10/2021, if the price holds above this level you can have a possible bullish price movement with a forecast for the next 19 days towards 240.18 USD. Your stop loss order according to experts should be placed at 218.63 USD if you decide to enter this position.
Risk Disclosure: Trading Foreign Exchange (Forex) and Contracts of Difference (CFD's) carries a high level of risk. By registering and signing up, any client affirms their understanding of their own personal accountability for all transactions performed within their account and recognizes the risks associated with trading on such markets and on such sites. Furthermore, one understands that the company carries zero influence over transactions, markets, and trading signals, therefore, cannot be held liable nor guarantee any profits or losses.

V potentially carries SPYMomentum of V is looking bullish while tech looks to be a bit bearish
- Support level is around $229
+ 200 EMA is around the same level
+ top disjointed channel will act as resistance if there is a bounce

V - STOCKS - 11. OCT. 2021Welcome to our Weekly V2-Trade Setup ( V ) !
-
4 HOUR
Market about to turn.
DAILY
Expecting more bullish price action.
WEEKLY
Buying the turnover!
-
STOCK SETUP
BUY V
ENTRY LEVEL @ 229.37
SL @ 220.54
TP @ Open
Max Risk: 0.5% - 1%!
(Remember to add a few pips to all levels - different Brokers!)
Leave us a comment or like to keep our content for free and alive.
Have a great week everyone!
ALAN

$V (short term(1-3m)) direction still indecisive this is my first time posting on tradingview so im not sure if my format is appealing; but i linked some posts that i saw value in. the first link showed a massive head and shoulders that is slightly slanted and with the mega caps valuation being through the roof, i personly could see this happening. the second link shows a short bearish trend that at the time of posting wasnt confirmed, but as of oct. 3 that candle of that day made a confirmation of a bullish indication (on my chart). the third link takes the bullish indication from oct. 3 and continues that trend to ATH. From my view, this play is more TA correct than the first link because: long term trend is bullish, on the daily it held 200EMA & 200SMA for the last 3 trading days. but fundementaly speaking, if congress doesnt raise the debt ceiling and america defaults, seeing the massive head and shoulders is instantly more probable. but if congress raises debt ceiling before oct. 18 (they probably will) then i will take deep ITM short term leap and hope fro new ATH
NYSE:V

Short on visa could be wrong usually notlet's see how earnings look i see a huge sell off still on visa and retest back to $203-$207 and when you control 92% of online purchases how does visa continue to sell of especially with everything going to online sales etc.... who's selling visa is the main question.

BACK to ATHVisa looks to have broken downtrend and reversed. It retested the 200MA after breakout.
I am long. I expect visa to go back to 250 and then even higher.
DYOR.
