V trade ideas


upward breakout?New to trading and trying to get feedback, let me know what you think!
Visa is in a descending triangle, which I understand is a neutral, but support is consistent at $195+ since before pandemic. So it should climb?


VISA INC. SHORT📉 NYSE:V SHORT H4
🛒SELL BELOW = 201.54
🎯Target1 = 197.38
🎯Target2 = 194.80
🎯Target3 = 190.65
🛑Stop loss or cancel trade = 208.30
🙈Recommended risk = (2%-3%)
#V #VSHORT #SHORTV #VSELL #SELLV

Bullish on Visa IncRSI towards oversold area. Potential for soon reversal.
Moving averages start moving in bullish direction and MACD turning bullish.
I like this around 196, for a long term move.

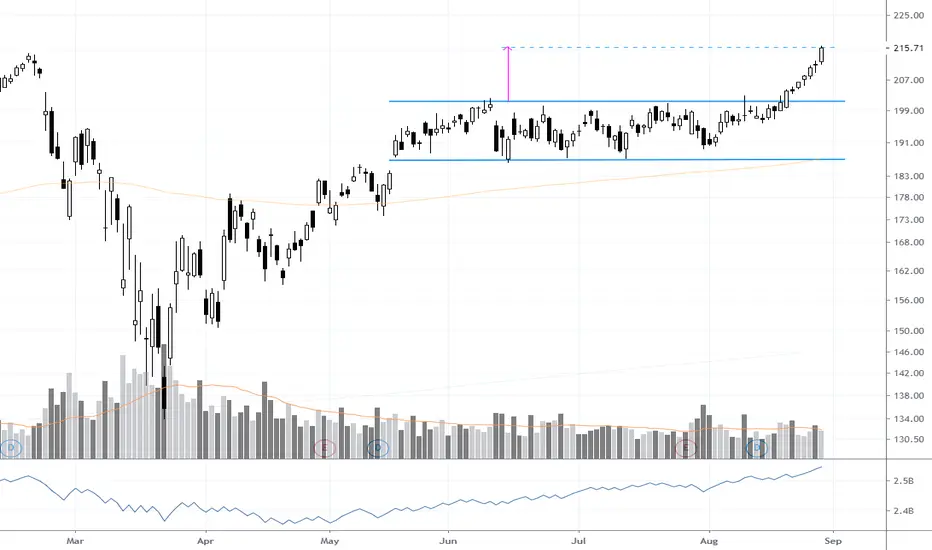
RectangleSorry...199 is not a target but more of a spot to watch for B/O (o: Visa has fallen from several rising wedges and appears to be living in a Rectangle. If she breaks up my stop would be be mid rectangle
I do not go short, but my stop would be the same
One mistake traders can make is making a pattern fit when there is not one..so always double check

$V (Visa) Elliot Wave AnalysisVisa looks to be starting a lower degree wave 3 with the 1.618 extension falling at the $216.77 mark.
I like to make options trades on these waves. I do so buy purchasing an ITM call ($200 strike) and trying to swing the option to near the top of the wave (target $216). A Call Option with a $200 strike and expiration of 9/25 would cost me roughly $450. If my analysis is correct, I will look for profits in the range of $950 - $1150.
All of this ASSUMES the wave 4 (purple) correction is complete at the 0.236 retracement level so I will monitor closely and exercise proper risk management to mitigate any potential losses...
Let me hear your thoughts and as always, don't forget to hit the like and subscribe........

Bitcoin's real value - inflation adjustedThe price of 1 bitcoin in inflation-adjusted USD, starting from Jan 3rd 2009. All price adjustments are based on the current purchasing power of the dollar according to the consumer price index, and comparing to 2009 on the day the genesis block was mined.
You can disregard the invisible Visa symbol. It's a dirty trick that allows me to merge both of the Bitcoin-related price scales without merging in CPI , while also keeping inflation data back to the 2009 genesis block. This is because BLX data only starts in July 2010 and having it as the primary symbol would have suppressed inflation data prior to that. I picked Visa simply because its IPO happened shortly before the first Bitcoin block was mined, so it removes most of CPI's irrelevant data dating back to 1947. Unfortunately I couldn't completely hide it (you can still see its value in the price scale if you zoom out a lot). Additionally, the chart skips the days on which Visa wasn't trading (but that shouldn't matter on a large scale).
Drag the time/price scale to adjust data. Double-click the price scale to auto-fit vertically.

$V projections 12345 elliot wave, good stochastics$V has been on a solid uptrend, hitting all the technical levels. Stochastics look great at the time of analysis, looking to win big, in shares, might go in options for a wave 4-5.

V: the price will move between support and resistanceVISA has returned to value channel and is going to touch it's bottom and then up

Visa for 09162020 SessionWe have a nice buying tail in the low of Monday´s session, and today´s session, price had a rotation above this tail and it generated value higher than yesterday, also, today´s high is poor, for that, reason if we go back to 204,18 we can look for longs to target previous POC (205) and the other target can be 208 to repair today´s poor high


VISA swing idea$V #V Wait for bearish momentum to cool off, 50ema (red line) at support, if it bounces and cross 20ema (red line) will rocket to the pre-market crash level.
Very good risk/reward play backed by exceptional company fundamentals and future prospects.
PriceTarget: 215
Stop loss if going under the 50ema or 200$.

Visa Inc (V) - sell on bounce Visa Inc (V) is in corrective mode as double zigzag WXY, where Y down cycle in play. It has completed A of Y down and B is in progress, so wait for more bounce to get in to for C wave down for target around 195 or even lower. B might end near 202.50-204 and invalidation level should be above 207 for trade set up.

V - 7.17% Profit Potential - Corridor BreakoutBe careful with this one. It is a highly risky trade from a technical perspective, however, I'm keeping the Stop Loss at circa -1% in order to preserve capital.
We traded V a couple of weeks ago, and we made a quick 4% . Visa is one of my favorite stocks to trade and it hardly disappoints me.
Corridor broken out after a 3-month correction following an incredible bull run. Multiple support confirmation on the 5-min chart. Support manage to hold up quite well even during the recent meltdown. Indicators are obviously not on our side, since we are playing the bounce.
- Historical Uptrend
- RSI + Stoch below 50 (!)
- MACD below Signal (!)
Target Entry $201.79
Target Stop Loss $199.17
Target Exit $216.01
About me
- August P/L: +203.83% | Wins 85.19% | No Trades without Analysis
- Note that I tend to adjust stop losses in order to secure profits early and preserve capital. This means that the target price is going to be achieved as long as there are no strong pullbacks that trigger my new adjusted stop loss.

Visa Pulls Back From New HighVisa formed an almost-perfect channel between May and mid-August, and ran to new highs before Labor Day. The recent volatility dragged it lower, but the pullback may be an opportunity.
The patterns are relatively straightforward. One is the $200 level, the top of the channel. That old resistance now seems to be providing support.
Second is the 50-day simple moving average (SMA), which rose up toward the same $200 level.
Finally, V’s price action isn’t exactly a cup-and-handle. However it’s similar, with a high basing pattern followed by a move toward new highs.
V (and Mastercard ) is one of the most direct proxies for consumer spending. That may also set it up to benefit if the pandemic continues to abate.

Visa Reached its #ChartPattern #PriceTargetI posted about the rectangle setup back on July 27th when it was forming. Today, Visa hit its #rectangle price target.
here is the post from 07/27
V Buy Signal!!Just be aware that the market is very volatile right now and anything can happend, remeber always putting a stop loss and risk no more than 1% of your account guys good luck
this trade can be also use for options


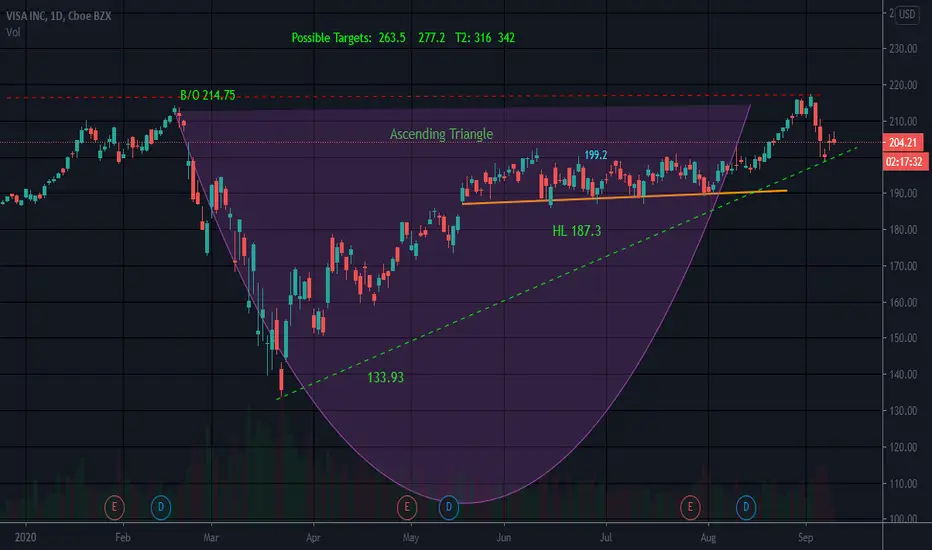
Ascending Triangle Cup and HandleThe top trendline of the ascending triangle seems to be causing V some trouble. The bottom trendline caught it/held as S/ on the 3 day pull back we just experienced
NV is high Seems like this one will push through. Just seems like it (o:
There was a rising wedge a while back but V fell out in May.
Not a recommendation
VISA - Break & Retest On a technical perspective, price has printed a clean break and retest. We are looking for buy entries if price can hold support around the $200 level..
