Cup and Handle ready to complete!A Cup and Handle has been forming on the Daily since the 16th of March, with price breaking out from the handle and coming back to retest the resistance of the cup. Fits all the characteristics with decreasing volume in the middle and increasing on the way up, OBV is looking very good on the Daily, Weekly and Monthly.
Entry: $4.50
Stop Loss: $4.27
Target #1: $5.55 – Area of previous Support/Resistance
Target #2: $6.55 – Measure move of the C&H
WEBAU trade ideas


WebJet - Price chart analysisWebJet - Price chart analysis
Share prices have pulled back to a critical retracement level at 3.04 and now attempting to hold as indicated in Friday's session. The primary support to keep an eye in the next week's session is around 3.04 and 2.90 and resistance level at 3.16 and 3.32.
The short to medium-term price trend is still intact as symbolized in the uptrend price channel. If it bounces off at the bottom of the price channel or 3.04, we could see prices head back up to the top of the price channel.

WEB ASX Couple of weeks ago when analysing some Oz Stocks one of the few who got our attention was Webjet.
WEB is a travel agency operating in Australia and New Zealand, with customers across global consumer and wholesale markets.
Fundamentals are still not great around the travel industry but the technicals on this instrument are suggesting a 200% rally aiming the 8.50$ levels.
WEB saw a straight line sell off from the end of February till mid April. From a technical point of view price reached the end of the extension leg and we expect to se a retracement from these levels.
The little H&S on the daily chart is a sign that the support is quite strong.

WEB JET - LongLong on Web Jet
At bottom
This is an investment, so wont be selling for a couple of Years, or until hit T1


ASX:WEBStrong buyers yesterday, with increase in volume that broke upper trend line of pennant pattern that is in an uptrend
Target based on leg length ( black) line that ties in with weekly supply area


Pennant pattern short trading ideaPennant pattern has formed on this potential pullback. The weekly time frame shows nice steady downtrend with expanding volume indicating the higher time frame has commitment of sellers to continue the downtrend.
Volume on the daily timeframe has contracted in line with a pullback forming the pennant pattern. Volume has began to expand at the end of the pattern indicating sellers may be positioning to continue the downtrend.
Enter if price breaks below the pattern. Target is set at the same distance from the previous pullback to the start of the current pullback.
Exit the trade if price makes a pivot point or the stop loss level is hit.

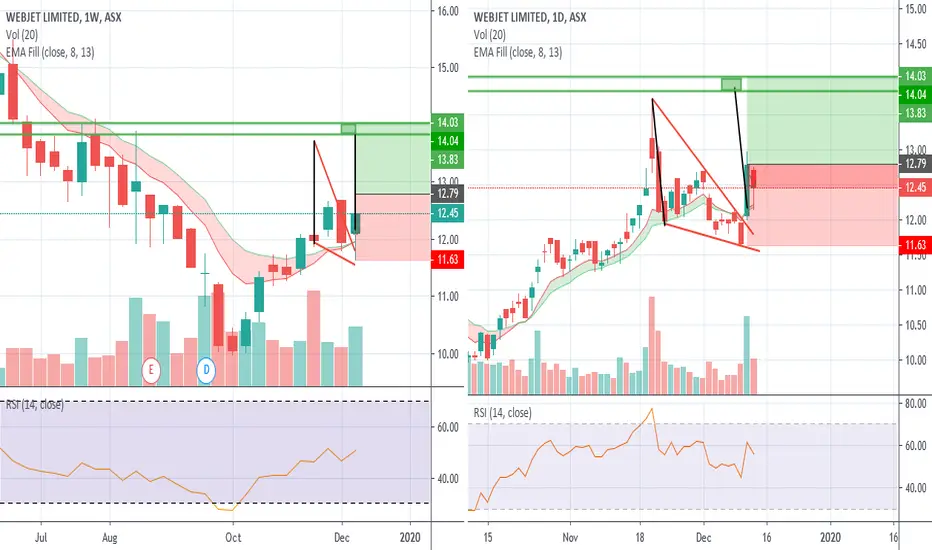
WEB $14.48 handle complete target $17.00Cup and handle into all time highs
Chart has a note or 2 for you

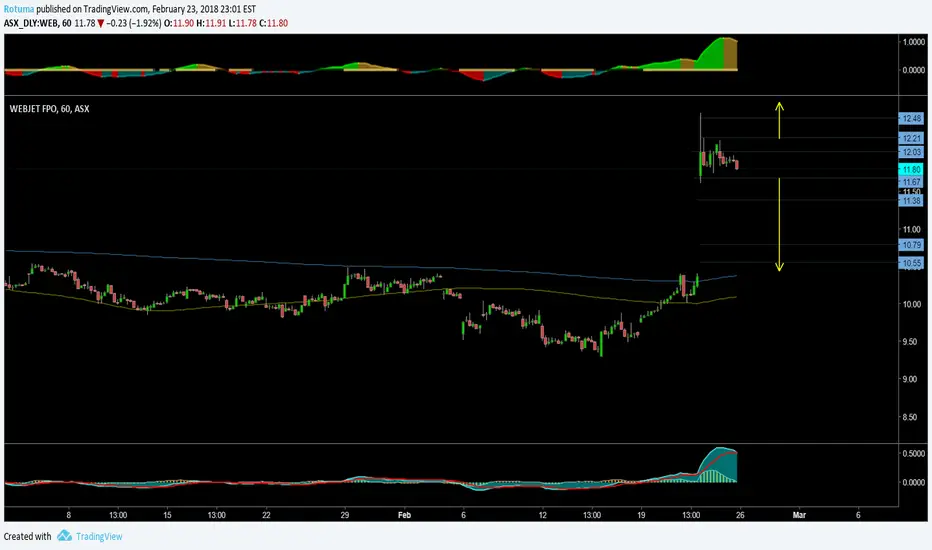
WEB.ASX Short term support and resistanceTake not on the support and resistance marked on the chart if you looking to short or already in a short position. 12.21 and 12.48 are the resistance to look out for. if it stays below 11.67 then you in the right direction