EXXON FORECAST Q2 FY25My targets are clear anyways...
Exxon Mobil's stock performance is closely tied to global oil prices, which are influenced by various geopolitical events and policy decisions. Recent developments involving President Trump's administration and OPEC have introduced factors that could exert downward pressure on Exxon Mobil's share price.
President Trump's Influence on Oil Prices
President Trump has advocated for increased oil production to lower global oil prices, aiming to impact oil-rich nations' revenues and address geopolitical concerns. He has urged OPEC to reduce prices to affect Russia's finances and expedite the end of the war in Ukraine. Such calls can lead to increased production or reduced coordination among oil-producing countries, potentially resulting in an oversupply and subsequent price drops.
Business News Today
OPEC's Production Decisions
OPEC's recent decisions to adjust production levels have significant implications for the oil market. For instance, increasing the production ceiling can lead to higher supply, which, if not matched by demand, may cause oil prices to fall. Historically, such actions have led to declines in Exxon Mobil's stock price, reflecting the company's sensitivity to oil price fluctuations.
The Street
Market Reactions and Investor Sentiment
The interplay between U.S. policies and OPEC's actions creates uncertainty in the oil market. Investors may react to potential oversupply concerns and geopolitical tensions by adjusting their positions in energy stocks like Exxon Mobil. For example, the anticipation of increased U.S. crude output and changes in sanctions enforcement can influence market dynamics, affecting stock valuations.
S&P Global
Given these factors, it's plausible that Exxon Mobil's share price could experience downward pressure due to the combined effects of increased production, potential oversupply, and geopolitical uncertainties stemming from recent events involving President Trump and OPEC.
XOM trade ideas

XOM - Bearish in 4 months more DOWNTREND
The price of XOM has gone too far with the MA200. It will have to return to the MA200 as soon as possible if it does not want to crash.
Let's take a look at its price on the WEEK frame. MA50 and MACD support bearish.
On the DAY frame, the volume decreased, the price movement was low, the candles were very weak. The possibility of continuing the downtrend is very high.
Price target up: $105.94.
Price now: $104.56 (11:15 AM, 04.16.25).
Price target down: $98.00/ $91.84.
The price history will repeat itself as in Q4 2023.
IMO amateur trader.

Oil Prices Rise on Middle East Tensions, Exxon Mobil Corp. SurgeExxon Mobil Corporation (NYSE: NYSE:XOM ) closed at $103.14 on April 11, gaining 3.21% in a single session. The rise comes as oil prices surge, driven by renewed tensions in the Middle East. Ongoing friction between Israel and Iran has heightened concerns over potential supply disruptions. These developments continue to shape investor sentiment across the energy sector.
Historically, geopolitical conflict in oil-producing regions leads to sharp price movements. Market participants often react to perceived threats of supply shortages. These reactions can result in immediate price swings, reflecting uncertainty in global energy markets. Current events have triggered such a reaction, pushing oil prices upward and benefitting energy stocks like Exxon Mobil.
XOM is also preparing for its upcoming earnings report, set for May 2, 2025. Watch closely, especially with the backdrop of global instability. Increased demand for energy assets may play a role in Exxon’s short-term performance.
Technical Analysis
Exxon Mobil recently rebounded from a key support zone at around $98. Price surged from this demand area and is now trading slightly below the 200-day moving average at $111.62.
A strong rally could follow if price holds above the current support. Immediate resistance lies near $120. If broken, the next major target sits at $126.34 previous high. However, a break below the $98 support zone could lead to a deeper decline. The volume surge also confirms increased buying activity, reinforcing the possibility of a continued uptrend in the coming days. Monitor price behavior near $110 for directional clues.

Exxon Mobil Corporation (XOM) - Technical Analysis and OutlookThe Exxon Mobil Corporation (XOM) chart on the 1D timeframe is showcasing a potential bullish setup. Here's a breakdown of the technical factors influencing the stock price and possible scenarios to watch for in the coming sessions:
Chart Overview
Trendline Support: The stock is bouncing off a strong ascending trendline that has been respected since late 2023. This upward sloping support has historically provided solid price rebounds, reinforcing its significance as a key technical level.
Recent Price Action: After a corrective phase, XOM has reversed from its recent low near $105, forming higher lows on the way up. The price has moved above $108.75, suggesting early signs of a bullish continuation.
Targets and Key Levels
Immediate Resistance | Target 1: $114.20 | The first target aligns with a previous horizontal resistance zone. This level also corresponds to a key pivot from the past corrective movement.
Higher Resistance | Target 2: $120.45 | The second target is near $121.45, representing the previous major high and a potential challenge for the bulls.
Support Levels: The first major support is at $106, coinciding with the ascending trendline.A break below this level could signal further downside, with the next support near $100.00.
⚠️ Disclaimer: This analysis is for informational purposes only and does not constitute financial advice. Always perform your own research and consult with a professional before making any investment decisions.

XOM Analysis: Oil's Next Move & Policy ShiftsNYSE:XOM currently piques my interest, particularly with oil prices potentially stabilizing or rising further. Recent geopolitical developments and policy shifts under Trump’s administration—such as rolling back Biden-era energy regulations, reducing methane fees, and easing LNG export permits—could significantly influence the energy landscape.
My intuition suggests Trump’s "Mar-a-Lago Accord" might involve major global economies reducing holdings of US dollar assets, swapping short-term treasuries for century bonds. Such currency shifts and reduced drilling activity could lead to a tighter oil supply, benefiting prices. Additionally, a weakening US dollar could positively impact technology stocks, as investors rotate towards sectors less affected by traditional commodities.
Technical Analysis (Daily & Hourly Chart)
Current Price: Approximately $103.00
Key Resistance Levels:
Immediate resistance: $103.93 (L.Vol ST 1b)
Important resistance zone: $104.74 (118 AVWAP)
Critical resistance (Last week's high): ~$106.46
Key Support Levels:
Near-term support: $101.13 (Weeks Low Long)
Major support: $97.92 (Best Price Short)
Trading Scenarios
Bullish Scenario (Continued oil strength & supportive policy shifts):
Entry Trigger: Sustained breakout and close above immediate resistance at $103.93.
Profit Targets:
Target 1: $104.74 (AVWAP resistance)
Target 2: $106.46 (recent swing high)
Stop Loss: Below recent pivot around $101.00, limiting risk effectively.
Bearish Scenario (Oil price weakness or production surge):
Entry Trigger: Failure to sustain the above resistance at $103.93 or a breakdown below near-term support at $101.13.
Profit Targets:
Target 1: $99.00 (psychological & short-term support)
Target 2: $97.92 (strong support, ideal short target)
Stop Loss: Above $104.75 to control risk in case of a reversal.
Thought Process & Final Thoughts
Given the current geopolitical and regulatory environment, XOM appears poised for potential upside if oil prices remain strong and policy shifts materialize. However, caution is warranted, as oil companies seem hesitant to increase production due to profitability concerns. Clearly defined technical levels will help navigate trade entries and exits effectively around these evolving macroeconomic conditions.
Earnings Date: May 2nd—Keep positions nimble as earnings can significantly impact short-term volatility.

XOM Coiling Under Resistance: Gamma Breakout or Rejection Setup?1. Market Structure Analysis: XOM has formed a balanced range after printing a Break of Structure (BOS) and two notable CHoCHs on the 1H timeframe. Price is consolidating inside a green supply zone between 118.50–119.90, with wicks tapping the top of the zone but no clean breakout yet. The price structure is forming higher lows from the March 28th pivot, signaling accumulation beneath key resistance.
2. Supply and Demand Zones:
* Demand Zone (Support): 117.21 → Strong historical zone and prior low from BOS candle.
* Supply Zone (Resistance): 119.00 – 119.90 → Flat ceiling that's held since March 26.
3. Order Blocks and Support/Resistance:
* Resistance: 119.90 (key gamma wall + SMC zone)
* Support: 117.21 (red BOS support and trendline base)
* Trendline: An ascending support trendline from March 28th low is intact. Watching for a triangle breakout or breakdown.
4. Key Indicators (MACD, Stoch RSI):
* MACD shows a bullish crossover with histogram building strength.
* Stoch RSI is rising out of oversold territory and nearing mid-zone. Still room to run before hitting exhaustion.
These indicators currently support momentum building toward a bullish breakout.
5. Options Flow / GEX Sentiment Zones:
* Highest positive GEX: 120.00 → Gamma resistance and breakout target.
* Call Walls: 119.00 (74.31%), 121.00 (moderate), 124.00 (light).
* Put Walls / Downside GEX: 116.00 is the HVL + strong negative gamma level, 115.00 and 113.00 are next layers of support.
Options Oscillator:
* IVR: 29.1
* IVx avg: 24.2
* Put$ Flow: 24.3%
* GEX Bias: Strongly bullish with green bars stacked to 124
This setup supports a potential gamma squeeze if price pushes above 120 with strength.
6. Scalping vs Swing Outlook:
* Scalp Bullish Trigger: Break and hold above 119.90 = breakout play to 121.00.
* Scalp Bearish Trigger: Rejection at 119.90 = short setup back to 118.30–117.90.
* Swing Bullish Setup: Entry on retest of 118.50 with SL below 117.20 and PT at 121.00 → 124.00
* Swing Bearish Setup: Only valid if clean break below 117.20 with volume, targeting 116 → 113.
7. Actionable Suggestion: If XOM opens above 119.50 and breaks 119.90 with increasing volume and flow, look for a momentum breakout toward 121 and 124. If the move stalls under 119.90 again, consider fading the resistance for a pullback play.
8. Conclusion: XOM is coiled for a potential breakout, sitting just below a major resistance cluster at 119.90. Gamma levels and bullish options flow favor an upside push, but failure to break could trigger mean-reversion. Watch for volume and reaction at the 120 level.
9. Disclaimer: This analysis is for educational purposes only and does not constitute financial advice. Always do your own research and trade responsibly.

EXXON MOBIL: This strong rally won't end any time soon.Exxon Mobil is about to turn overbought on its 1D technical outlook (RSI = 67.390, MACD = 2.260, ADX = 52.087) as for the 4th straigh week it is posting gains. This rally started on the first week of March when the stock almost touched the bottom of the 2 year Channel Up. This is a similar bullish wave to the one that started after the January 2024 bottom, which eventually reached the 1.236 Fibonacci extension. Aim for a bit under the top of the Channel Up (TP = 128.00.
See how our prior idea has worked out:
## If you like our free content follow our profile to get more daily ideas. ##
## Comments and likes are greatly appreciated. ##

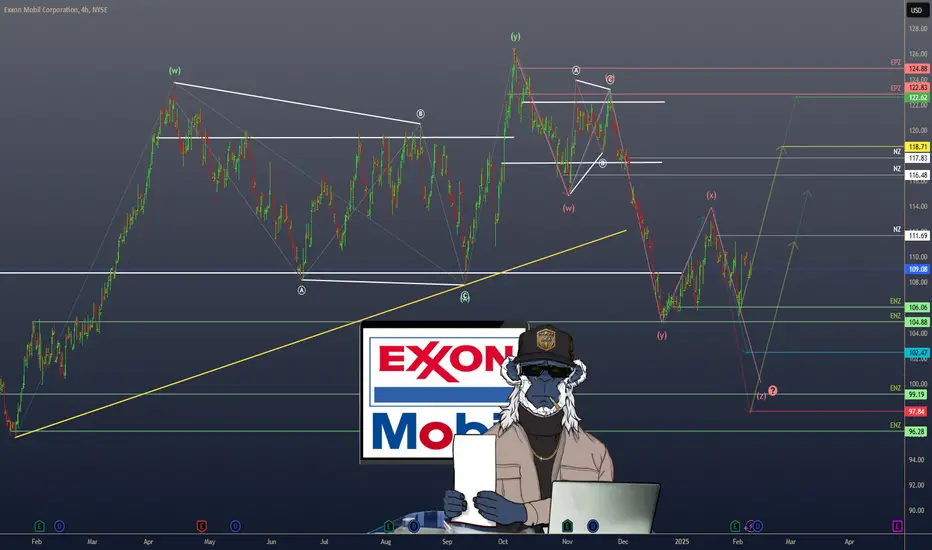
ExxonMobil: Toward the ResistanceExxonMobil: Toward the Resistance
As planned, XOM recently continued to rise with the magenta wave . We give this movement a bit more room, but another smaller corrective movement of wave should start below the resistance line at $126.34 before XOM ultimately surpasses this mark. Once the upward movement stalls below $126.34, it is important that the price doesn't fall too deeply afterward. After all, there is a 40% probability for our alternative scenario, where not wave in magenta but wave alt.2 in turquoise would develop its high – confirming an already established top of the overarching wave alt.(B) and, thus, a generally corrective scenario.

XOM - Good Shot to Hit 150Reverse Head and Shoulders seems to have building out for some time. The Major Right shoulder appears to be completing the head of yet another reverse head and shoulders pattern. When this formation resolves, no reason that XOM can't easily pass 150.
My gut is telling me that the inflation is going to get really ugly. Can't imagine that oil prices won't keep pace. With their acquisition of Pioneer not long ago, they will prove to be the kinds of the Permian Basin. Drill baby drill.


Nice Support And Resistance But fill the GAP!After the jump up to $110 where we have strong resistance and we have for awhile. this seems to be the sweet spot. It did go up to $112 in Pre market but at open it quickly shot down. $108 seems to be a strong support level. Im really hoping this is the play in which we are able to fill this gap. After the gap fill then we can really focus on the support and resistance and hopefully touch $112 and stay there. Safe Trading, I watch this stock like a hawk so im sure I will be updating this all the time.

Exit Tight Trading Range on Exxon. XOMTight trading ranges are always tough, as they cause indicators to constantly throw off false signals. There is no way to know which signals will be false. Taking a chance on this one nonetheless. Three soldier candlestick pattern that breaks MIDAS curve and crossings on VZO+offset and Ehlers StochRSI. BB%PCT also crossed zero line. vWAP/US duo in alignment and supportive. It is uncommon to see all the stars lineup like that.
ExxonMobil: Final Pullback ExpectedExxonMobil should soon resolve the ongoing sideways phase, allowing the turquoise wave 2 to establish its corrective low below $104.84. This final pullback is still needed before the next impulsive rally unfolds. Alternatively, there is a 32% chance that the key low was already settled by the turquoise wave alt. 2. A break above $123.74 would confirm this scenario.

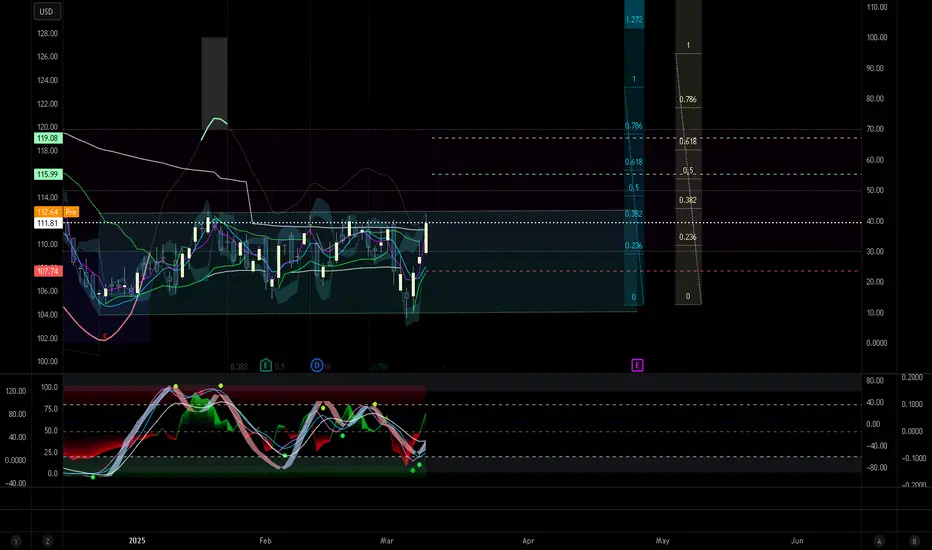
XOM at a Pivotal Zone! Will Bulls Take Control?Technical Analysis (TA) Overview:
📌 Price Action: XOM is testing a key reversal zone, showing strong buying pressure after breaking out from a descending trendline. The price is now consolidating near resistance.
📌 Support & Resistance:
Resistance Levels: $112.87 (Major Resistance), $115 (Call Wall)
Support Levels: $109 (High Volume Node), $108 (Put Wall)
📌 Indicators:
MACD: Bullish momentum building, but still in a weak positive zone.
Stoch RSI: Overbought levels (95+), suggesting a potential short-term pullback before continuation.
📌 Volume Profile:
High liquidity around $111-$112, indicating a potential battle between buyers and sellers.
GEX (Options Analysis) - Key Insights:
📌 Gamma Exposure (GEX): Positive GEX at higher levels suggests dealers may hedge by selling, acting as resistance.
📌 Call Walls (Resistance Levels):
$112-$115 (Highest positive GEX zone) → Likely resistance, where price action might slow down.
$120 (Extreme Call Wall) → If momentum sustains, this could be a long-term target.
📌 Put Support Levels:
$109-$108 → Strong support, if broken, could trigger a sell-off to $105 (next put support).
📌 Options Sentiment:
IV Rank (IVR): 32.7 → Moderate implied volatility, options not overly expensive.
Calls 11.3% → Mild bullish positioning in the options market.
Potential Trade Setups:
✅ Bullish Scenario: If XOM holds above $111, a breakout toward $115+ is possible.
❌ Bearish Scenario: Failure to hold $109 could send XOM back to $105-$106.
💡 Suggestion: Watch for a retest of $109 as support before a breakout move!
📌 Final Thoughts:
Short-term traders: Look for confirmation above $111 for a quick move to $115.
Swing traders: Ideal entry on a pullback to $109-$110, targeting $115+.
Options traders: A breakout over $112 with rising call positioning could fuel momentum.
📢 This analysis is for educational purposes only and does not constitute financial advice. Always do your own research before making trading decisions! 🚀
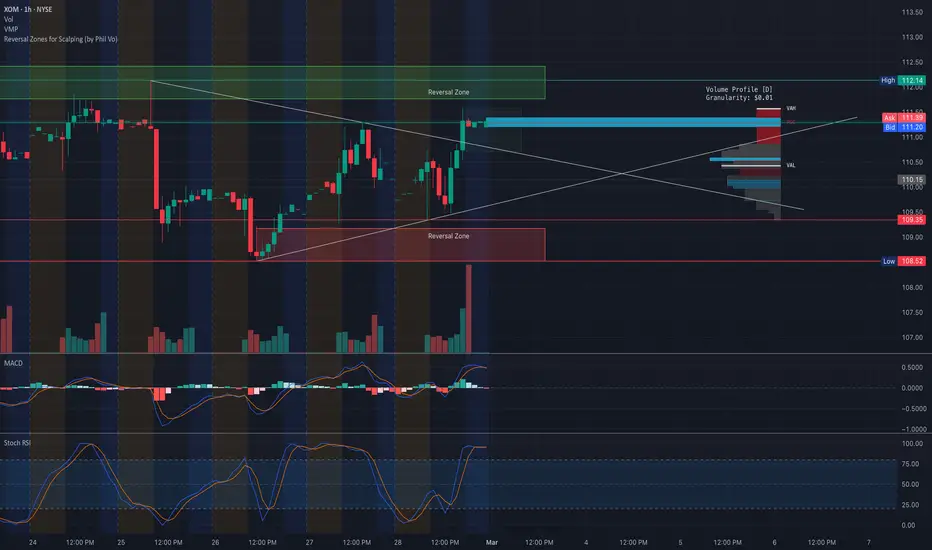


XOM Approaching Resistance! Will It Break Out?Technical Analysis (TA)
Current Market Structure:
* Price Action: XOM has rebounded strongly from the $108 support level, forming an ascending trendline while approaching a key resistance near $111.10 - $112.00.
* Trendlines: There’s a breakout attempt from a wedge pattern, indicating a possible continuation toward higher levels if sustained buying pressure persists.
Indicators:
* MACD: Showing a bullish momentum with a positive histogram, but the signal line is slightly flattening—watch for a potential crossover indicating trend continuation or weakness.
* Stochastic RSI: Overbought (above 90), signaling possible short-term consolidation or a minor pullback before continuation.
Support & Resistance Levels:
* Immediate Resistance: $111.10 - $112.00 (Key breakout zone)
* Major Resistance: $115.00 (Psychological level + call walls from GEX)
* Support Levels: $109.71 (trendline support), $108.00 (critical support zone)
Gamma Exposure (GEX) & Options Flow
Key Insights from GEX:
* Bullish Gamma Walls:
* $115.00 – Strongest Call Resistance Zone → If breached, expect a gamma squeeze pushing prices higher.
* $112.00 – Second Call Wall (53.98% probability of hitting)
* $110.00 – Holding as a pivot zone; breaking this level with volume could confirm further upside.
* Bearish Put Walls:
* $108.00 – Put Support Zone → If the price falls below, downside risk increases.
* $105.00 & $100.00 – Major Put Walls, meaning strong downside hedging activity.
IV & Options Sentiment:
* Implied Volatility (IVR 21.2, IVX Avg 22.5) – Moderate volatility, indicating a balanced risk.
* Put Activity: PUTS at 36.8%, meaning downside hedging is still active.
* Call Activity: Moderate bullish positioning, suggesting controlled upside with resistance at $112 - $115.
📊 Trade Setups & My Suggestions
Bullish Scenario:
* Entry: Above $111.10 (Confirmation of strength)
* Target 1: $112.50
* Target 2: $115.00 (If gamma squeeze triggers)
* Stop Loss: Below $109.50
Bearish Scenario (Failure to Break Resistance):
* Entry: Below $110.00 (Breakdown confirmation)
* Target 1: $108.00
* Target 2: $105.00
* Stop Loss: Above $111.50
Final Thoughts
* XOM is at a critical breakout zone near $111.10.
* Bullish continuation is likely if we break $112, targeting $115.
* Failure to hold above $110 could lead to a pullback toward $108.
* Options data suggests heavy resistance at $112 & $115, but if breached, a gamma squeeze could fuel rapid upside momentum.
⚠️ Disclaimer:
This analysis is for educational purposes only and does not constitute financial advice. Always do your own research and manage risk before making any trading decisions.

EXXONMOBIL ($XOM) EARNINGS & OUTLOOKEXXONMOBIL ( NYSE:XOM ) EARNINGS & OUTLOOK
1/7
ExxonMobil is back in the spotlight after Q4 2024 earnings. ⚡️💰
From a $59.5B Pioneer merger to record Permian production, there’s plenty to unpack. Let’s dig in!
2/7 – Q4 & FULL-YEAR EARNINGS
• 2024 earnings: $33.7B, down from $36.0B in 2023
• Q4 2024: $7.6B net income (~$1.72/share), with $12.2B in operating cash flow
• Distributed $36B to shareholders in 2024—talk about rewarding loyalty! 💸💥
3/7 – EXPANSION & STRATEGY
• Targeting higher output in Permian Basin & Guyana, despite oil oversupply
• FWB:20B annual share-repurchase program planned for 2025
• Recent Pioneer merger boosts upstream portfolio—long-term production potential just got a big upgrade 🚀
4/7 – VALUATION VS PEERS
• P/E ratio ~13–14, below the industry range (15–18) ✅
• Dividend yield ~3.5%, beating the 3.0% sector average
• Stacks up against Chevron ( NYSE:CVX ) & Shell ( NYSE:SHEL )—but ExxonMobil’s Guyana assets could be the real differentiator 🌍⛽️
5/7 – RISK FACTORS
1️⃣ Oil oversupply + OPEC+ cuts → Price uncertainty 📉
2️⃣ Global economic slowdown → Softens demand
3️⃣ Regulatory scrutiny → Heightened costs
4️⃣ Shifting to renewables → Could reduce big-oil momentum
6/7 Is ExxonMobil truly undervalued given its strong cash flow & dividend?
1️⃣ Yes – Undervalued gem
2️⃣ No – Oil oversupply risk is too high
3️⃣ Maybe – Need more clarity on renewables
Vote below! 🗳️👇
7/7 – SWOT SUMMARY
• Strengths: Advantaged assets (Permian/Guyana), robust cash flow 🏭
• Weaknesses: Reliance on oil price, smaller renewables exposure
• Opportunities: Pioneer merger, carbon capture, high-value chemical products
• Threats: Regulatory, oversupply, economic slowdown

XOM - preparation for great earnings!Hi guys we would be looking at XOM, just before their earnings! Let's take a look into the fundamentals
Robust Financial Performance
Exxon Mobil has demonstrated resilience with consistent earnings growth and strong cash flow generation, even amidst fluctuating energy prices. The company’s disciplined capital allocation strategy and cost-management initiatives have positioned it well to maximize shareholder returns.
Dividend Stability and Yield
XOM remains a top choice for income-focused investors, maintaining its status as a Dividend Aristocrat. The company’s strong dividend history reflects its commitment to rewarding shareholders, which further enhances investor confidence.
Favorable Market Conditions
Global energy demand remains on an upward trajectory, fueled by economic recovery and industrial activity. Exxon Mobil's diversified portfolio across oil, natural gas, and chemical sectors allows it to capitalize on these trends, while its focus on high-margin projects strengthens profitability.
Strategic Investments in Growth
Exxon Mobil’s ongoing investments in key growth areas, such as Guyana's offshore assets, low-carbon technologies, and LNG production, position it for long-term growth. These projects are expected to generate substantial returns and bolster the company’s competitive edge in the energy sector.
Positive Analyst Sentiment
Many analysts have revised their price targets for XOM upwards, citing its strong fundamentals, operational efficiency, and capacity to adapt to evolving energy trends. This bullish sentiment reflects the broader market's optimism regarding Exxon Mobil's prospects.
Energy Transition Opportunities
While maintaining its core oil and gas operations, Exxon Mobil has also been actively investing in carbon capture and storage (CCS) technologies and other low-emission energy solutions. These initiatives align with global sustainability goals and offer new revenue streams for the company.
Technicals are written on the chart we are sitting on the upper support block which gives us an indication that we would move into the resistance level which is where our target is going to be situated
Entry: 110
Target: 123.50

XOM calls 115 area1/21 XOM tested the 115 area however when market open we consolidated in the 111-112 area. 110 has became support and we have inside candles on 4hr, daily weekly and monthly. I’m looking to catch a reversal back into the 120-122 area if we can hit out first point of 115.91. XOM does have earnings soon and we could continue to see increase volume and bullish moment push into the stock. With time on contract I would pick March honestly we can see XOM break out to upside.

Downward for Exxon Mobil. XOMPicture is highly suggestive of an Elliott downward impulse, with wave 5 remaining. Momentum is certainly building, indicators are about to turn.
The narrow price action in the most recent candles are highly suspect for a wave 4 in the undergoing impulse. Fibtime is not excluding the possibility of Wave 5 yet.
We are not in the business of getting every prediction right, no one ever does and that is not the aim of the game. The Fibonacci targets are highlighted in green or purple with invalidation in red. Confirmation level, where relevant, is a pink dotted, finite line.
Fibonacci goals, it is prudent to suggest, are nothing more than mere fractally evident and therefore statistically likely levels that the market will go to. Having said that, the market will always do what it wants and always has a mind of its own. Therefore, none of this is financial advice, so do your own research and rely only on your own analysis.
Professionally, we are big fans of any indicators from Jurik, De Mark and Ehlers, which we use in addendum in analysis prior to putting down positions.
We prefer a combination of at least four technical factors to favor a particular stance. A stance is never decided by this constellation, rather the constellation merely confirms the stance.
Trading is a true one man sport. No single confluence of indicators is truly good enough, and a professional trader's sense must be developed through a lot of hard work and over a significant period of time. Good luck out there and stay safe.
