Gold stopped falling and stabilized and reboundedIn terms of market conditions, yesterday there was another big drop, from 3386 to 3260, with a total drop of 126 US dollars. This is the power of Trump's speech on reducing tariffs. Gold prices rise and fall as soon as he opens his mouth. Sometimes I really doubt whether he, a businessman, is investing. There may be a group of people around him who know his speech in advance and wait for the capital market to make money.
Back to the point, the entire decline of gold from 3500 to 3260 reached 240 US dollars, which took only two days. While the price fell, it brought about the correction of technical indicators, especially the daily line just stepped back on the short-term moving average, and the hourly line and the 4-hour cycle showed a healthy state. The market returned to the technical trend, but the current high price base brought about large daily fluctuations, so you should get used to it and do a good job of risk control.
At present, gold has stopped falling and stabilized. The daily line closed with a big negative for two consecutive days. The correction of the decline of 240 US dollars is almost in place, which is basically the same as the adjustment of 210 US dollars in the previous round. Then the probability of breaking the low again today is not high. The retracement adjustment in the strong bull market is generally about three trading days. Today is the third day. Combined with the decline in the previous two days, it is likely to fluctuate widely today.
Lianyang's rise was blocked by the first-line pressure of 3367 and fell back. Pay attention to the first-line support of 3330 to continue to be bullish. The upper pressure is at 3385-3386. If it touches it, you can go short.
GOLD trade ideas

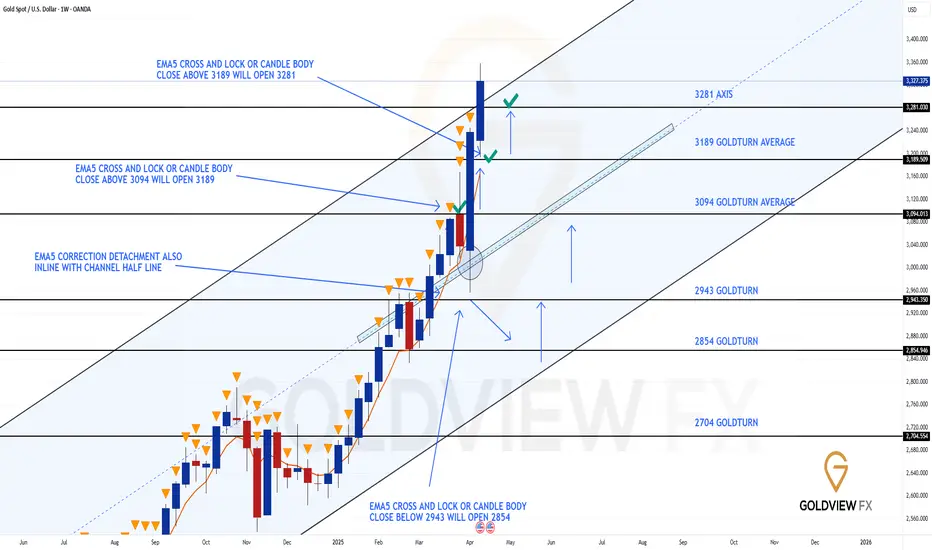
GOLD WEEKLY CHART MID/LONG TERM ROUTE MAPHey Everyone,
Please see update on our week chart idea, which has been playing out perfectly allowing us to track the movement down and trade the movement up and finally complete - BOOOOM!!!
After completed all our [previous targets on this chart, we were left with a body close above 3189 leaving a long range/term gap to 3281. This target was hit last week completed this chart idea.
We will now update a new weekly chart idea next week with more long term/range projections. Please keep an eye out for this for next Sunday or if we get a chance, we will try and get this out earlier.
However, please note if we see a rejection here on the channel top, then the lower levels within the channel, are still valid to track the movement down and up.
Thank you all for your likes, comments and follows, we really appreciate it!
Mr Gold
GoldViewFX
Gold 3260-3370 life and death tug of war!Spot gold prices remained weak during the European trading session, with prices approaching the key support area of $3,265-3,260. Signs of easing global trade relations and a small rebound in the US dollar have put pressure on gold prices. In addition, the decline in gold consumption in some economies in the first quarter of 2025 has also become another factor suppressing precious metals. Current market sentiment is in a cautious wait-and-see state. On the one hand, signs of easing global trade relations have triggered the withdrawal of some safe-haven funds; on the other hand, the persistence of geopolitical risks and expectations of interest rate cuts by the Federal Reserve are still supporting the bullish position of gold. The market is highly sensitive to the upcoming US economic data, especially GDP and non-farm payrolls, which may become a key trigger for gold price movements in the short term.

Gold trading signal analysisTrading Setup:
There is a Trading Signal to Sell in Gold XAUUSD (4h)
Traders can open their Sell Trades NOW
⬇️Sell now or sell on 3364.0
⭕️SL & BUY @ 3415.0
🔵TP1@ 3224.0
🔵TP2@ 3151.0
🔵TP3@ 3001.0

Real-time Operation Explanation of XAUUSDLooking back on our previous analyses, we have repeatedly emphasized the close correlation between the easing of tariff issues and the pullback in the price of gold 🔍 Now, based on the judgment of the latest market dynamics, today's trading strategy for gold still maintains short selling as its main tone 📉 Here, we solemnly remind all freelance traders that to avoid the risk of account liquidation caused by drastic market fluctuations, it is advisable to stay away from taking long positions as much as possible ⚠️
From a technical analysis perspective, 3340 has formed a solid resistance barrier 🚧 Once the price of gold rises and reaches this area, it is highly likely to encounter strong selling pressure and decline 📉 This is precisely the optimal time to place a short order 📝 If the price breaks through 3340, look up to the range of 3360 - 3380, and continue to place short orders. In addition, the price range of 3330 to 3320 deserves special attention 👀. As the starting point of a large bullish candlestick on the hourly chart, it is also a potential support level for long positions during retracements 📈 At the same time, the gain or loss of the key support level of 3280 below is of great significance 📊 If this support level is effectively broken, it indicates that the bearish forces have full control of the market, and the price of gold may initiate a new round of decline ⬇️ The next target price can be focused on around 3195 🎯. It is crucial to keep in mind that in the actual trading process, formulating a rigorous SL and TP strategy, as well as reasonably managing the position size, are the keys to achieving stable trading 🔑
⚡️⚡️⚡️ XAUUSD ⚡️⚡️⚡️
🚀 Sell@3380 - 3360 - 3340
🚀 TP 3330 - 3320 - 3300 - 3280
Accurate signals are updated every day 📈 If you encounter any problems during trading, these signals can serve as your reliable guide 🧭 Feel free to refer to them! I sincerely hope they'll be of great help to you 🌟

Gold prices bottomed out and rebounded, market trend analysis.Analysis of gold trend: From the perspective of market sentiment, interest-free gold as a safe-haven asset has performed strongly this year, with prices soaring by nearly $700 and hitting record highs several times. However, the recent optimistic expectations of easing global economic and trade relations have boosted market risk appetite, and the equity market has generally performed positively. Some funds have flowed out of safe-haven assets such as gold and turned to risky assets, which is also the main psychological factor under pressure on gold prices. If market risk appetite continues to improve, global economic and trade relations further ease, and the US dollar strengthens, gold prices may face greater downward pressure. From a technical point of view, the gold price needs to effectively fall below the $3,265-3,260 range in the short term before a larger correction downward may be confirmed. Once confirmed to fall below, the gold price may quickly fall to the 50% retracement level near $3,225, further pointing to the $3,200 mark. If $3,200 is lost, it will suggest that gold may have peaked in the short term.
Gold opened higher in the Asian session on Monday and continued to fall last week after hitting 3336. The idea of the Asian session was to directly bearish at the analysis point of 3277. After hitting the lowest point of 3268, it fluctuated upward. The European session also fell to 3273 and then rebounded. The highest point in the US session just reached 3336 again, a standard bottoming and rebounding trend. Since it is an adjustment structure, let's re-analyze the idea. The gold price fell at 3500 and rebounded at 3260 last Wednesday. The rhythm was volatile. It rebounded above 3260 many times below and did not cross the first rebound high of 3367 above.
Today, we mainly focus on the closing price. If it stands firmly at the 3313 line, we will adjust our thinking on Tuesday. On the contrary, it will fall back after encountering resistance at 3336, today's opening high, and go to 3278. On Tuesday, we will continue to look at the idea of swinging and falling. Now it is the end of the market, and the market is also falling from a high.

XAUUSD Sniper Plan – April 24, 2025🟡 XAUUSD Sniper Plan – April 24, 2025
Post-Claims Setup | No Bounce Nonsense. Just Zones That Hit.
🔻 SELL ZONES – Premium Rejections Only
SELL #1 – 3384–3392
📌 HTF Flip Zone + FVG + EMA100
SL: 3400 | TP1: 3355 | TP2: 3320 | TP3: 3288
SELL #2 – 3408–3416
📌 Imbalance Gap 3411 + OB + NY Spike
SL: 3425 | TP1: 3375 | TP2: 3345 | TP3: 3315
SELL #3 – 3448–3455
📌 HTF OB + Fibo Extension + Trap Risk
SL: 3465 | TP1: 3415 | TP2: 3380 | TP3: 3340
🟢 BUY ZONES – Real Demand Only
BUY #1 – 3310–3316
📌 CHoCH + M30 OB + RSI Divergence
SL: 3300 | TP1: 3340 | TP2: 3370 | TP3: 3390
BUY #2 – 3275–3285
📌 HTF Demand Base + Oversold RSI
SL: 3260 | TP1: 3310 | TP2: 3340 | TP3: 3370
🧠 STRUCTURE & BIAS
• HTF Bias: Bullish
• LTF Flow: Bearish until 3384–3392 breaks
• ⚠️ 3408–3416 = key for mitigation before any real breakout
• Target rejections first, not dreams
🎯 Plan ready. Zones set. Now it’s your turn, sniper.
🟡 If this breakdown helped clear the noise, hit that Like
💬 Got a bias or reentry zone of your own? Drop it below
📲 And don’t forget to Follow – we’re building gold logic, not fairy tales
Let’s dominate the session. One sniper entry at a time 💛

Gold trend picks directionGold fell by 230 USD in a row on the daily line. Currently, 3500 is under short-term pressure. Today, we will focus on the continuity of the decline. It directly rushed from 3288 to 3310 in 5 minutes after opening. Yesterday, it hit the lowest point of 3258 above the 0.5 division of 2956-3500. This position is temporarily supported and rebounded, but whether the adjustment is over is still uncertain. It depends on the intraday closing pattern. If today's closing can stand above the MA5 daily moving average resistance of 3358 again, then there will be signs of the end of the downward adjustment, and the next day must be accompanied by a positive line. Pull up; on the contrary, if it closes below the 5-day MA, then there is a high probability that the 10-day moving average position will continue to decline, and then the 50-division position 3228 is further down, which happens to be the starting point of the big positive on April 16. This is likely to be the end point of this round of adjustment, or there will not be much room to go down, because from the standard wave pattern, it cannot fall below the first wave high, which is 3167, which is also the current middle track; therefore, either 3228 will stabilize on dips, or somewhere in the 3228-3167 area will stabilize, and then finally return to the bullish trend and pull up
The short-term 4-hour middle track 3380 has been lost and has become a key counter-pressure point. As long as it does not stand above it again, it will maintain a downward correction. After breaking 3292 below, the 66-day moving average of 3260 will be the loser or loser; the 1-hour K-line is under pressure from ma10 and ma5 and continues to fall. After yesterday's consolidation and pull-up, the K-line has now re-run above ma10, and the macd has formed a golden cross below the zero axis. This wave of 200 US dollars of rapid decline has almost corrected most of it. If it continues downward for another wave, or with the help of bottom divergence, it will slowly brew a short-term bottom; today's gold rebound focuses on the resistance below 3367, below the extreme middle track of 3380, and it is still bearish if it cannot withstand the pressure. If the strong support of 3260 or 3245-28 is stable, we will start to consider bottom-fishing.

Elliott Wave Count: Preparing for Final ImpulseHello, traders
XAU/USD appears to be in a textbook 5-wave impulsive structure on the 4H chart, with the market now completing Wave 4 as a classic ABC corrective flat/pennant.
The impulsive move from the Wave 2 low has formed clear internal substructures, with Wave 3 exhibiting extended price action, consistent with Elliott Wave guidelines.
Currently, price is consolidating in a contracting pattern labeled Wave 4 (A-B-C), which looks to be near completion. Based on wave symmetry and Fibonacci projections, a strong upside move is anticipated once Wave 4 concludes, leading into the final Wave 5 rally.
Entry Zone: 3286.875
Target: 3367.440– 3410.210
Stop Loss: Below 3260.190.

Gold Swing Short Trade Setup**Gold Market Analysis: Potential Reversal Formation**
Gold is finally showing strong signs of a potential top formation after an extended bullish run. After weeks of anticipation, yesterday's price action delivered a significant rejection candle at the psychologically important 3500 level, which could indicate the reversal signal we've been waiting for.
It's essential to recognize that in a robust bullish rally, tops can take longer to form than initially expected, as we've observed recently. The market often exhibits both time and price extensions in such conditions. Nevertheless, the rejection at 3500 in conjunction with the current technical setup suggests that we may be seeing a reversal pattern taking shape.
**Trading Perspective:**
From a trading standpoint, I am currently awaiting a confirmation candle (a follow-up to yesterday's rejection) to validate that the top is in place. If we witness follow-through selling pressure today or tomorrow, it could present an excellent swing short opportunity, with the following targets established:
- **Target 1 (TP1):** 3295
- **Target 2 (TP2):** 3250
- **Target 3 (TP3):** 3200
- **Target 4 (TP4):** 3170
- **Target 5 (TP5):** 3070 (psychological support level)
Stay vigilant and ready for potential short opportunities as the market unfolds. Let’s see if the signals align for a successful trade. Happy trading! OANDA:XAUUSD OANDA:XAUUSD EIGHTCAP:XAUUSD EIGHTCAP:XAUUSD

GOLD - at his fresh resistance ? What's next??#GOLD... perfect drop below our area as we told youabout CUT N REVERSE.
now market have 3328 to 3332 region as a current resistance region.
And market dropped 200 points around in 2 days (almost 1 day and 1 hour)
So keep close your region because if market holds that then further drop expected.
Good luck
Trade wisely

Gold 100% Profit SignalGold has retreated from $3,500, is the price near a top? Possibly. But I wouldn't sound the alarm bells just yet. This is most likely due to some regular profit-taking. The high indicators are more of a warning than a call to arms. Rather than "get out of here," it's more of a "stay alert."
At present, the initial support below is in the 3405-3400 area. Further down are the two key support levels of 3380 and 3357. 3380 is the support level near the middle track of the 4-hour level, and 3357 is an important top and bottom conversion position in the previous period. These two positions still provide strong support for the future market rise. At present, the 4-hour level high has closed in a bearish pattern of Yin engulfing Yang engulfing, and the K-line is negative. The short-term is expected to improve and fall back. Short-term operations will mainly rebound from high altitudes. Pay attention to the resistance near 3435 and 3450 on the top and do not break the air. Pay attention to the support near 3408-3400 on the bottom. If it breaks, adjust the position and continue to look at 3380.

Gold (XAUUSD) Take Profit📉 Gold (XAUUSD) Trade Update
A few hours ago, I shared a short setup on gold — it has successfully hit the target and closed with a solid profit.
Looking ahead, there's still room for further downside. In the medium term, gold could decline towards the $3020 level.
🔔 I post detailed trade ideas and daily market analysis like this every day on my TradingView profile.
👉 Follow me to get notified and read the full breakdowns.

Gold trend analysis strategyIf the price does not break the 3270 area then I expect the price to enter the 3300 area and above... If the price breaks the 3270 area downwards, I expect the 3240-3160 area this week.

Gold bull and bear tug-of-warGold fluctuated widely last Friday, with the range exceeding 100. This week, we need to pay special attention to the release of ADP employment data. Currently, the upper resistance is 3336-3340 and the lower support is 3260-3265. It is recommended to go long on the pullback.

Gold maintains bullish mindsetThere is a fierce game between bulls and bears in gold prices, but we remain bullish in the long term. The intraday layout follows the general trend and focuses on the gains and losses of the 3260 support below. As long as it remains above 3260, we will maintain our bullish outlook and wait for the gold price to fall slightly to around 3275 before we can intervene and go long in batches!
Gold is long near 3275, stop loss 3260, target 3300
Analysis on the 10 Elite PairsYou can follow us for more Analysis(Images and Videos) with Precise definition of the Financial Market.

Gold fluctuates and converges, waiting to break!Currently, the upper rail is at 3344 and the lower rail is at 3273. They may not completely touch the upper and lower rails, but there is a certain support or pressure performance near them. Now the key middle rail has been lost again. Under the pressure of 3315, there is still a chance to go down and get closer to the lower rail. The current 3323 line is a watershed. If it can withstand the pressure here, there is still room for a second downward exploration. In terms of short-term operation ideas for gold, it is recommended to short on rebounds and long on pullbacks. The short-term focus on the upper resistance of 3323-3325 is the focus, and the short-term focus on the lower support of 3270-3275 is the focus. Gold operation strategy: Short (buy short) two-tenths of the position in batches near 3320-3323 when gold rebounds, stop loss 6 points, target near 3300-3285, and look at 3275 if it breaks;

GOLD AGAIN BULLISH GUYS Gold bullish today guys !!
Market will be soon 3500$
First reach our target 🎯
Our target 3381$ then we will see 3500$

GOLD Free Signal! Sell!
Hello,Traders!
GOLD went up from the
Support just as I predicted
But is now retesting a local
Horizontal resistance structure
So we can go short with the
Take Profit of 3320$ and
The Stop Loss of 3374$
Using small lot size is
Highly recommended
As it is a risky setup
Sell!
Comment and subscribe to help us grow!
Check out other forecasts below too!
Disclosure: I am part of Trade Nation's Influencer program and receive a monthly fee for using their TradingView charts in my analysis.

XAUUSD Bearish More (Must Read Caption)📊 XAUUSD (Gold) Analysis Of 28th April 2025.
📊According to my personal analysis Gold will Bearish More to My Given Targets .
✅️There is Strong Support 💪 at 3263-62 but I haven't pointed it .
🎯Technical Targets are 3233-3202.
Boost up & Comments.

April 24 NY Recap – XAUUSD Buy Sniped from 3310 to 3340🎯 April 24 NY Recap – XAUUSD Buy Sniped from 3310 to 3340 💥our first TP
Today’s NY session was all about precision and patience.
🔹 The market opened with a calm continuation of the post-Claims structure, giving bulls a final chance to reenter from the 3310 sniper zone, previously posted in our daily plan.
📍 Breakdown of the 3310 Buy
• Zone: H1–H4 demand confluence
• Confirmation: Clean rejection on M15, followed by consolidation and impulsive breakout
• Confluence:
– Untouched OB + FVG
– Price locked above M30 EMA100
– Discounted fib zone
– RSI bounce on M15
• Execution: Buy 3310.70 → TP 3340.78
• Result: +300 pips
Not just a technical win — but a mindset win. Snipers don’t chase. They wait.
🧠 NY Session Notes
• No macro drivers today, which gave full control to pure PA + structure
• Liquidity was swept below 3310 before aggressive buying stepped in
• Once price reclaimed 3330–3340, we saw a clean continuation to premium
• TP hit with no retest — textbook sniper exit
💬 Let’s Talk – No Chart Needed
📈 Did you catch the 3310 buy?
💭 How did your NY session go?
👇 Drop your thoughts or reentry ideas below — we learn every session.
📲 Like, Comment, and Follow to keep this stream of real structure-based updates alive.
We don’t predict. We react.
And today, we reacted perfectly. 💛

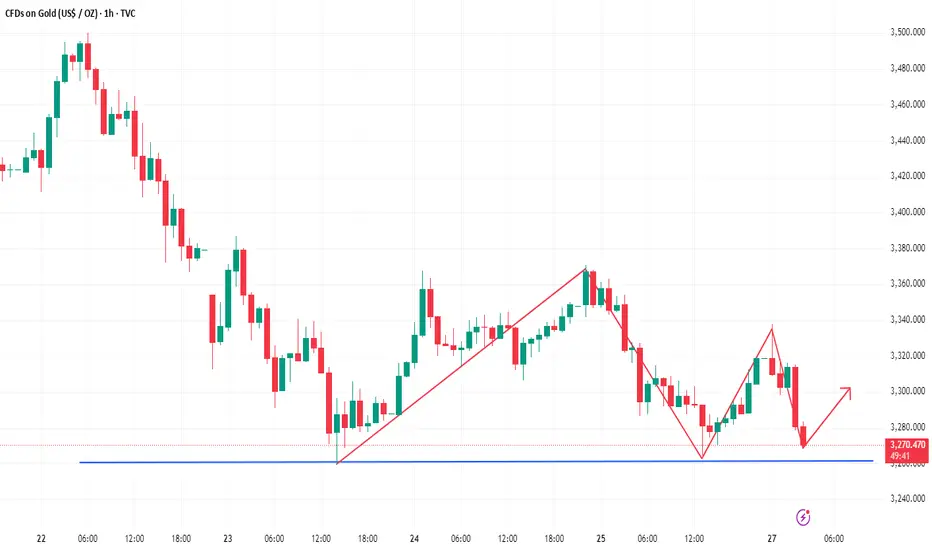
GOLD ( XAU:USD) : Potential Bearish Pennant + Correction WaveGood morning, traders.
Please note, this is Not Financial Advice (NFA) —always conduct your own research and risk management.
1. Technical Analysis
We are currently observing the formation of a potential bearish pennant, with price action consolidating between converging trendlines. This formation appears to align closely with the Elliott Wave correction structure, particularly within the A-B leg. The apex of the pennant lies just after wave (B), suggesting a potential breakdown into wave (C), completing the corrective sequence.
Should this pattern confirm, we could anticipate a continuation of the downward movement, targeting deeper support zones in line with previous wave (4) levels.
2. Trend Structure
Wave (5) appears to have completed, initiating the A-B-C correction.
The corrective leg A → B is now complete, with price action consolidating near the upper resistance of the pennant.
A breakdown below the lower support trendline could confirm wave C in motion, reinforcing the bearish outlook.
3.) Macro Environment & Market Sentiment
Recent developments from the U.S. administration have introduced uncertainty in macroeconomic policy:
Tariffs:
Former President Donald Trump has hinted at a potential rollback of the 145% tariffs on Chinese goods, acknowledging their long-term unsustainability. Treasury Secretary Scott Bessent clarified that any changes would be part of bilateral negotiations and not unilateral actions. Major U.S. retailers have raised concerns over ongoing supply chain disruptions, adding pressure to de-escalate trade tensions. However, Trump insists tariffs won’t be eliminated completely, signaling no immediate resolution.
Federal Reserve Leadership:
Trump also walked back earlier statements threatening to dismiss Federal Reserve Chair Jerome Powell, now affirming that Powell will serve out his term until May 2026 . While this move has slightly calmed markets, Trump continues to pressure the Fed to lower interest rates amid persistent inflationary concerns. Although this softening stance introduces a degree of stability, the underlying tension between fiscal and monetary authorities remains.
