Gold accurate top judgment and high efficiency one-way follow-upGold, the general trend is as described in yesterday's analysis. The market is currently in an irrational upward cycle dominated by risk aversion. Although there is no reversal signal in the daily chart structure, the price is running on the upper Bollinger track of the daily, weekly and monthly charts at the same time. The attached indicator is overbought, and we need to be alert to the risk of selling at high levels; on Tuesday, the white plate hit 3500 and then fell back. The 4H chart recorded the first entity engulfing and continuous negative in the past two weeks. The market outlook is actively bearish, and the initial target looks back at 3400; violent selling, a sharp drop to 3314, the idea is verified;
The daily chart transcribes a long upper shadow and a big negative, visible It is a signal of stagflation, so just follow the trend today; short-term resistance during the white session is 3350-3358, strong resistance gap 3366-3372 and 3314-3500 connecting 38.2% node 3384; short-term support 3330-3320, strong support 3314, break down to 3284;
Strategy 1: Sell near 3358, protect 3368, target 3314; hold after break;
Strategy 2: Sell near 3384, protect 3394, target 3314; hold after break;
GOLD trade ideas

Analysis on the 10 Elite PairsYou can follow us for more Analysis(Images and Videos) with Precise definition of the Financial Market.ENJOY!!!

Gold shocks pull the trend towards the bearish side!Gold market trend analysis:
Gold technical analysis: You should have seen the exaggeration of gold, right? Gold has also experienced several major ups and downs in history, but this time is definitely one that can be recorded in the history books. The daily lines in the past few months are very exaggerated, and the rise and fall range is unprecedented. Just today's Asian market, a simple dive is dozens of points. This is the market. The market is always right. We need to respect it the most, rather than blindly look at it subjectively. Surviving in such a big market is the most important thing. Many times, the fluctuation of gold is basically not related to technicality. We try to follow the direct pursuit mode in operation, and we can catch big profits in such a big market. Last week, the weekly line closed with a big tombstone, the weekly line top appeared, and the air force appeared. In May, gold will at least adjust to around 3,000.
The above is the 4-hour pattern, which is repairing below the moving average. If the bulls break 3370 again, there is a possibility of rising again. Otherwise, gold will adjust deeply again. This wave of adjustment is at the weekly level. The daily pattern is also turning into a peaking mode. Note that the rise and fall of gold is not based on technical aspects, but more on fundamentals and big data, as well as the impact of tariffs. Without these influences, we will be bearish this week. If the decline of the big C wave continues, the target will be 3230 (the half point of the entire April rebound) in turn. 3165 is the Fibonacci 61.8 position of the callback and also the previous high point, which is easy to form a rebound. Today's gold focuses on two major suppressions, one is the hourly suppression around 3300, and the other is 3315 and 3328, both of which are opportunities for air forces. On the whole, today's short-term operation strategy for gold is to short on rebounds and to buy on pullbacks. The upper short-term focus is on the 3298-3300 resistance line, and the lower short-term focus is on the 3265-3260 support line. Friends must keep up with the rhythm. It is necessary to control the position and stop loss, set stop loss strictly, and do not resist single operation. The specific points are mainly based on real-time intraday trading. Welcome to experience, exchange real-time market conditions, and follow real-time orders.

Gold long cross Yin star hintsAt the operational strategy level, it is recommended to implement a dynamic short position layout based on the strength of the rebound: if it rebounds to the 3330-3372 pressure zone, you can choose to enter a short position based on the K-line pattern and momentum indicator, and strictly set the stop loss above the pressure level; the effectiveness of the two major support levels of 3300 and 3270 needs to be monitored below. If there is no physical break in the above-mentioned area when it falls back to the above-mentioned area, and accompanied by the cooperation of long volume, you can consider switching to a long strategy after the support platform stabilizes, forming a two-way response framework of shorting at pressure levels and going long at support levels.

XAUUSD - LAST WEEK on APRIL 2025The correction phase in the gold price movement has occurred in the past few days.
With the current Price Action, we can conclude that there is already strong support for the gold price.
The price have a high probability to make a NEW ATH.
And this is the last wave 5.
Target : 3525-3530
Have a good luck !

The Fed's dilemma keeps gold prices dormantAt the daily level, this decline pierced the 10-day moving average and rebounded. Yesterday, the U.S. market fell to a low of 3306, which happened to be close to the 10-day moving average. It can be seen that the effectiveness of the 10-day moving average support has become the key to today's market. In the short term, we can rely on the 10-day moving average to continue to see a shock rebound. If today's rise breaks through and stabilizes the 5-day moving average, then this wave of adjustment will be over, and the market will return to a strong position again. If the 10-day line is lost, the market will be at risk of accelerating its retreat to 3228.
In the short term, at the 4-hour level, the market showed signs of stopping the decline and stabilizing at 3260. The K-line is currently above the moving average, but it has not stood firmly above the middle Bollinger rail, which is not an extremely strong state. Below the middle rail, we can still see adjustments at high altitudes. If it falls downward, pay attention to 3315 and 3306, near last night's lows, and look for a rebound. In the short term, operate in the 3306-3356 range, focus on the strength of the European session and then arrange the US session.

Daily live trade with XAUUSD in 15m/30m/1h 20250430Daily live trade with XAUUSD in 15m/30m/1h 20250430

Gold's second bottoming out shows a range, Layout direction!Gold fell back after reaching a high this week, and the highest reached 3500, which was under pressure. The weekly line finally closed with a Yin cross star. It is expected to be a wide sweep range next week, and the overall range will remain at 3370-3260. After breaking through, it will follow the trend. The daily line has bottomed out and rebounded, and the rebound strength is also strong. Finally, it closed with a long lower shadow Yin line. The repeated sweep of hundreds of points is still the main tone. There is no clear direction signal. The upper pressure is around 3348. If the rebound continues at the opening next week, pay attention to this position. If it breaks through, look at 3370-80. Pay attention to the support below 3288 and 3260. Treat it as a shock in operation, and try to participate in the band near the key position!
Operation suggestion: Gold is long near 3285-95, and look at 3325 and 3248! Shorting is possible if the upper 3248 pressure is not broken!

XAUUSD Sells on possible tariffs reduction on ChinaFX:XAUUSD
XAUUSD
✏️Gold has rose roughly 30% since Trump took office in Jan 20 early this year, trading at about 2,700 per ounce, to highest at 3,500 on 22 April. Price has recently also reacted off the 0.79 fibre zone, giving a fantastic reaction upside, but failed to break above the HTF Resistance.
🔖Trump recently has also mentioned that he would not fire Fed Chair Jerome Powell, and we could see him lowering his 'tough guy' attitude towards China. On his recent speech in the Oval Office he said “I'm not going to say, oh I’m going to play hardball with China, I’m going to play a hardball with you, President Xi”, and “we’re going to be very nice”.
📌On the other hand, a White House official mentioned about possible reduction of the 145% tariffs to less than half of its current charges. Note that, this happened before the China's foreign ministry spokesperson Guo JiaKun clarified that the two countries had not held any negotiations on the tariffs, and reached to any agreements. Treasury Secretary Scott Bessent did mention about the rates being 'unsustainable', as well as Powell warning about Trump's tariffs worsening inflation and slowing the economy. From these sources, we could perceive it as, the US may desperately need the negotiations with China, than vice versa.
📌As mentioned by Radomski ( news article referred below), we could be experiencing the ‘Buy the Rumour, Sell the News' effect, where investors sought to buy low risk investment products, such as Gold at the beginning of the year due to expected tariffs implementation and trade wars, and selling safer investment products when they see better opportunities. Rarely, we experience ATHs after ATHs without significant corrections. Therefore in this scenario, we could expect at least a few % of short term correction in the near future.
Let me know what you guys think!
🔗Sources: www.investing.com
www.reuters.com
spectrumlocalnews.com

GOLD...LONGPYTH:XAUUSD
Market structure suggests is preparing for its next move.
The AND level will likely play a critical role in the upcoming direction.
** If structure breaks and confirms the shift, a new bias might form after the retest. **

Lingrid | GOLD Weekly OUTLOOK: strong UPTREND with RetracementsOANDA:XAUUSD continues its bullish momentum, closing another week up approximately 3.5%, primarily driven by Wednesday's breakout candle that pushed above the previous week's high. Following this strong upward movement, we've observed a period of retracement that manifested as a pinbar formation on the 4H timeframe. While this candlestick pattern typically signals continuation, the market's hesitation to move higher suggests a deeper pullback may be ahead. At current price levels, we're likely to see the formation of a continuation pattern, potentially a triangle that could provide an excellent entry opportunity.
Looking lower timeframes reveals the potential development of an ABC pullback, which would strongly indicate another bullish move upon completion. On the daily timeframe, this retracement will likely take the form of an inside bar candlestick pattern—a formation traditionally associated with trend continuation when traded in the direction of the prevailing trend. Despite these short-term fluctuations, the bullish trend remains firmly intact, supported by ongoing geopolitical tensions, uncertainty surrounding central bank policies, and sustained physical demand from Asian markets.
Traders, if you liked this idea or if you have your own opinion about it, write in the comments. I will be glad 👩💻

Gold suffers from short selling and may fall sharply!The market is basically in a weak decline during the day, and the rebound is not strong. The hourly chart shows more negatives than positives, which shows that there is still a decline. As for the position selection, it is not recommended to chase the short position. If it can reach the high point of 3323-3324, it is still possible to continue to short. The support below is 3287-3270. If it falls below the low point of 3260, then pay attention to the top and bottom conversion position of 3245.

Gold's safe-haven demand weakens, gold prices peak and fallExpectations of the Federal Reserve's monetary policy:
According to the latest data from CME's "Fed Watch", the market's expectations for the Federal Reserve's monetary policy shift are undergoing subtle changes. The probability of maintaining interest rates unchanged at the May interest rate meeting is as high as 91.7%, while the probability of a cumulative interest rate cut of 25 basis points is 61.8%. This shows that the market generally expects the Federal Reserve to maintain policy stability and may start a rate cut cycle as early as June. This change in expectations has weakened the attractiveness of gold as an inflation hedge tool, as the postponement of interest rate cut expectations has reduced market concerns about inflation risks.
Geopolitical and trade situation:
Former President Trump recently stated that he would abandon his threat to fire Federal Reserve Chairman Powell, a move that significantly reduced the risk of politicization of US monetary policy. At the same time, his optimistic statement on Sino-US trade negotiations further weakened the market's risk aversion demand. The reduction in political uncertainty and the easing of trade tensions have doubled the risk of gold's safe-haven appeal, leading to capital outflows from the gold market.
Daily level:
Gold showed a typical high-rise and fall trend yesterday, with the daily line closing with a negative column with a long upper shadow, which is usually regarded as an important signal of a staged peak. The upper shadow shows that bulls encountered strong selling pressure when trying to push up prices, and finally bears dominated. The $3,500/ounce area constitutes an obvious resistance level, and the suppression effect of this position is confirmed.
Hourly level:
The short-term trend shows the market's turning point more clearly. Gold prices fluctuated lower after being under pressure in the 3,500 area. The $50 low-opening gap that appeared this morning is particularly rare. This gap often indicates an accelerated change in trend. Although there was a technical rebound in the early trading, it failed to form a sustained buying order. Instead, it encountered resistance again in the 3342/3343 area, confirming the short-term bear-dominated market pattern.
Key price:
Resistance: 3342/3343 area (short-term), 3335/3338 area (ideal entry position for rebound short orders)
Support: 3290/3285 area. The gains and losses of this support range will determine the further opening of the downward space
III. Operation strategy suggestions
Trend judgment:
The current gold market has formed a stage top, and the technical form shows that the trend has turned from long to short. The short-term market shows obvious short-term arrangement characteristics, and it is expected that the downward trend will continue during the European trading session.
Trading suggestions:
Short order strategy: It is recommended to arrange short orders in the 3335/3338 area, with a stop loss set above 3350 and a target of 3290/3285 area
Position management: In view of the abnormal volatility in the early trading, it is recommended to adopt a light position trial strategy and gradually increase positions after the trend is confirmed
Risk warning: Pay attention to the performance of the 3290/3285 support area. If it breaks down effectively, it may trigger an accelerated decline, otherwise it may usher in a technical rebound
IV. Market sentiment and capital flow
Market sentiment has clearly turned to caution. The sharp low opening in the early trading has led to the outflow of some long stop-loss orders, exacerbating price fluctuations. From the perspective of capital flow, the changes in the open interest of COMEX gold futures show that some longs are withdrawing from the market. At the same time, the holdings of gold ETFs have been stable in recent days, with no obvious signs of increasing positions, reflecting that institutional investors are taking a wait-and-see attitude towards the current price.
V. Outlook for the future market
In the medium term, the trend of gold will depend on two key factors: one is the specific time when the Federal Reserve's monetary policy turns, and the other is the development of the global geopolitical situation. Before the June interest rate meeting, if the US economic data continues to be strong, the expectation of interest rate cuts may be further postponed, which will put continuous pressure on gold prices. In the short term, the technical short position has an obvious advantage, and the operation should be mainly short-selling on rebounds. Pay close attention to the performance of the 3290/3285 support area. Whether this position is broken or not will determine the further opening of the downside space.

GOLD - at CUT N REVERSE region? what's next??#GOLD. market perfect move as per our analysis and now market just reached at his CUT N REVERSE level
that is around 3305-06 to 3312
keep close that area because if market hold that area in that case you can see another bounce from here otherwise not at all.
so Note that below 3312 we will go for cut n reverse on confirmation.
GOOD LUCK
TRADE WISELY

GOLD → Recovery after the FB of 0.5 fibo. What's next?FX:XAUUSD on Thursday tests 0.5 fibo, which I outlined to you on April 17, forms a false breakdown and recovers amid unstable geopolitical relations in the world. Price may continue its northward run.
The dollar continues to fall. The fundamental background depends on the relationship between the US and China as well as economic data especially after Powell's speech. The weekly session closes close to support, the decline may continue.
Gold after the shakeout is heading back north. Based on the fundamental background, the price may continue to rise. There are three days of downtime ahead as traders rest.
Fundamentally, anything can happen over the weekend, however, technically, the emphasis is on intermediate levels. The trend is still strong and bullish
Resistance levels: 3332, 3344, 3357
Support levels: 3313, 3288, 3284
If nothing supernatural happens over the weekend, gold in the Asian session may bounce off the nearest resistance and test trend support before continuing the uptrend. If there are any critical changes in the mood of countries/politicians then I will update the situation
Regards R. Linda!

Gold looking bullish Target 3500$ then we will see market reach target market looking bullish if our target reach I will update you

XAUUSD LONG Long time price rising near the support line, but later it made a correction movement, breaking this line.
Then price had a sharp impulse that confirmed bullish structure and started to grow inside a rising channel.
After reaching the top boundary, the price reversed and started a pullback to the support area near $3265.
This zone also aligns with the channel base and acted as a bounce point before, making it a strong technical level.
Now the price is consolidating above this support, forming a higher low, which may confirm continuation.
As long as price holds, and I expect it to bounce from support line and push toward $3480 channel resistance.

XAUUSD- Mid Term Chart Description – XAUUSD 1H (Gold Spot vs. USD)
This is a multi-scenario Smart Money Concept (SMC)-based projection chart for Gold (XAUUSD), focusing on potential bullish retracements and major bearish continuations, incorporating Buy Zones, Sell Zones, and Change of Character (CHOCH) areas.
🔍 Key Components:
🟣 Sell Zones
Two sell zones are identified, with the highest near the All-Time High (ATH) around the $3,500 mark.
These are areas of expected bearish reaction if price retraces upward after a low.
🟢 Buy Zones
Located between $3,200 – $3,160 and another deeper one near $2,960, where potential bullish reactions may occur.
🔵 CHOCH - 4H
Marked in red around $3,260 area, indicating a 4-hour Change of Character, suggesting a potential shift from bullish to bearish sentiment.
🔸 Key Price Levels
$3,120: Historical support/resistance.
$2,956.20: Major swing low and key demand zone.
📊 Projected Market Path (Colored Waves)
🔹 Blue Path (Bullish Retracement Scenario)
Price is expected to retrace into a sell zone around $3,400–$3,460 after testing the current demand.
From there, a major sell-off is anticipated.
🔷 Cyan Path (Bearish Continuation)
Following the retracement, the market is projected to break below the recent low and head toward lower buy zones, potentially near the $3,120 and $2,960 regions.
Shows lower-high and lower-low formation, consistent with a bearish trend.
🧠 Market Sentiment
This chart suggests a bearish outlook for Gold unless a structural shift invalidates the CHOCH zone and supply levels. The chart highlights the importance of:
Waiting for confirmation in the supply zones before shorting.
Considering buy opportunities only in valid buy zones with bullish reaction confirmation.

Gold fluctuates at high levels and is ready to goIn the 4-hour chart, the mid-term bottom continuous positive pattern reflects the bullish strength, but the current price has not effectively stood above the middle track of the Bollinger Bands, so it is not in a very strong state. Based on this, there are still trading opportunities for falling back and going long today, and the support points below the small cycle level are at two key points of 3320 and 3310. If the gold price falls back to the above key support levels during the Asian and European trading sessions, you can follow the trend to arrange long orders, and the key to the market rhythm is still in the US trading session. If there is a unilateral surge in the US trading session on Friday, you can look at the extreme rising target; if there is a shock sweeping market during the US trading session, you don’t have to be obsessed with the gold price will definitely go out of the big rise space, and you need to flexibly adjust the trading target according to the actual market changes.
Overall, in terms of today's short-term gold operation ideas, it is recommended to use the rebound high-altitude as an auxiliary strategy and the retracement low-long as the main strategy. The short-term focus on the upper side is the 3327-3454 line resistance area, and the short-term focus on the lower side is the 3286-3360 line support area.
Operation strategy:
Gold is recommended to rebound to high altitudes as the main, and to fall back to low altitudes as the auxiliary. The short-term focus on the upper side is 3327-3454 line resistance, and the short-term focus on the lower side is 3286-3360 line support.

Doubletop suppressionVS multi-bottom support Entry at key pointsGold rose sharply in the U.S. market yesterday, and the daily line finally closed the Yang cross star, approaching the end of the monthly line. Recently, it has been a yin-yang cycle sweep pattern. Therefore, today we need to be careful to prevent the market from falling back and then closing in the negative range. The wide sweeping range remains at 3370-3270. If the position is broken, look at the unilateral direction. In the 4H cycle, the continuous positive pattern breaks through the mid-track, and the short-term trend is stronger. , but Bollinger has not opened his mouth, and is not optimistic about the breakthrough range. The short-term support is around 3315, which is also yesterday's low point. If it falls below, it will go to 3302. Therefore, today's operation will continue to grasp the key positions. The upper pressure will focus on 3354 and 3370, and the lower support will focus on 3315 and 3300. Go high and low in the range! Do high-altitude and low-multiple in the range!
Operation suggestion: Buy gold near 3305-3300, look at 3320 and 3345!

Gold Weekly Bias (April 28-May 2, 2025) Weekly Bias
Looking at how the week performed after reqching an all time high at around 3500 the price fell to close at around 3316. And that is lower that 3356 closing lower to prior week’s high. This tells me that next weeks possible target will be last week’s low (3259) or old weekly lows (3193) which happens to be a weekly fair value gap (W FVG)

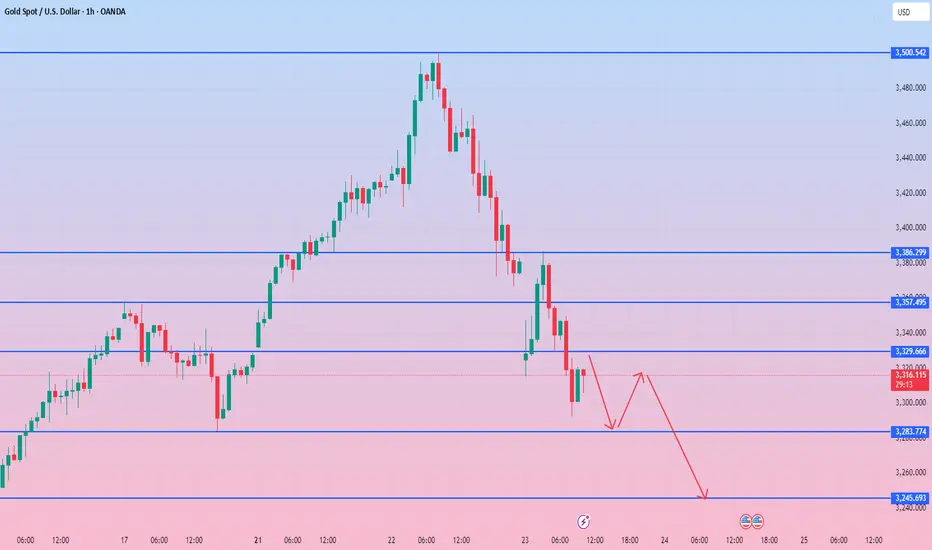
XAUUSD - All Eyes on the Reaction Zone for Directional ClarityThe Gold Spot price chart shows a clear potential for price movement toward the highlighted reaction area between approximately $3,360 and $3,380. After reaching highs around $3,500 on April 22, gold has experienced a significant correction, forming a series of lower highs and lows. The current price action suggests that gold may be preparing for a rebound toward this critical reaction zone, as indicated by the upward green arrow. Once gold reaches this reaction area, traders will need to closely monitor price behavior for confirmation of whether this represents a temporary bounce in a larger downtrend or the beginning of a new push toward previous highs. Key technical indicators at this level will determine if gold has enough momentum to break through resistance and potentially retest recent highs, or if sellers will emerge again, forcing another leg down toward recent support levels around $3,270-$3,280.
Disclosure: I am part of Trade Nation's Influencer program and receive a monthly fee for using their TradingView charts in my analysis.

The gold market suddenly "changed its face"Gold plunged down from the high of 3500 yesterday, mainly due to the fact that US President Trump said at the swearing-in ceremony of Atkins, chairman of the US Securities and Exchange Commission, on Tuesday local time that he had no intention of firing Fed Chairman Powell, although he was disappointed that the Fed did not cut interest rates faster. The cooling of risk aversion directly affected the gold price, which once fell to $3366, and then closed near 3382, with the largest drop of 134 points on Tuesday. This wave of gold correction is still continuing. After opening today, it fell straight to 3315. Although it has completely recovered the decline, I think the short position still has continuity, so today's operation strategy is still mainly high-altitude.
Gold is currently trading below 3357. There are signs of a rebound in gold prices at the beginning of the European session. Now the upper suppression level can be moved down. The short-term suppression reference is 3330 here, followed by the second highest point on the way up to 3357; the lower support focuses on the vicinity of 3285, and after effectively breaking it, it can focus on the vicinity of 3245. Now the gold price is trading near the Asian low of 3315. The prudent operation idea is to short at 3331 to protect the gold price near 3320 and wait for the gold price to reach 3285. After the break, wait for the rebound to 3300 and then go short to 3245. It is not recommended to participate in long orders.