GOLD - at CUT N REVERSE region? what's next ??#GOLD. market just placed his one of the most expensive region that is around 3265-70
keep close that region because that is our cut n reverse region so stay in long only above that.
keep close and don't be lazy.
good luck
trade wisely
GOLD trade ideas

Elliot Wave B then C on 4hrTo confirm a low is in and Wave B’s final leg is starting:
✅ 15M CHoCH – Price must break previous lower high (LL > HL shift).
✅ Bullish volume surge on breakout.
✅ Higher low retest (entry zone).
✅ RSI breaks above 50.
This would line up with a reversal inside your 4H Demand/Reaction Block, adding confluence from both timeframes.


Gold: No Signs of Reversal - Bullish Momentum is IntactGold: No Signs of Reversal - Bullish Momentum is Intact
Gold continues its bullish momentum, showing no signs of reversal on the horizon. In less than 24 hours, the price surged from $3,245 to $3,356, reinforcing strong upward pressure.
What’s Next?
If this trend persists, the next key resistance levels to watch could be around $3,400; $3450 and $3500
A possible consolidation may occur before further upside, but so far, there are no indications of a bearish correction.
You may watch the analysis for further details!
Thank you and Good Luck!
❤️PS: Please support with a like or comment if you find this analysis useful for your trading day❤️


How Many Trades Does It Take to Get Rich?Let me tell you straight — one trade won’t make you rich. It’s almost impossible. The odds are simply too low. And that’s the very foundation of my approach — an approach that has already brought me meaningful results.
The Myth of the One Trade
The biggest trap traders fall into is placing all their hopes on a single trade — one that’s supposed to fix everything. That’s where the problems begin: oversized positions, impatience, emotional attachment... and eventually, tilt. And tilt does exactly the opposite — it wipes out your account.
The solution? Stretch the process out over time. Doing this alone significantly increases your chances of actual profit — instead of blowing everything up in a short burst.
What That Creates
By shifting away from the “one big trade” mindset, you remove urgency, bring risk under control, and turn your trading into a stable process. That’s the core of what I teach: break your trading into as many small, manageable episodes as possible.
Divide your “luck” into smaller parts — and you’ll be able to attract it in the long run.
This mindset comes with far more advantages than downsides. And deep down, you already know that. So start applying it — make this your starting point toward meaningful results.
Letting Go of the Old Way
Don’t worry about how long it might take to see significant growth in your account. You can always go back to your old way of trading — jumping in and trying to “make money today.” But ask yourself: how many times do you need to get burned before you finally shift from a short-term mindset to a long-term one?
Add to that some information isolation — stop feeding your brain constant news noise. Let go of headlines that pretend to predict the market. Free yourself from that influence, and you’ll start to see the charts clearly — without the illusions, without the made-up narratives.
One Last Thing
If you’re still holding on to the idea that you can achieve serious results without deeply studying this craft — and without putting in real time — let me suggest something: drop that belief now, before you even begin.
You don’t have to. But eventually, after enough feedback from the market, you’ll let it go anyway. It’s just a matter of time. The sooner you accept this, the easier your path will become.
And if you can’t let go of that illusion — your only real option is to leave the market.
Social media exists to drive engagement. And where there’s engagement, there’s exaggeration. That’s what feeds the false ideas you might unknowingly absorb about trading and beyond.
People show the upside — but rarely the downside.
Trade talks improve and confidence returns🔔🔔🔔 Gold news:
➡️ Gold prices declined as improved risk sentiment weakened demand for safe-haven assets. Optimistic U.S. macroeconomic data released on Thursday supported the USD, limiting gains for the precious metal.
➡️ On Friday, the U.S. dollar showed signs of recovery as market sentiment remained upbeat due to positive developments in trade negotiations. According to Reuters, the Trump administration appeared to be making progress in preliminary trade talks with Asian allies South Korea and Japan.
Personal opinion:
➡️ The sellers are gaining the upper hand thanks to optimistic news, and the buyers are resting due to little news affecting the upward momentum of gold prices.
The analysis is based on resistance - support levels and Pivot points combined with EMA to come up with a suitable strategy.
Personal plan:
🔆Price Zone Setup:
👉Buy Gold 3281 - 3284
❌SL: 3277 | ✅TP: 3289 - 3294 – 3300
👉Sell Gold 3369 - 3372
❌SL: 3377 | ✅TP: 3365 - 3360 – 3355
FM wishes you a successful trading day 💰💰💰

XAUUSD Price Compression: Ready to Roar or Retreat?The 15-Min chart of XAUUSD is showcasing a classic symmetrical triangle pattern, characterized by converging trendlines—a series of lower highs forming the descending resistance (red zone) and higher lows creating the ascending support (green zone).
This price compression is typically seen before a major breakout, as the market consolidates and traders await a decisive move
Key Highlights:
🔻 Resistance Zone (Red):
Price repeatedly rejects the downward-sloping resistance line.
Each lower high is marked with red arrows, confirming seller dominance at those levels.
Also aligned near the 200 EMA (red line), which adds dynamic resistance.
🟢 Support Zone (Green):
Buyers have consistently stepped in at rising lows, forming a steady uptrend base.
This support is acting as a launchpad, compressing the price within the triangle.
Positioned near the 50 EMA (blue line), reinforcing this support region.
📈 EMAs (Trend Context):
50 EMA below 200 EMA indicates the broader trend remains bearish.
However, price consolidating near both EMAs suggests a potential trend shift if resistance breaks.
Breakout Scenarios to Watch:
✅ Bullish Breakout Potential:
A confirmed candle close above the resistance zone with volume may ignite a rally.
Immediate upside target levels: $3,360, $3,390, and potentially $3,420+.
Would indicate short-term trend reversal and fresh bullish momentum.
❌ Bearish Breakdown Risk:
A break below the ascending support line could trigger aggressive sell-offs.
Downside target levels: $3,290, $3,260, and deeper toward $3,210.
Would validate continuation of the prior downtrend.
📊 Trading Strategy Suggestions:
Breakout traders may wait for a confirmed candle close outside the triangle (with volume).
Range traders can look for bounce trades near support and rejections at resistance until breakout occurs.
Use tight stop-losses due to narrowing range and likely sharp post-breakout volatility.
Consider risk-reward ratio minimum 1:2 when targeting breakouts.
------------------------------------------------------------------------------------------
Disclosure:
I am a participant in TradeNation's Influencer Program and receive a monthly compensation for utilising their TradingView charts in my market analysis.
------------------------------------------------------------------------------------------

Let’s continue to be long on gold and keep winning!Fundamentals:
1. Focus on the performance of US economic data and the dynamics of the Federal Reserve;
Technical aspects:
At present, gold has failed to fall below the key area of 3300 many times during the retracement process, further strengthening the short-term structural support and strengthening the market's recognition of the effectiveness of its structural support. Moreover, gold may still maintain a volatile market before the NFP market. Due to the cautious attitude of the market, it is difficult for a unilateral trend to appear before the NFP market.
Short term trading strategies:
As in the two recently updated trading views, the trading strategy of long gold in the 3310-3300 area is still effective! Looking forward to gold rebounding to 3325 or even higher!

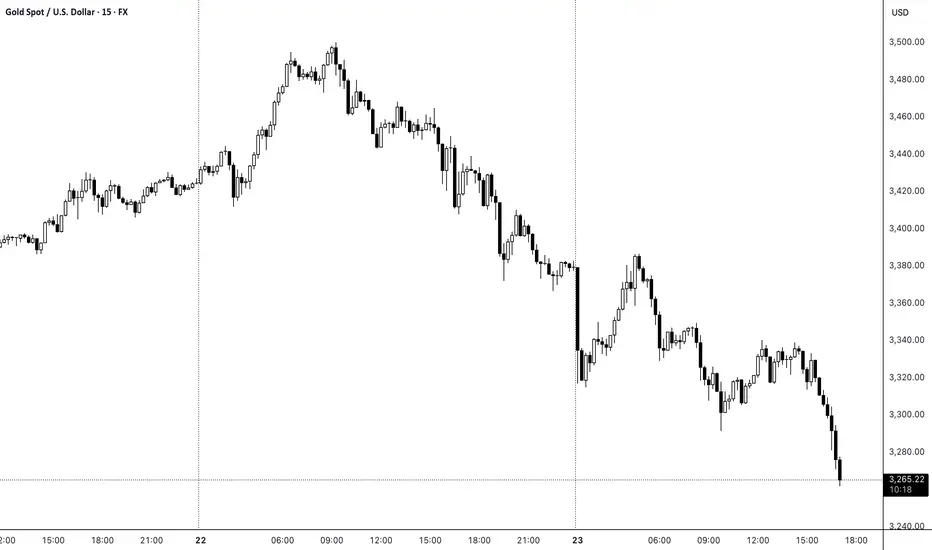
GOLD - completely unique region, holds or not??#GOLD. market perfectly hold our expected region on weekly basis that is around 3265-70
keep close that region again guys that is completely unique region.
holdings of that region means again bounce.
NOTE: below that region we will go for cut n reverse on confirmation.
good luck
trade wisely

Can gold continue its decline and hit a new low?US President Trump said he had no intention of firing Fed Chairman Powell. Affected by this, the US dollar soared in the short term and spot gold plummeted dramatically. This remark marks a huge change in Trump's attitude. He has recently stepped up his criticism of Powell and refused to rule out the possibility of taking the unprecedented step of firing Powell.
Gold technical analysis: This wave of gold correction is still continuing. The market has actually warned about today's pullback. After all, yesterday's closing line was a big negative line, so there must be a continuation in the trend of gold. Moreover, after gold rose to 3500 yesterday, the trend weakened. The market fell all the way and broke through the 3400 mark and 3300 mark, and fell to the lowest level of 3290! To be honest, this round of decline is still quite strong. After breaking the continuous positive, the market ushered in the suppression of the market pullback, and at present, there is still a trend of continuation!
In terms of short-term operation ideas for gold, it is recommended to sell short. The short-term focus on the upper side is 3320-3330 resistance, and the short-term focus on the lower side is 3285-3245 support.

check the trendThe price is expected to fluctuate above the current support area and then we will see the start of the upward trend.
If the price penetrates the support area, a downward trend is likely to form.
It seems that the recent long-term bullish wave in gold is coming to an end.

The upward trend is gradually emerging, and the evening layoutFrom a technical perspective, gold prices found solid support in the 3260-3270 range on many occasions during Monday's reversal and rise. Multiple bottom structures have been built in the short term, suggesting that gold's short-term adjustment may be nearing its end. Given that gold prices have already experienced a round of adjustments, the possibility of falling into adjustment again is relatively small. Therefore, as long as gold prices do not fall below the key support level of 3260 in the near future, its upward trend is expected to continue and open up further upside space. As far as the upper target level is concerned, 3337 and 3370 constitute two key dividing lines. If the gold price successfully breaks through 3337, it indicates that the market is in a volatile and strong pattern; if it further overcomes 3370, it will establish an absolutely strong position, and the upper space will be further expanded by then, and you can focus on the 3420-3500 area in the future.
Observing the trend of the daily chart, the gold price formed a triple bottom support near 3260, and the daily line closed with a positive line, indicating a significant bullish trend. As long as the subsequent daily line can continue to close positive, the price of gold will challenge the upper track or previous highs just around the corner. The 4-hour cycle chart shows that after Monday's rise, gold prices have shown a strong trend, but have not yet formed a unilateral rise pattern with the opening of the Bollinger Bands. The current market focus is on the gains and losses of the key point of 3370. If the gold price can successfully break through 3370 on Tuesday, it is expected to usher in an extremely strong unilateral upward trend; on the contrary, if it fails to effectively break through, the market may remain in a wide-range range-bound pattern. Based on the above analysis, intraday trading strategies should focus on callback long opportunities. The lower support level can be focused on the 3300-3310 area, and the upper pressure level should be focused on the 3350-3360 area.
Operation suggestions for golden days
Go long after stepping back on 3300-3310, TP3315-3320, hold if the position is broken
Go short when the top touches 3345-3340, stop loss at 3350, TP 3330-3320
If you agree with this point of view, or you have a better idea, please leave a message in the comment area. I look forward to hearing different voices.
FX:XAUUSD FOREXCOM:XAUUSD CAPITALCOM:GOLD OANDA:XAUUSD

GOLD: Long Trading Opportunity
GOLD
- Classic bullish formation
- Our team expects pullback
SUGGESTED TRADE:
Swing Trade
Long GOLD
Entry - 3271.6
Sl - 3260.0
Tp - 3293.6
Our Risk - 1%
Start protection of your profits from lower levels
Disclosure: I am part of Trade Nation's Influencer program and receive a monthly fee for using their TradingView charts in my analysis.
❤️ Please, support our work with like & comment! ❤️

GOLD trades around $3,300, market lacks major impactOANDA:XAUUSD sare trading lower around the $3,300/oz flatline as easing US-China trade tensions dampen the appeal of gold as a safe-haven asset, while investors await US economic data to gauge the Federal Reserve's policy direction.
OANDA:XAUUSD have been trading in a narrow range recently as the market awaits details of the first trade deal, which is expected to be announced this week or next.
OANDA:XAUUSD has reversed to a downside correction since last week as Trump made some very positive comments and the risk of stagflation was further ruled out, and gold prices continued to fall. Stagflation has pushed gold higher and as the market starts to price in this risk, a correction is natural, especially considering that “buying gold” has become the top trade and it is technically in overbought territory.
Looking at the larger picture, gold prices remain in an uptrend as real yields are likely to continue to fall amid the Fed’s easing. But in the short term, more positive news on tariffs could see gold prices continue to fall as the market adjusts to the new conditions.
OANDA:XAUUSD , traditionally seen as a hedge against political and financial uncertainty, hit a record high of $3,500.05 last week amid heightened uncertainty.
Investors will be watching economic data for the rest of the week, including Wednesday's personal consumption expenditure report and Friday's non-farm payrolls report.
Technical Outlook OANDA:XAUUSD
On the daily chart, gold continues to move sideways as the accumulation state takes place as the market has no fundamental impact of any sudden change. With the current position, gold is not qualified to increase or decrease significantly with the sideway area of attention in the range of 3,371 - 3,292 USD being the positions of the Fibonacci retracement of 0.236% and 0.382%.
However, overall, gold is still inclined to increase in the long term with the price channel as the main trend and support from EMA21 as the main support. As long as gold remains above/within the price channel, above EMA21, it still has the technical conditions for the main trend to be up, the declines should only be considered as short-term corrections and not an official trend.
During the day, the sideways accumulation state with the main uptrend will be noticed again by the following positions.
Support: 3,292 – 3,267 USD
Resistance: 3,371 USD
SELL XAUUSD PRICE 3382 - 3380⚡️
↠↠ Stop Loss 3386
→Take Profit 1 3374
↨
→Take Profit 2 3368
BUY XAUUSD PRICE 3283 - 3285⚡️
↠↠ Stop Loss 3279
→Take Profit 1 3291
↨
→Take Profit 2 3297

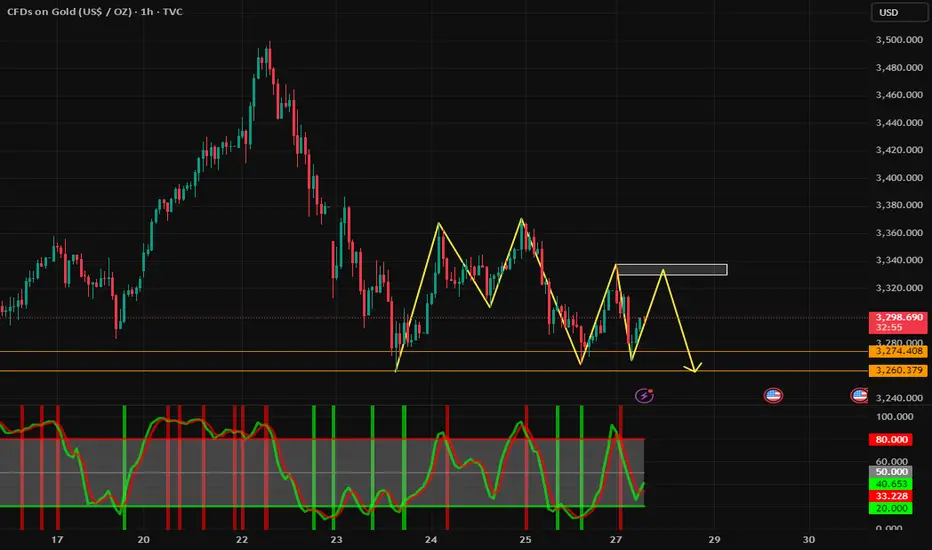
XAUUSD Play: Buy the Dip, Sell the Rip Gold (XAUUSD) Tactical Play: Intraday Long into 4H Premium, Then Position for Higher Timeframe Short
Higher Timeframe (4H + Daily Context) :
1. Daily Chart Bias :
Long-term bullish trend, but now expecting a mean reversion (correction) toward long-term averages (discount area).
2. Current Behaviour :
Price has aggressively rallied over the past weeks, but now it's likely moving into a larger correction phase.
3. 4H Structure :
- 4H Demand Zone (around 3,250–3,300) is still holding — price showed strong reactions after tapping it.
- 4H overall flow shifted bearish after a BOS, but internal structure inside 4H suggests a pullback toward premium levels.
Key Supply Zones Above:
• First Supply : 3,380.962 (4H + 15M alignment)
• Second Supply : 3,410.365 (strong 4H supply)
Internal Structure (15M) :
Current Observations:
1. 15M structure showed a CHoCH to the upside after tapping into the 4H demand — clear internal strength.
2. Entry zone marked in 15M purple zone (small demand refinement).
Expectation:
Price will retrace a little, tap the 15M purple zone, then push upward toward higher liquidity pools.
Targets for the Long Trade:
• First TP : The recent liquidity highs around 3,380.962 (first 4H supply).
• Second TP : 4H Fair Value Gap (FVG) closer to 3,410.365.
Thanks for your Time..


GOLD RISKY LONG|
✅GOLD has been making
A bearish correction after
Establishing a new all-time-high
So we are bullish biased on
Gold mid-term and we will be
Expecting a local bullish rebound
From the support around 3283$
LONG🚀
✅Like and subscribe to never miss a new idea!✅
Disclosure: I am part of Trade Nation's Influencer program and receive a monthly fee for using their TradingView charts in my analysis.

Gold still has a chance to reboundCurrently, gold's bulls and bears are still oscillating within a large range. The key pressure above and the upper edge of the range are maintained near 3365-70, while the lower edge of the large range and the support are maintained near 3260. It is very likely that there will be multiple shocks and choices within this range again.
Gold retreats to around 3302-00 during the day, go long, target around 3330-50, stop loss 3295.

XAU/USD 15M CHART PATTERNTechnical Analysis – Rising Wedge Bearish Pattern
The price action has recently formed a rising wedge, a classic bearish reversal pattern often observed after a sustained uptrend. This pattern is characterized by converging trendlines, where both the support and resistance lines slope upwards, but the support line rises at a steeper angle. It indicates weakening bullish momentum and growing selling pressure.
Breakdown Confirmation: The wedge has broken to the downside, confirming the bearish bias. The volume profile also supports the move, with a noticeable spike in selling volume during the breakdown — a key validation signal for the pattern.
Target Projection: Using the height of the wedge at its thickest point and projecting it downward from the breakdown zone, the calculated target price is 3234. This aligns with previous support zones, adding further technical significance to the target level.
Conclusion:
Pattern: Rising Wedge (Bearish)
Breakdown: Confirmed
Target: 3234
Bias: Bearish unless price reclaims the upper boundary of the wedge
Traders should monitor for potential retests of the breakdown level as resistance, which can provide a low-risk entry for short positions. Always consider volume confirmation and set stop-loss levels appropriately to manage risk.

Gold bullish sentiment coolsFrom the daily level, gold saw long profit taking at the 3500 mark, and the price retreated to 3260 at its lowest. Due to the increasing uncertainty of the market on tariffs, the market has seen a wide range of consolidation. From a technical perspective, the market will only strengthen again if it breaks through 3385 and stabilizes, and the adjustment space will be further expanded if it breaks below 3260!
From the 4-hour level, after the sharp drop of 3500-3260, the current market is under pressure and fluctuates below the middle track, with a range of 3370-3260 US dollars. At present, the Bollinger Bands continue to close, and the short-term market continues to maintain the range consolidation until the Bollinger Bands expand again and choose a new direction. Before the range is broken, you can sell high and buy low, and try to sell at high levels. If it breaks, choose to follow the trend.
Gold fell 70$ from its high in the Asian session. In terms of market sentiment, investors are emotionally complex, and some investors have profit-taking behavior, which led to a decline in the situation where gold opened high. From a short-term perspective, the strength of gold bulls is not very strong. Although gold opened higher on Monday for safe-haven trading over the weekend, it quickly fell back, indicating that gold bulls are not very confident at present. Gold short-term is still dominated by shorts.
The gold 1-hour moving average is still in a dead cross short arrangement, but if gold does not fall for a long time, then the gold 1-hour moving average may begin to turn upward, and the strength of gold shorts will decrease. Gold began to fall under pressure after 3336 in the Asian session, so gold will still be under pressure below 3336 during the day. If it breaks through 3336 strongly, then gold may start to rise in the short term, then we will adjust our thinking.
Key points:
First support: 3274, second support: 3260, third support: 3243
First resistance: 3325, second resistance: 3336, third resistance: 3358
Operation ideas:
Buy: 3260-3263, SL: 3252, TP: 3280-3290;
Sell: 3330-3333, SL: 3342, TP: 3310-3300;
XAU/USD For Bearishwait for pull-back and then go short
general trend is up trend
current phase is pull-back
Gold under pressure
have fun :)

XAUUSD H2 Idea, Aligned with weekly view XAUUSD& SILVER—Risk-On Mood Pressures Prices, Fed Easing Eyed
- Gold and silver prices experienced downward pressure during Friday’s Asian trading session, as a resurgence in risk appetite prompted investors to move away from safe-haven assets. Gold (XAU/USD) fell from an early high of $3,370 to $3,316, while silver (XAG/USD) dipped near $33.44, though it maintained support above $33.18.
- This shift in sentiment was influenced by positive developments in U.S.–China trade relations. Reports indicated that Beijing is considering suspending its 125% tariff on select U.S. goods, and President Trump confirmed ongoing negotiations, with the White House noting progress.
- Additionally, stronger-than-expected U.S. economic data contributed to the decline in precious metal prices. Durable goods orders surged 9.2% in March, surpassing expectations and bolstering the U.S. dollar, which in turn weighed on gold.
Despite these factors, the outlook for gold and silver remains influenced by expectations of Federal Reserve monetary policy. Investors are closely monitoring upcoming U.S. economic indicators, such as the Personal Consumption Expenditures (PCE) Price Index, for further clues on potential Fed easing.
