Volatile, Bearish Bias: Gold Trend Analysis & Trading TipsThe market is in a volatile trend with a bearish bias. Analysis of the gold market trend and trading suggestions
On Tuesday (April 29th), spot gold plummeted😲. Current price: 3306.49, down 1.14%. Opened at 3341.30, high of 3348.36, low of 3299.68
News in Brief
Trump's tough moves keep failing in the financial market😔. Bond market turmoil forced him to delay tariffs. Stock, bond & dollar slumps made him drop the Fed chair firing threat. His trade war "maximum pressure" strategy backfired against a major Asian nation💥. With losses piling up, he may cut tariffs. Legal battles at home are also mounting⚖️. Policy uncertainty could boost gold, but Fed rates or a soft landing might weigh on prices⏳.
Technical Analysis of Gold: After hitting 3500, gold declined😕. The current low is at 3260, which hasn't been broken in three daily trading days. With the pattern of alternating bull and bear candles, it's a clear wide-swing market😣. Don't chase trades as there's no continuity; it just moves back and forth.
On the daily chart, the trading range shifted from 3380-3260 last week to 3260-3330 but rebounded last night, returning to the wide range😲. The alternating bull-bear pattern makes the trend unsustainable these days. Today, the 5-day MA crossed below the 10-day MA, yet the opening price was above the 5-day MA, a divergence🤔. So, a downward correction was expected below 3332. Now there's a small bearish candle, and a small one with a long lower shadow may follow😏.
⚡️⚡️⚡️ XAUUSD ⚡️⚡️⚡️
🚀 Sell@3330 - 3320
🚀 TP 3300 - 3280
Accurate signals are updated every day 📈 If you encounter any problems during trading, these signals can serve as your reliable guide 🧭 Feel free to refer to them! I sincerely hope they'll be of great help to you 🌟
GOLD trade ideas

xau longnot many great trades past week, not trading large accs as 2 pending payout.
look at this, if 15m holds, will look to long it.
news looking good for xau today

4.28 Latest Gold Market Trend Analysis:
Core Viewpoint:
The gold market has entered a key long-short contention area after a sharp correction. The short-term trend will depend on the breakthrough direction of the 3260-3370 range. Investors are advised to adopt a range trading strategy and focus on the breakthrough of key support and resistance levels.
1. Key fundamental factors
Negative factors:
The US dollar continues to strengthen (the US dollar index rose 0.3%)
The easing of Sino-US trade tensions (China exempted some US goods from tariffs)
Weakened safe-haven demand (global geopolitical risks cooled down)
Potential bullish factors:
Uncertainty about the global economic outlook remains
If the US dollar corrects, it may boost gold prices
Technical buying at key support levels
2. Technical analysis
Daily level:
Key resistance: 3368-3370 (23.6% Fibonacci level)
Key support: 32 60-3280
Trend pattern: consolidation phase after high-level correction
MACD indicator: fast and slow lines cross, indicating short-term bearish
4-hour level:
Moving average system: MA5 (3315) and MA20 (3338) form suppression
Bollinger Band: Price runs below the middle track, and the lower track is supported at 3260
RSI indicator: close to the oversold area, need to be vigilant about technical rebound
3. Key price range
Upper resistance:
Short-term: 3315-3338
Strong resistance: 3343-3353
Key resistance: 3368-3370
Support below:
Short term: 3290-3300
Key support: 3260-3280
Strong support: 3200-3220
IV. Trading strategy suggestions
Interval trading strategy:
Buy low and sell high in the 3280-3330 range
If it breaks above 3330, you can go long with a light position, with a target of 3350-3370
If it breaks below 3280, you can consider going short, with a target of 3260-3220
Breakthrough trading strategy:
If it breaks through 3370, it may start a new round of rise
If it falls below 3260, it may accelerate the decline Go to 3200
Risk control:
Strictly set stop loss (50-80PIPS recommended)
Position control within 5%
Pay attention to the volatility opportunities before and after the opening of the US market every day
V. Focus on events
Economic data:
US GDP data
Federal Reserve interest rate decision
Non-agricultural employment data
Political events:
Progress of China-US trade negotiations
Geopolitical situation in Eastern Europe
News related to the US election
VI. Summary and suggestions
The gold market is currently at a critical turning point, and the large range of 3260-3370 will determine the future medium-term trend. Suggested investors:
Short-term traders: focus on trading opportunities in the 3280-3330 range
Medium-term investors: wait for the breakthrough confirmation of 3260 or 3370 before making a layout
Strict risk management: control positions and set stop losses

My Gold Outlook for Monday:Looking at the current structure, I’m leaning bearish for Monday. Price has pushed up into a key resistance zone, and we're now trading inside a clear descending channel.
I’ll be watching for selling opportunities around the upper boundary of the channel — ideally after a rejection or a clear lower high formation. My first target would be around the mid-support zone, and if momentum is strong, a further drop into the larger Demand Zone below seems very possible.
As always, patience is key: I’ll wait for confirmation before entering any sell setups.
Just to be clear — I'm a regular guy who’s still learning and progressing in my trading journey. This is not financial advice, just me sharing my current view based on what I’m seeing on the charts. Always do your own analysis and manage your risk carefully!
Stay sharp and stay patient!

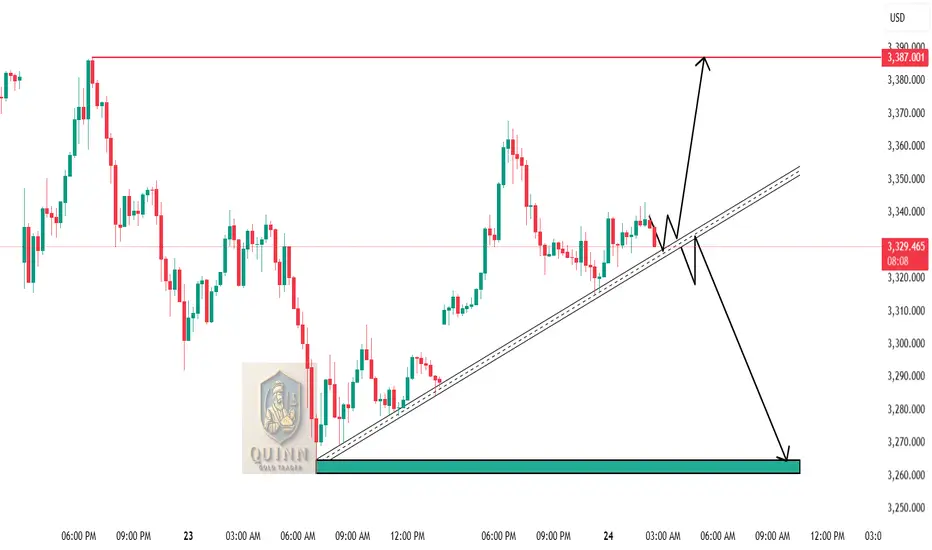
GOLD TO 3,260 SELL NOW!!!!!!!Gold made a strong rejections off the two important zone and once that happens new lows is expected from the point of decisions gold made a rejections off the fvg and also on the previous lower high am in now on sell holding till new low is created from this point
3,260 is my goal target

XAUUSD BUY PROJECTION Hey guys we still haven’t executed any trade all through the week but I’m starting to like what gold is doing we might get a nice entry and I’m still interested on that 3,350 zone tho price broke below if you check my last I was very interested to take buys from that zone and now market closed with a strong bullish candle so if we can get a nice breakout when the market opens I will be waiting for a retest of 3,350 or place an entry there for buys to the upside…I will update you guys if am on the trade….

Gold prediction 24.04.2025🟢 Gold Price Action Analysis (XAU/USD)
Date: April 24, 2025
Time Frame: Short-Term Intraday
Market Context:
Gold is currently respecting a key trendline support zone between 3326 and 3332. This area has acted as a strong demand zone recently and price is showing signs of bullish interest around this level.
Bullish Scenario (Primary Bias):
If the trendline holds around 3326–3332, we anticipate a bullish move targeting the previous swing high at 3388.
Confirmation would be bullish candlestick formation or volume buildup near the trendline zone.
📈 Buy Signal:
Buy between 3326–3332 (only on confirmation as cired above)
🎯 Target: 3388
🛑 Stop Loss: Below 3320 (trendline invalidation)
Bearish Scenario (Alternative Plan):
If price breaks below the trendline and retests the 3326–3332 zone as resistance (confirmation on m1 or m5, we’ll look to short.
This would indicate a trendline breakdown and potential bearish momentum towards the previous low.
📉 Sell Signal (on Break and Retest):
Sell near 3326–3332 (after breakdown and bearish retest)
🎯 Target: 3261
🛑 Stop Loss: Above 3335
Please show support by following me and comment you favourite pair, if needed to be analyzed.
Buy possibility On the H4 theres a symmetrical wedge and within that wedge there is a descending wedge, and with Fed rate cuts possibly coming in we could see gold get some gains back, we cant predict where the market will go but we can adapt to the different probabilities and execute based on the opportunities the market gives us.

XAUUSD TRIANGLE PATTERN IN 15-MI Created This XAUUSD Chart Analysis In 15M Tf
Entry Point : SELL XAUUSD MADE TRIANGLE PATTERN
Resistance zone : 3315
Target Will Be : 3288
NOTE : THIS CHART IS BASED ON PERSONAL ANALYSIS FOR LEARNING PURPOSES. PLEASE USE PROPER RISK MANAGEMENT

XAUUSD H4 | Bullish Bounce OffBased on the H4 chart analysis, the price is falling toward our buy entry level at 3245.68, a pullback support.
Our take profit is set at 3314, an overlap resistance
The stop loss is placed at 3212.68, a swing low support.
High Risk Investment Warning
Trading Forex/CFDs on margin carries a high level of risk and may not be suitable for all investors. Leverage can work against you.
Stratos Markets Limited (tradu.com):
CFDs are complex instruments and come with a high risk of losing money rapidly due to leverage. 63% of retail investor accounts lose money when trading CFDs with this provider. You should consider whether you understand how CFDs work and whether you can afford to take the high risk of losing your money.
Stratos Europe Ltd (tradu.com):
CFDs are complex instruments and come with a high risk of losing money rapidly due to leverage. 63% of retail investor accounts lose money when trading CFDs with this provider. You should consider whether you understand how CFDs work and whether you can afford to take the high risk of losing your money.
Stratos Global LLC (tradu.com):
Losses can exceed deposits.
Please be advised that the information presented on TradingView is provided to Tradu (‘Company’, ‘we’) by a third-party provider (‘TFA Global Pte Ltd’). Please be reminded that you are solely responsible for the trading decisions on your account. There is a very high degree of risk involved in trading. Any information and/or content is intended entirely for research, educational and informational purposes only and does not constitute investment or consultation advice or investment strategy. The information is not tailored to the investment needs of any specific person and therefore does not involve a consideration of any of the investment objectives, financial situation or needs of any viewer that may receive it. Kindly also note that past performance is not a reliable indicator of future results. Actual results may differ materially from those anticipated in forward-looking or past performance statements. We assume no liability as to the accuracy or completeness of any of the information and/or content provided herein and the Company cannot be held responsible for any omission, mistake nor for any loss or damage including without limitation to any loss of profit which may arise from reliance on any information supplied by TFA Global Pte Ltd.
The speaker(s) is neither an employee, agent nor representative of Tradu and is therefore acting independently. The opinions given are their own, constitute general market commentary, and do not constitute the opinion or advice of Tradu or any form of personal or investment advice. Tradu neither endorses nor guarantees offerings of third-party speakers, nor is Tradu responsible for the content, veracity or opinions of third-party speakers, presenters or participants.

how i see the market for tomorrow. Key areas which i see as points of interests. give us an insight into buying and selling options. all the best.

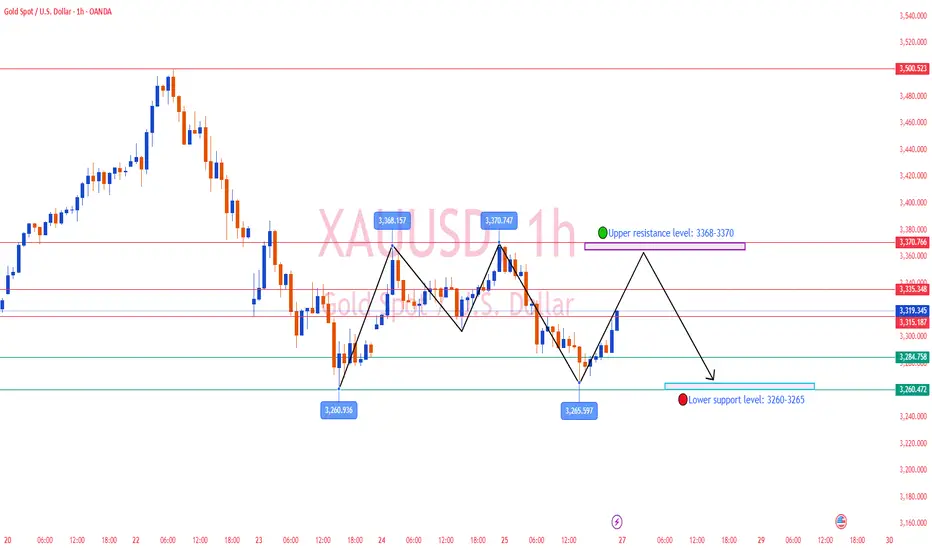
Gold trading strategy for next Monday📊Judging from the trend of the daily chart, the overall gold price has been in a high-level consolidation trend recently. After falling from the high point near 3500, there has been a significant adjustment. At present, although the gold price has rebounded after the correction to the low point of the week, the rebound momentum is limited by the 23.6% Fibonacci retracement level (about 3368-3370 area), which has been transformed into an important short-term resistance level.
📊On Friday, the gold market continued the rhythm of Thursday, and quickly rose to around 3370 in the early trading, but encountered resistance and fell back here, and then started a new round of downward trend, and fell below the low point of the previous day's European and American trading. It rebounded after the lowest point fell to around 3265. It is worth noting that the gold price not only failed to break through the key resistance above, but also further refreshed the short-term low, indicating that the market bearish sentiment is still dominant.
📊From the current market structure, the 3260-3265 area has become a key support level, and it is necessary to pay close attention to whether the subsequent trend can effectively break through it. Once it falls below $3260, the bearish trend will be further confirmed, and the gold price may usher in a deeper correction. Based on the current K-line morphological observation, a "two negatives and one positive" structure has been formed, which technically implies that there is still a risk of continued adjustment in the short term. However, the adjustment method may not be a unilateral decline, and there is also the possibility of correction in the form of sideways fluctuations (i.e. repeated fluctuations in the 3260-3370 range).
🟢Upper resistance level: 3368-3370
🔴Lower support level: 3260-3265
✅Intraday trading strategy
🔰Gold Sell: 3368-3370, Stop Loss: 5-8$
Target: 3300-3285, if it breaks, look to 3260
🔰Gold Buy: 3265-3270, Stop Loss: 5-8$
Target: 3290-3330, if it breaks, look to 3370
✅Trading strategies are time-sensitive. We will provide members with real-time and accurate trading strategies based on market changes. Short-term trading requires flexibility, timely adjustment of positions, strict risk control, and ensuring that you are not affected by large fluctuations.
The gold weekly line is about to close and the short position coThe downward trend remains unchanged!
At the same time, after the current decline in gold, traders who have positions above should pay attention that the early morning rebound cannot exceed the stage pressure of 3292-3300. The larger the rebound, the weaker the downward momentum. After a continuous decline, the 3260 position can be seen below. After breaking, the 3230 point needs to be paid special attention to below. This is the golden section position of 50% retracement since the rise from 2956 to 3500 in this round. It is also a multiple resonance area in the trading concentration area. After reaching this point, traders who hold short positions should consider being more cautious.

GOLD sell stup H1Hello! Friends,
Greetings. Please leave a Like if you like the idea.
Before start talking about technical Let's share your LOVE by giving me LIKES to support this work. Thanks in advance.

XAUUSD - Will Gold Reverse?!Gold is trading between the EMA200 and EMA50 on the 15-minute timeframe and is on its uptrend line. A continued bullish move towards the supply zone will provide us with the next opportunity to sell it with a good risk-reward ratio. We expect a range of $10-$15.
Gold prices dropped by 4% on Wednesday, just a day after reaching an all-time high. The decline followed remarks by President Trump that helped ease Wall Street’s concerns about the ongoing trade war with China and tensions between the White House and the Federal Reserve.
Throughout this year, gold has seen a substantial rise due to investor fears over the economic consequences of tariffs. Additionally, the metal has benefited from capital fleeing U.S. assets amid political uncertainty under the Trump administration. On Tuesday, Trump reassured markets by stating that he had no intention of removing Jerome Powell as Fed Chair and expressed his expectation that tariffs on Chinese goods would soon be lowered.
Trump’s statements supporting Federal Reserve independence and hinting at easing trade tensions with China reignited risk appetite in financial markets, causing gold prices to tumble on Wednesday.Just a day earlier, prices had hit a record high above $3,500, as investors speculated that Trump might attempt to remove Powell. Trump had previously criticized Powell for not cutting interest rates and for warning that tariffs could lead to higher consumer prices.
Gold’s price surge this year has been especially notable following Trump’s decision to halt the implementation of sweeping new tariffs initially announced in early April. Gold, as a safe-haven asset not tied to any single national economy—unlike traditional alternatives such as the U.S. dollar or Treasuries, which are subject to U.S. government influence—has become increasingly attractive to investors wary of Trump’s policy decisions.
Meanwhile, the International Monetary Fund (IMF) has warned that continued tariff escalation in 2025 could push global public debt to 95.1% of GDP—an increase of 2.8 percentage points from previous forecasts. According to the IMF’s latest “Fiscal Monitor” report, if revenues and output fall significantly below expectations due to tariff-induced pressures, global debt could surpass 117% of GDP by 2027.
Investment bank JPMorgan has projected that gold prices could exceed $4,000 per ounce by mid-2026. This forecast is based on expectations of an economic recession, a prolonged trade war, and sustained demand from central banks. However, JPMorgan also cautioned that a sudden drop in central bank demand could threaten this bullish trend.
The IMF’s report further estimates that global public debt will climb to 99.6% of GDP by 2030, exceeding even the pandemic-era peak.
The IMF has forecasted global economic growth at around 2.8% for 2025. In this scenario, the U.S. budget deficit is projected to decrease from 7.3% of GDP in 2024 to 6.5% in 2025, and further down to 5.5% in 2026, largely due to increased tariff revenues and continued economic expansion.
These IMF projections for the U.S. deficit are based on policies announced up until April 2, 2025, and assume that the individual tax cuts enacted in 2017 will expire at the end of this year.

XAUUSD 30M CHART PATTERNThis chart appears to show a potential bullish reversal pattern in the gold market (CFDs on Gold, 30-minute timeframe). Here's a quick breakdown:
Descending Channel: The green trendlines outline a downward channel, indicating a previous bearish trend.
Bullish Breakout: The price action seems to be breaking out of the descending channel, possibly forming a reversal.
Entry Zone: The green arrow and horizontal support suggest an expected bounce or entry zone.
Stop Loss: Placed just below the support level to manage risk.
Take Profit Zones: Two targets are marked — a conservative target around the mid-channel level and a more aggressive target near previous highs.
This setup anticipates a pullback to support before a strong upward move. Do you want help analyzing the validity of this setup or discussing potential trading strategies around it?

The gold shorts aren’t over yet
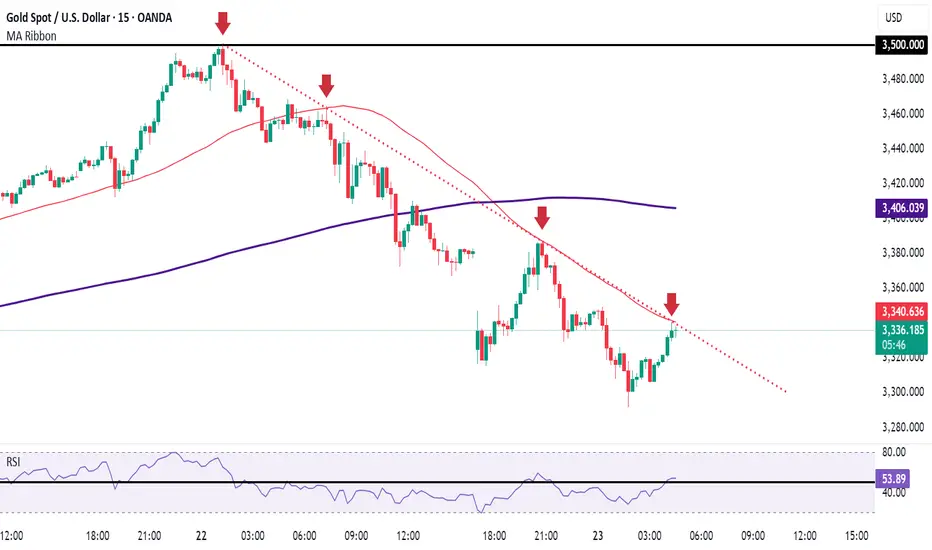
The 1-hour moving average of gold continues to turn downward. If the 1-hour moving average of gold forms a death cross downward, then there is still room for gold to go down in the 1-hour period. Gold has been under pressure from the 3340 resistance line for many times in the US market and has fallen. Gold has hit a new low again in the US market, falling to the 3260 line. The lows of gold continue to hit new lows, so the gold short position has not ended yet. The resistance of the 1-hour moving average of gold has moved down to around 3366. Gold continues to be shorted at highs below 3366.

Gold Trading DirectionGold fell back under the pressure of 3386, and then pulled back to the pressure of 3365. The watershed was the morning high of 3386. Focus on the break of the low of 3313. If it breaks, the support of 3283 can be long. The strong support is 3245. If the European session does not break the low, but continues to fluctuate sideways at a low level, then be careful of the rebound at night.

XAUUSD Today's strategyThere has been a remarkable negative correlation between DXY and gold prices for a long time. Although this internal logic is short-term disturbed by multiple complex factors, the core correlation has always dominated the market rhythm. Recently, the joint remarks by the U.S. Treasury Secretary and Trump on easing tariff issues may boost the U.S. dollar emotionally in the short term, thereby suppressing the bullish momentum of gold. However, this impact needs to be examined within the macro framework.
Currently, the high uncertainty of the global economy, the intermittent escalation of geopolitical risks, and the reconstruction of inflation expectations in some economies jointly form a long-term supporting logic for the safe-haven attribute of gold. From a trading perspective, the above-mentioned short-term disturbances instead provide a window for strategic allocation —
Long-term investors who have not yet positioned or exited midway can take the opportunity of market sentiment fluctuations to build positions in batches, with key attention paid to the test opportunities of the critical support range of $3,250-$3,280。
Short-term traders need to strengthen discipline and strictly follow the established stop-loss and take-profit rules. Given the amplified volatility and enhanced randomness of the current market, it is recommended to appropriately shorten the operation cycle and closely track the intraday dynamics to adjust strategies.
Overall, the marginal changes in tariff policy expectations only constitute small-level fluctuations in the trend process, and the medium-to-long-term upward logic of gold remains undamaged. Investors can grasp structural opportunities under the premise of controlling positions according to their own risk preferences.
XAUUSD
buy@3250-3280
tp:3300-3340
I hope this strategy will be helpful to you.
When you find yourself in a difficult situation and at a loss in trading, don't face it alone. Please get in touch with me. I'm always ready to fight side by side with you, avoid risks, and embark on a new journey towards stable profits.

Gold Short Term UpdateGold on M15 formed a valid descending trendline with 4 touches rejected
so now we're waiting for a M15 candle to broke and close above the touch of the trendline to activate the long (buy) trade
Trade safe and don't forget to trade with risk management
Follow us for more updates and ideas
Gold price up or down?Gold has been fluctuating at the bottom in recent days. The large range is obviously 3260-3370, and the small range changes every day. On Tuesday, it was 3352-3300. The overall trend was first falling and then rising, but the decline was stronger than the rise. For the time being, gold is still weak. On the upside, pay attention to the break of 3370. If 3370 breaks, look at 3420-3500. The operation idea remains unchanged. Today, we still look for low points to go long. The support below the small cycle is around 3300-3280. These two supports are necessary points for going long today.

GoldXAUUSD
- Completed " 12345 " Impulsive Waves and " AB " Corrective Waves
- Break of Structure
- RSI - Divergence
- Consolidation Phase
- Bearish Channel as an corrective pattern in Short Time Frame

GOLD BUY NOW TO 3,352Gold just took out the buyside liquidity price is expected to make a new highs 3,352 is my target this is called a falling wedge breakouts
JOIN AND ENJOY......
