Gold BuysGold is still very much in an uptrend and probably going to make a new ATH after NFP this week.
join me on this buy signal for a 1:4 risk-reward.
I will be dropping relevant updates while trade is active.
GOLD trade ideas

DXY, BTCUSD, USDJPY, XAGUSD & XAUUSD Daily Trade SetupsIn this update we review the recent price action in the Dollar, Bitcoin, Yen, Silver & Gold and identify the next high probability trading setups and price targets. To review today's video analysis click here!

Gold is sideways seeking Trend Confirmation from GDP Data Gold is playing as per the seasonals chart and is seeking validation from GDP Data Tomorrow.
Funds are pulling out from gold but still 76% of funds are in long.

Risk aversion eases, gold continues to fluctuateSpot gold prices (XAU/USD) fluctuated and fell, approaching the $3,300 mark, continuing the weak trend of the previous trading day.
From the daily chart, gold prices have fallen from their historical highs and are currently approaching the 38.2% Fibonacci retracement level (US$3,300-3,290). The key support level below is concentrated in the $3,265-3,260 range, which is also the previous consolidation range. If it falls below, it will open up the space for a 50% retracement level (US$3,225) or even $3,200.
In terms of technical indicators, the MACD indicator shows signs of a dead cross, and the green kinetic energy column expands moderately, indicating that short-term bears still have the initiative; the RSI indicator is still oscillating near the 50 axis, and has not yet shown extreme oversold, indicating that the downside space may be limited. Once the price rebounds, the initial resistance above is seen at $3,348-3,353.
After the breakthrough, it is expected to re-challenge the $3,400 mark, and even attack $3,425-3,427.
If the US PCE inflation and non-farm data weaken this week, it will further support the re-entry of gold bulls.

GOLD in rectangle patternwe might see more rejection from gold, to reach about the previous resistance at $3150

Gold short-term bullish trend remains unchanged
I don't want to say more nonsense, just give the signal directly, after all, everyone only looks at the results, don't you think so, dear trader?
Gold
Buy around 3298, stop loss 3278, target 3310-3318
Hello traders, if you have better ideas and suggestions, welcome to leave a message below, I will be very happy

XAUUSD/GOLD: Gold remains offered below 3300Gold gave up Thursday’s gains and fell back toward the 3260 per troy ounce level by the end of the week, as improving market sentiment — driven by hopes for positive progress in the US-China trade dispute — weighed on safe-haven demand.
The overheated gold rally appears to be due for further cooling. Traders seem to be buying into rumors that a trade agreement between the US and China could be reached soon, even though China has publicly refuted those claims. The risk is that markets may be misreading the US’s language regarding whether the two sides are merely "talking" or actually "negotiating," which could mean that a deal remains far off — potentially leading to another move back toward 3500.
From a technical perspective, the daily Pivot Point at 3335 is the first key upside level that needs to be regained. Early in Friday’s session, there was a brief attempt to test the R1 intraday resistance near 3381. Should momentum continue, gold prices could extend the rally toward the R2 resistance at 3414, breaking above the 3400 mark.
On the downside, the S1 support was briefly breached this morning, but price action has since recovered back above it at 3302. Below that, the S2 support at 3256 comes into focus, followed by the key technical floor near 3245, which aligns with the April 11 high.

Gold Intraday Trading Plan 4/28/2025As explained in my weekly forecast, I do expect gold to drop at the initial stage of the week. I will look for selling opportunity at 3335-3345 level. first target 3372, 2nd target 3228.
However, if 3345 is broken, the setup is invalidated.

XAUUSD 28th Apr to 2nd MayGold end last week with good recovery during wave B confirmation, giving us an indication Wave B will be targeting 3408$, and Wave C between 4245-3225
However, brake above 3448 will open the doors for new 5 waves upwards and will invalidate the bearish

“Gold Analysis: Breakout Achieved, What’s Next?”“Last week’s analysis played out perfectly with gold filling the gap and closing strongly at 3319$.
Looking ahead, holding above 3280$ could lead to further upside targets at 3369$ and 3408$.
However, a break below 3260$ may trigger a deeper correction toward 3245$.
Stay tuned for live updates and future setups.
Your support and feedback are highly appreciated!”

Will a false breakdown in support lead to growth?The current trading range is 3275-3290. Since the opening, the price has been fluctuating in a small range. There was no news on Friday, so the price may regain its upward momentum after retesting the liquidity and support area of 3270-3285.
Gold prices are currently stable around $3280, but the US dollar has curbed the rise of gold prices.
Gold prices have held their ground after recovering, but the strengthening of the US dollar and hopes for progress in tariff war negotiations have limited further gains in gold prices…
Optimism about US corporate earnings and fears of a recession are easing, supporting demand for the US dollar. However, the continued uncertainty in Sino-US relations has kept interest in gold strong.
The market is waiting for new signals from the White House and the Federal Reserve, which will determine the further trend of gold prices.
Focus on the support trading range. A false break of 3270 could change the balance of power, leading to a rebound or growth.
No news today, except for the unpredictable situation of Trump and the tariff war in general. Any speech or tweet could shake the market.
However, gold prices remain range-bound after a lackluster week.
Quaid recommended:
The market fluctuates sideways today. You can try short-term trading. Look at 10 points for each upward callback and perform scalping transactions in this range.

4.25 gold short-term operation technical analysis!Spot gold suddenly fell sharply during the Asian session on Friday (April 25). At the end of the session, the current gold price was around $3,307/ounce, a plunge of more than $40 during the day.
Gold prices turned lower on Friday as hopes of a trade deal between China and the United States weakened safe-haven assets. The positive risk tone weakened the demand for safe-haven assets. In addition, optimistic US macroeconomic data on Thursday supported the dollar, which also hit gold prices.
Cleveland Fed President Hammack made it clear in an interview on Thursday that the Federal Reserve has basically ruled out the possibility of a rate cut in May. But she also released key information that if there is clear evidence of the direction of the economy, there is room for policy action in June.
Gold prices are currently supported near the $3,300/ounce mark, which is also the 38.2% Fibonacci retracement level of gold prices from this month's low (around $2,950/ounce) The latest round of gains is located.
If gold price falls below the $3300/oz mark, the next support for gold price is the weekly low near the $3260/oz area; if it falls below the above area, gold price may accelerate its decline and fall to the 50% retracement level (i.e. the area near $3225/oz) and finally fall to the $3200/oz mark. Some follow-up selling will indicate that gold has peaked and turn the short-term bias in favor of bearish traders.
Gold price resistance is around the $3368-3370/oz area, which should be a key level now. If it breaks through the above area, gold price may return to the $3400/oz mark. The subsequent rise may push gold price further to the $3425-3427/oz barrier. Once this barrier is overcome, bulls may retry to conquer the psychological $3500/oz mark.

GOLD SENDS CLEAR BULLISH SIGNALS|LONG
GOLD SIGNAL
Trade Direction: long
Entry Level: 3,299.27
Target Level: 3,358.08
Stop Loss: 3,259.94
RISK PROFILE
Risk level: medium
Suggested risk: 1%
Timeframe: 1h
Disclosure: I am part of Trade Nation's Influencer program and receive a monthly fee for using their TradingView charts in my analysis.
✅LIKE AND COMMENT MY IDEAS✅

XAUUSD 1h ForecatHello guys I hope you are well let me tell you that we can buy from here now because we have crossed the bullish order block, so our target will remain at the resistance area.

Early Asian session. Latest market analysisIn early Asian session, spot gold rebounded slightly and is currently trading around $3,345/oz, supported by bargain hunting. The U.S. session continued its trend of retreating from record highs, falling nearly 3%, hitting a low of $3,260.08/oz and closing at $3,288.18/oz.
People familiar with the matter revealed that the Trump administration is considering reducing tariffs on imports from Asian powers, adding that any action would not be unilateral.
Quaid Analysis:
People are very relieved about the possibility of negotiations between major powers, and we are seeing this trend have a significant impact on the market.
Driven by central bank buying, tariff war concerns and strong investment demand, gold prices have risen by more than 26% since the beginning of 2025. A large number of long orders are facing profit-taking needs, and investors need to beware of the risk of further correction in gold prices.
From a technical perspective, gold prices hit $3,500, soared before this level, and then reversed sharply, which increases the risk of further correction in the short term.
The preliminary monthly rate of durable goods orders in the United States in March and the number of initial jobless claims in the United States for the week ending April 19 will be released on the Asian trading day. Investors need to pay attention to them. In addition, they need to continue to pay attention to the relevant news on the international trade situation and the geopolitical situation.
Action suggestions:
Go long at 3345, stop loss at 3340, watch 33380
If Quaid's analysis can help traders, then Quaid will be very happy.

Gold pullback 3400 Gold can pullback 3408 . And then down to 3200. Sell limit 3400 & 3408 sl 3415 TP 3233 3200

Gold Eiffel Tower The GOLD GTFO is still in play.
What saved Gold was the stopping for the market crash when Trumnpchenko manipulated the markets. Had the crash continued Gold would have crashed with it. As it is the last safe haven for money to pile into and people just give up and sell everything in sight.
If you were an early buyer of gold and sold above $3,000 then you have a nice 50% gain.
Take your money and RUN! All the way to the bank! Don't be a dick for a tick. If you are then you will ride it all the way back down.
When will it top no one can know. But what pros do is take their money and RUN! So be a pro! ;)
Click like follow subscribe!

XAUUSD: 23/4 Today's Market Analysis and StrategyGold technical analysis
The resistance level of the four-hour chart is 3400, and the support level is 3285
The resistance level of the one-hour chart is 3371, and the support level is 3300
The resistance level of the 30-minute chart is 3350, and the support level is 3300.
The current gold price is short-term bearish.
The Asian session continued to break through 3300, falling to 3291.8, and then rebounded quickly. If the price falls below the 3300 integer mark again, it may further fall to 3285. After breaking the support of 3285, it will continue to test 3245.
If the price rebounds and breaks through the previous high resistance level of 3350 US dollars, the short-term trend may turn bullish.
Sell: 3350near SL:3355
Sell: 3285near SL:3290
Buy: 3300near SL:3295

GOLD BUY WITH LIMIT ORDER!!!!!!!XAUUSD formed a falling wedge pattern on the 30min time frame am looking forward to see price take out the buyside liquidity with retest from any zone looking at limit order 3,316 for strong buys...

GoldXAUUSD
- Completed " 12345 " Impulsive Waves and " AB " Corrective Waves
- Break of Structure
- RSI - Divergence
- Consolidation Phase
- Bearish Channel as an corrective pattern in Short Time Frame

Buy!Hello all. as I see here, market returned from an LOZ and it needs a Node to go Higher. I think it is a good Option to go buy.

Gold prices are expected to break upwardGold prices are expected to break upward
As shown in Figure 4h:
The rising channel, sideways channel and falling channel of gold prices form a triangular oscillation pattern
At present, the average price of triangular oscillation converges around 3320
I think the gold price is likely to break upward and return to the high of 3400+ again, and form an M top with the previous high near 3500, forming a double top structure.
Focus on the suppression near 3330-3340.
Once an effective breakthrough is formed, continue to follow up and do more.
In fact, we have arranged to do more in the 3310-3320 range and have been holding it, with a stop loss set at 3288-3295.
Today is April 30th, and the Asian market is about to enter the closed stage.
We need to pay attention to the chain changes brought by the Asian market.
Due to the May Day holiday, the Asian market is closed for 4 days, and the Asian market is currently the main purchasing power of gold prices. Will there be a superposition of risk aversion, or a direct squeeze?
This will inevitably bring some uncertainty.
Today's strategy:
Buy around 3300-3310
Stop loss: 3288-3295
Target: 3340-3360-3400
Hold firmly

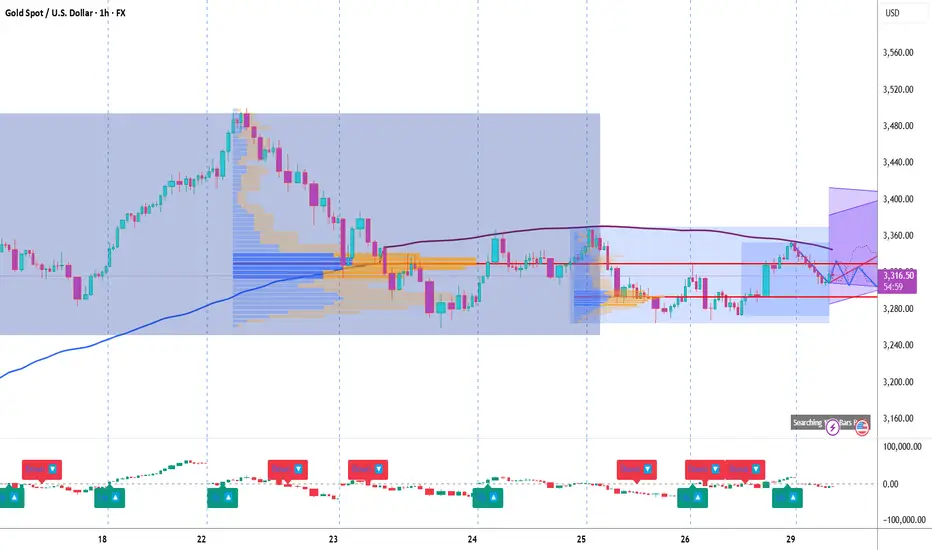
Technical Breakdown on Gold Spot / USD (XAU/USD) | 1H TimeframeHere’s the detailed breakdown of the Gold Spot / USD (XAU/USD) 1H Chart based on Volume Profile, Gann analysis, and custom indicators (CVD + ADX):
1. Key Observations (Volume, Gann & CVD + ADX Focused)
a) Volume Profile Insights:
• Value Area High (VAH): 3,343.00
• Value Area Low (VAL): 3,278.50
• Point of Control (POC):
o Current session: 3,293.34
o Previous session: 3,329.53
• High-volume nodes:
o Around 3,293-3,300 (recent acceptance area)
• Low-volume gaps:
o Between 3,315 - 3,330 (thin volume, price may move quickly through)
b) Liquidity Zones:
• Stops likely above recent swing high: 3,343 (VAH area).
• Stops likely below recent swing low: 3,278 (VAL area).
• Absorption (high delta volume) noted near 3,290-3,300 (potential strong demand zone).
c) Volume-Based Swing Highs/Lows:
• Swing high at 3,343 with notable rejection and high-volume rejection candle.
• Swing low at 3,278.5 where volume spiked and buying pressure emerged.
d) CVD + ADX Indicator Analysis:
• Trend Direction: Currently slight bullish bias (CVD showing positive divergence).
• ADX Strength:
o ADX < 20 (currently weak trend, range-bound behavior likely).
• CVD Confirmation:
o Recent rising CVD with bullish price action = demand emerging.
________________________________________
2. Support & Resistance Levels
a) Volume-Based Levels:
• Support:
o VAL: 3,278.50
o POC: 3,293.34
• Resistance:
o VAH: 3,343.00
o Previous swing high: 3,343
b) Gann-Based Levels:
• Confirmed Gann swing low: 3,278
• Confirmed Gann swing high: 3,343
• Key retracement levels:
o 1/2 Retracement: ~3,310.5
o 1/3 Retracement: ~3,300
o 2/3 Retracement: ~3,320
________________________________________
3. Chart Patterns & Market Structure
a) Trend:
• Range-bound to slight bullish bias (based on ADX low + CVD rising).
b) Notable Patterns:
• Potential ascending channel forming (highlighted in purple).
• Breakout attempt from range, but not confirmed with strong volume yet.
• Minor flag pattern in consolidation near 3,293-3,300.
________________________________________
4. Trade Setup & Risk Management
a) Bullish Entry (If CVD + ADX confirm uptrend):
• Entry Zone: 3,293.50 – 3,295.00
• Targets:
o T1: 3,320
o T2: 3,343
• Stop-Loss (SL): 3,278
• RR: Minimum 1:2
b) Bearish Entry (If CVD + ADX confirm downtrend):
• Entry Zone: 3,343 (retest of VAH)
• Target:
o T1: 3,300
• Stop-Loss (SL): 3,355 (above prior swing high)
• RR: Minimum 1:2
c) Position Sizing:
• Risk 1-2% of capital per trade only.