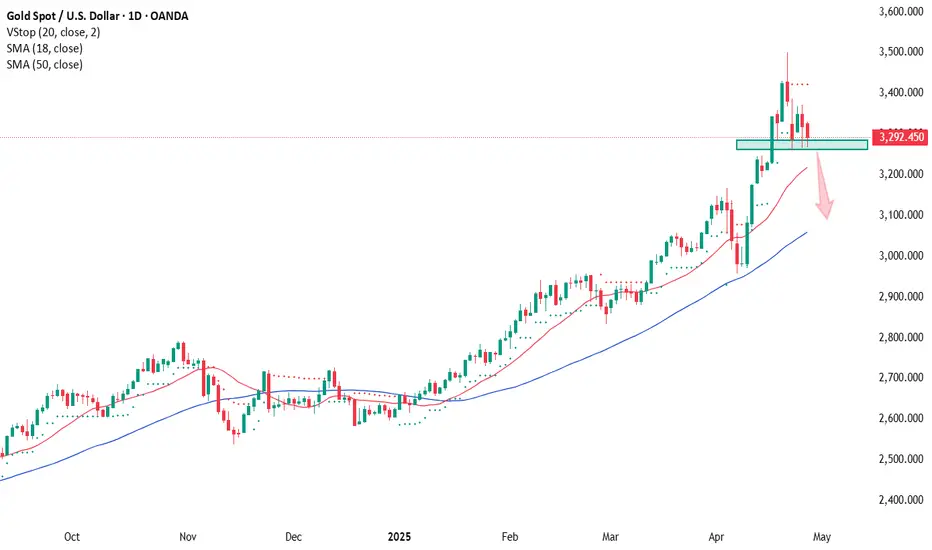
Gold at a Crossroads: Support Test in ProgressGold is currently trading near the key support zone at 3265–3285.
A confident break below this area could open the way for a deeper correction, with targets at 3220, 3125, and possibly down to 3070.
Why am I viewing it as a correction?
On the daily, weekly, and monthly charts, gold remains in a strong uptrend.
Shorting into an uptrend is risky, so if I do take a short, it will be with a reduced position size and tight risk control.
📝 Trading Plan:
1. 📉Wait for clear confirmation of a breakdown — a firm move below 3265. First target: 3220.
2. 📈If support holds and price stabilizes at current levels, I’ll be looking for long setups instead.
Patience is key here — no rush.
GOLD trade ideas
Sellers here we comeInstitutions reduced their long contracts last week. I am bearish XAUUSD. Getting a correction around 3380 - 3400 is a good supply area. So, Buyers beware.

gold upcoming may behave in same waybefore the bull run in gold , we witnessed a consolidation of more than 3 years, than typical followed the wall street pycology chart price action,,, now evrybody talking about gold gold, even a common man who doesnt have knowlegde of any technicals, suggesting that Gold will go till 4500 dollars,,
SO HERE WE TRYIED TO DECODE THE PYCOLOGY PRICE BEHAVIOR OF GOLD

XAUUSD 1H FORECASTHello guys, let me tell you that in the weekly outlook we have given for gold, we should hold it until our FVG reaches the Bearish OB, and when we reach there, we can sell from there and our target will remain until the bullish order block.

GOLDGold needs more upside, next reaction we will see is above 3390 and if it corrects there than further upside can also follow.
Disclosure: We are part of Trade Nation's Influencer program and receive a monthly fee for using their TradingView charts in our analysis.

Gold Uptrend ContinuesThe higher degree diametric wave-(E) is expanding and we can consider the recent price correction that started at $3167 as a small X-wave, as a result, gold can grow as a combination pattern to the range of 3600-3800 and even gold can touch $4000.
The second triangle pattern will probably be a neutral triangle or a reverse contracting triangle, where the wave-(a) triangle can end at 3500 or 3600.
The factor that caused the expansion of the wave-(E) is the US-China trade war, which caused investors to rush to buy gold.

GOLD | Monthly Chart – Uncharted Territory
We are officially in price discovery.
🔱 Gold has broken out of its multi-decade consolidation range and closed above the previous highs with conviction.
💰 $3,500 is now within reach — a major extension target sitting at the 2.618 Fibonacci level.
🟨 The yellow zone was the key resistance area that capped price action for nearly 13 years — now acting as a powerful base for potential continuation.
📊 This chart is a reminder: when historical resistance gives way, it’s not just a breakout — it’s a paradigm shift.

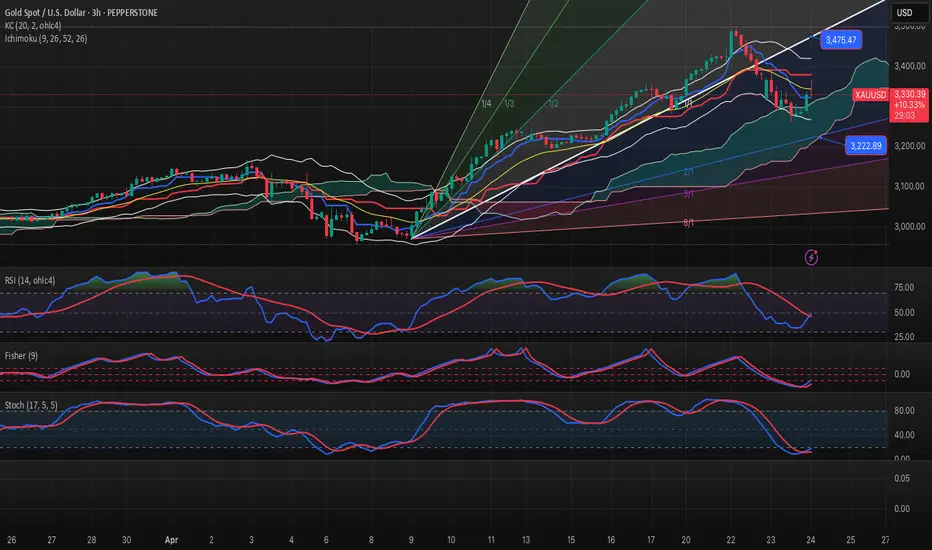
XAU BEAR FLAGHey guys, I see liquidity sweep sitting at 3259.03 Pre-London. Trade smart, Trade safe. Cheers

XAUUSD Price Outlook – Bearish Setup in Play ??Asset Overview
The chart represents a price action analysis with support and resistance zones, along with EMA indicators (50 and 200), likely on a 4H or 1H timeframe.
Key Technical Levels
Resistance Zone: ~3,400 to 3,450
First Support Zone: ~3,230 to 3,250
Second Support Zone: ~3,090 to 3,130
Indicators
EMA 50 (Red): Currently around 3,340, acting as dynamic resistance.
EMA 200 (Blue): Positioned near 3,232, reinforcing the first support zone.
Price Action Insight
Price had a strong uptrend, peaking above 3,440 before pulling back.
A lower high may be forming, suggesting possible trend exhaustion.
The current bounce appears to be a retracement back toward resistance or EMA 50.
Projected Move (As Illustrated on Chart)
Short-term bullish move into the resistance zone (~3,400–3,450).
Failure to break above resistance leads to sharp rejection.
Price retraces to first support zone (aligned with EMA 200).
If support fails, deeper drop expected toward the lower support zone (~3,100).
Strategic Notes
📉 Bearish Bias if price fails to break above resistance.
🔍 Watch for bearish candlestick patterns or divergences near resistance.
🛡️ First support aligns with EMA 200, making it a critical level for bulls to defend.
🔻 Breakdown below 3,230 opens room for larger correction to 3,100–3,090.
Conclusion
Currently, the chart suggests a potential short opportunity if price confirms rejection at resistance. The EMA cross structure remains bullish long-term, but momentum is weakening, and failure to reclaim highs could shift sentiment bearish in the short to mid-term.

time for the gold big fall started!!!finallyin my idea its time to see the gold crash finally after all these higher lows and ATH we have seen in this 3 last months...so we start to sell gold with the last ATH stop loss!AND FREE TP

XAUUSDPotential reversal
- short
- Clearly see head and shoulder pattern in the 1HR time frame
- Bearish engulfing candle sticks

Gold's downside target is AB=CD, 3132On the 4-hour chart, XAUUSD fluctuated and fell, and the bears have the upper hand. At present, attention can be paid to the resistance near 3367. If the rebound is not broken, it is expected to start to fall. The support below is around 3260. If it falls below, it is expected to form an AB=CD pattern, with a target near 3132.

GOLD-BUY strategy 3-hourly chart GANNGOLD move sharply lower, but finding support slightly below $ 3,290 and established a littly higher again. Short-term we may see a move back towards $ 3,450-3,475 area agin before down.
Strategy BUY @ $ 3,310-3,350 and take profit at $ 3,468.
Bearish drop?The Gold (XAU/USD0 is rising towards the resistance level which is a pullback resistance and cold drop from this level to the 50% Fibonacci retracement.

XAU / USD 2 Hour ChartHello traders. Just a quick post about my marked areas of interest on the chart. When I take a trade, I scalp trade. Just looking to grab some quick pips and use the same formula I learned. As I am using a high leveraged account, as soon as I am 30 pips in profit, I close 75% of the trade's profit, move my stop loss to break even ( my entry point so no loss) , and I leave the runner ( the remaining 25% of the trade) running. Let's see what the overnight sessions bring and I will post tomorrow. Big G gets my thanks. I hope this post helps someone out and makes sense. Trade smart and trade safe. Be well and trade the trend.

GOLD - WAVE 4 CORRECTION TO $2,800 (UPDATE)Gold still dipping lower as I said would happen during my video analysis. We've seen a 'BOS' on the 1H TF, followed by a retest, now we're hoping for a continuation to the downside.
But get ready to buy the huge, discounted dip back up📈

Gold ShorT XaAUUSDAfter small pull up I will go short again 1D start bearish starting soon .I an waiting short postion with long TL..

Gold’s ATH Surge: Fragile Rally or Foundation for New Highs?Gold’s bounce off key trendline support keeps the bull case alive for now — but fundamentals or political shocks could easily trigger sharp downside before any serious continuation.

Gold at a Turning Point? The Case for a Correction!Gold has been on an unrelenting vertical rally, but the cracks are starting to show! On the quarterly chart, the price has just kissed the 161% Fibonacci extension of a key channel, a level that often signals exhaustion. Meanwhile, volume has been quietly fading since early 2023, despite this marathon of a bull run with no meaningful correction yet. Is the market running out of steam? The charts are whispering a pullback—don’t miss the signs!

GOLD LONG-TERM FORECAST UPDATEMonthly Chart: Gold is forming an internal high and low, indicating a potential reversal.
Weekly Chart: Inside bar formation, waiting for market sweep. Expecting a bullish move after sweep.
Daily Chart: CRT pattern confirmed, targeting lower levels. Our bullish area remains at $2580-
Stay tuned for further updates!

XAUUSDPreferably suitable for scalping and accurate as long as you watch carefully the price action with the drawn areas.
With your likes and comments, you give me enough energy to provide the best analysis on an ongoing basis.
And if you needed any analysis that was not on the page, you can ask me with a comment or a personal message.
Enjoy Trading ;)

GOLD - $6,200+ BULL RUN?! (MONTHLY TF)I believe we’re in for another huge bull run towards Wave 5 ($6,200), after a Wave 4 correction towards $2,800. Waiting on a final move down to liquidate late buyers.
Confluences👇
⭕️Wave 3 Peaked at Psychological Number of $2,500 (LQ Point).
⭕️Wave 4 & 5 Pending.
⭕️Overbought Market Conditions.

XAU/USD 23 April 2025 Intraday AnalysisH4 Analysis:
-> Swing: Bullish.
-> Internal: Bullish.
Price has now printed a bearish CHoCH according to my analysis yesterday.
Price is now trading within an established internal range.
Intraday Expectation:
Price to trade down to either discount of internal 50% EQ, or H4 demand zone before targeting weak internal high priced at 3,500.200.
Note:
With the Federal Reserve's dovish stance and persisting geopolitical uncertainties, heightened volatility in Gold is expected to continue. Traders should proceed with caution and adjust risk management strategies in this high-volatility environment.
Price could also be driven by President Trump's policies, geopolitical moves and economic decisions which are sparking uncertainty.
H4 Chart:
M15 Analysis:
-> Swing: Bullish.
-> Internal: Bullish.
Analysis and bias remains the same as yesterday's analysis dated 22 April 2025.
In addition we should be mindful that All HTF's require a pullback and H$ TF has indicated the start of bearish pullback phase as a bearish CHoCH has been printed, therefore, it should not come as a surprise if price printed a bearish iBOS.
You will note that currently price has mitigated an M15 demand zone and strong low is currently holding.
Price printed as per analysis dated 18 April 2025 by targeting weak internal high.
Price has continued to print higher-highs with minimal pullbacks.
Multiple CHoCH's have been printed, however, I will apply discretion and not classify them as CHoCH's in order not to distort internal structure due to very minimal pullbacks.
Since most recent all time high price has printed a bearish CHOCH and is now trading within an established internal structure which I will continue to monitor.
Intraday Expectation:
Price to trade down to either discount of 50% internal EQ, or M15 demand zone before targeting weak internal high priced at 3,500.200
Note:
With the Federal Reserve maintaining a dovish stance and ongoing geopolitical tensions, volatility in Gold prices is expected to remain elevated. Traders should exercise caution, adjust risk management strategies, and stay prepared for potential price whipsaws in this high-volatility environment.
Trump's tariff announcement will most likely cause considerably increased volatility and whipsaws.
M15 Chart:
