Has the gold high diving reached its peak?The 1-hour inverted V reversal, the 1-hour moving average of gold also began to show signs of turning. There was no risk aversion news stimulus in the second half of the night, so the daily line could not go up, it was a high shooting star, the high points of the US rebound were successively lower, and the short-term trend of gold has formed a short position. The second rebound of the US market was under pressure and fell again near 3430. Then the US rebound below 3430 continued to be shorted, and the US rebound near 3420 could continue to be shorted. The market is changing rapidly. Since gold can't go up, and it starts to fall, the gold bulls have been declared over in the short term.
On the whole, the short-term operation strategy for gold today is to short on rebounds and go long on pullbacks. The short-term focus on the upper side is the 3420-3430 resistance, and the short-term focus on the lower side is the 3280-3285 support. Friends must keep up with the rhythm.
Short order strategy:
Strategy 1: Short 20% of the gold position in batches when it rebounds to around 3420-3425, stop loss 6 points, target around 3380-3350, break to see 3300 line;
Long order strategy:
Strategy 2: Long 20% of the gold position in batches when it pulls back to around 3285-3290, stop loss 6 points, target around 3325-3350, break to see 3380 line;
GOLD trade ideas

Gold vs Bitcoin — Is a Historic Shift Coming ?Hello Traders 🐺
In this idea, I want to take a closer look at the GOLD price — because lately, many people have been asking:
"Where is the top?"
"Are we still bullish on gold?"
And more importantly:
"What’s your take on this as both a crypto trader and macro analyst?"
So let’s dive in and break it down from both the fundamental and technical perspectives.
🟡 Gold and Its Correlation with Other Assets
As you probably know, gold is a safe haven for long-term investors, central banks, and governments.
So when inflation rises or when we see money-printing policies to avoid a recession, gold tends to shine — because it’s a classic anti-inflation asset.
But here’s the catch:
Gold isn’t the only game in town.
Other inflation-hedging assets like Bitcoin, stocks, silver, and real estate also compete for capital — so it’s natural to see money rotate between them.
🇺🇸 Trump’s Policy Twist — Gold vs Bitcoin?
A few weeks ago, Donald J. Trump hinted that the U.S. might sell part of its gold reserves to buy BTC.
Crazy, right? But here’s where the story gets really interesting...
If this happens, we could start seeing an inverse relationship between gold and BTC — kind of like the early days of oil vs. gold correlations.
Let me break it down.
🤖 BTC vs. Gold — Simple Math, Big Picture
Gold’s current market cap is about $22 Trillion — which is almost 20 times larger than BTC’s.
Let’s ask a simple question: Do we need another GETTEX:22T to pump gold 100%? 👉 No.
Why?
Because most gold is held by:
Central banks
Governments
Jewelry industry
Only a small percentage is available for trading. So even a tiny reduction in selling pressure = huge impact on price.
But here’s the flip side: BTC’s market cap is just $1.7T, and a huge portion is held by:
Institutions like BlackRock
Whales like Michael Saylor
Lost wallets from early adoption
So it’s simple:
👉 BTC has way more room to grow, and is easier to store, transfer, and scale.
If we enter a new QE cycle, the upside potential for BTC will be far greater than gold — and smart money knows this.
🧠 Technical Analysis (TA) Time
On the chart, gold has broken above a rising wedge — which is typically a bearish pattern.
So... is this a trap?
In my opinion: No.
Why?
Because if the wedge breakdown were to play out fully, the target would be around $280, which is just laughable 😂 — a 90% crash? Highly unlikely.
Instead, here’s the bullish scenario:
If gold can hold above the monthly support, we may see a slow, steady rally — not parabolic like crypto, but meaningful.
🎯 Bullish target: $7,760
📉 DXY, Fed Policies & Gold’s Future
As I said in my last idea about the U.S. Dollar Index (DXY), the dollar is showing weakness, and the Fed might cut rates to avoid a recession.
Check the chart I posted here: 👉 DXY Chart Idea :
What do we see?
A clear double top pattern
Breakdown from key support
Probable shift to QE mode
All of this could ignite a new bull cycle — and yes, gold may benefit...
…but don’t forget what I said about Trump.
If the U.S. starts selling gold to buy BTC, we might see a short-term correction in gold back to the green support box before the real breakout.
So make sure to stay sharp — and as always:
🐺 Discipline is rarely enjoyable, but almost always profitable. 🐺
🐺 KIU_COIN 🐺

4/22 Gold Trading StrategyGold continued its upward movement yesterday. Short positions around 3380 yielded limited gains, while those near 3410 are currently underwater. Many traders may be in a similar position, and I want to emphasize: there’s no need to panic—today offers a strong opportunity for the bears.
Technically, gold is now in the final stage of a five-wave upward structure . The bullish momentum is fading. The remaining upside is likely limited to within $50 , while the downside potential could exceed $80. In short, there’s an 80%+ chance of a pullback or consolidation today, offering a solid exit or profit opportunity for short positions.
The price is expected to retrace below 3360, and once profit-taking begins, the decline may accelerate.
Trading Strategy for Today:
Sell between 3450–3480
Buy between 3330–3310
Trade flexibly within 3440–3400 / 3410–3355

Gold analysis strategy today- Bullish Channel as an Corrective Pattern in Short Time Frame
- Change of Characteristics
- RSI - Divergence
- Completed " 12345 " Impulsive Waves
- Rising Wedge

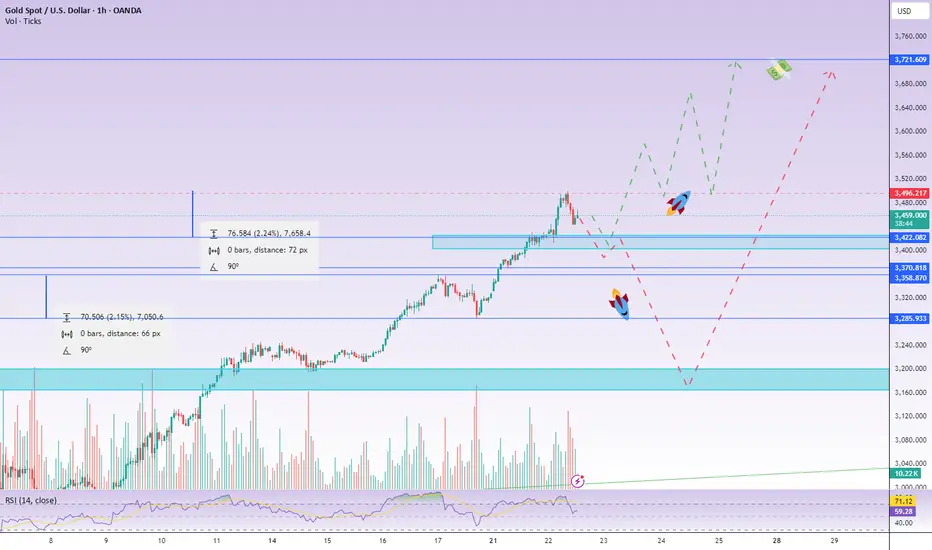
new peak 3520, waiting for gold price to touch⭐️GOLDEN INFORMATION:
Gold prices extended their record-breaking surge on Tuesday, soaring past the $3,450 mark during the Asian session as investors sought refuge in the traditional safe-haven asset amid mounting fears of a US recession and broader financial market volatility.
Persistent concerns over the economic outlook and waning confidence in the US Dollar (USD) have continued to drive demand for the USD-denominated precious metal. The greenback remains under pressure, further amplifying gold's appeal.
Adding to the uncertainty, US President Donald Trump once again criticized Federal Reserve Chairman Jerome Powell, stoking fears about the central bank’s independence. Reports suggesting the administration explored legal avenues to potentially remove Powell have only deepened market unease, boosting the allure of gold as a hedge against policy and economic instability.
⭐️Personal comments NOVA:
Fomo price increase, trade tension, gold price benefits
⭐️SET UP GOLD PRICE:
🔥SELL GOLD zone : 3519- 3521 SL 3526
TP1: $3505
TP2: $3490
TP3: $3465
🔥BUY GOLD zone: $3403 - $3405 SL $3398
TP1: $3415
TP2: $3430
TP3: $3445
⭐️Technical analysis:
Based on technical indicators EMA 34, EMA89 and support resistance areas to set up a reasonable BUY order.
⭐️NOTE:
Note: Nova wishes traders to manage their capital well
- take the number of lots that match your capital
- Takeprofit equal to 4-6% of capital account
- Stoplose equal to 2-3% of capital account

XAUUSD SELL SETUP , Sold at $3381XAUUSD SELL SETUP
Currently $3381
Sold at $3381
(Trading plan XAUUSD go up to $3410 we will add more sell)
Expecting target (3362 0R down )
Incase of early exist will update this anaylsis
Its not a Financial Advice

Gold Analysis April 22Gold is having a slight correction after touching the round resistance level of 3500.
The candlestick force on the h1 time frame is supporting gold to increase again at the end of the European session. Pay attention to the breakout zone around 73 and the ATH zone around 3500 for Sell strategies. Break 3500, do not SELL anymore but wait until 3520.
The buying strategy may be more preferred for traders. The zones where the buyers have appeared in the past are 3435-3408-3385-3355. Pay attention to whether the candlestick force is really strong before making a long-term buying decision.

GOLD holds above 3,400, heading towards 3,500As the US Dollar OANDA:XAUUSD weakened and Sino-US trade tensions raised market concerns about the economic outlook, investor risk aversion increased, pushing gold prices to a record high, breaking through the $3,400/ounce mark and maintaining price action above this level, continuing to target a new all-time high of $3,500.
The US Dollar fell sharply during the day as US President Donald Trump made critical remarks about Federal Reserve Chairman Jerome Powell, further undermining market confidence in the US economy. A weaker US Dollar typically makes US Dollar-denominated gold more attractive to holders of other currencies.
On trade, China accused the United States of abusing the tariff tool and warned other countries not to reach broader economic and trade agreements with the United States at the expense of their own interests. Gold, long seen as a hedge against uncertainty and a highly liquid asset, has risen more than $700 since the start of 2025. Gold broke through $3,300 for the first time last Wednesday and the surge has pushed prices above $100 again in just a few days.
Trump is considering removing Fed Chairman Powell and has repeatedly called for interest rate cuts. Chicago Fed President Goolsbee has spoken out publicly against undermining the independence of the central bank.
Trump also made some shocking statements. Trump shared his thoughts on the negotiations on his social media platform Truth Social, saying, "The golden rule of negotiation and success: he who has the gold makes the rules," meaning he who has the gold rules.
This post about gold is quite interesting, considering the market volatility caused by Trump's previous comments on stocks on social media.
Trump also said, "Businessmen who criticize Tariffs are bad at business, but they are really bad at politics. They don't understand or realize that I am the best friend American Capitalism has ever had!"
Technical Outlook Analysis OANDA:XAUUSD
On the daily chart, gold continues to hold above the $3,400 base point and the 0.786% Fibonacci extension level, which is a positive factor for the gold price's bullish outlook. On the other hand, the Relative Strength Index (RSI) is operating in the overbought zone but is not sending any signals indicating a possible downside correction, a sign indicating a possible downside correction is the RSI heading below 80.
In terms of current position, gold still has a bullish outlook in the short term with the price channel as the trend and maintaining activity above the 0.786% Fibonacci extension level provides conditions for gold to aim for a new bullish target at $3,482 in the short term, more than the raw price point of $3,500.
During the day, the short-term bullish outlook of gold will be focused again by the following positions.
Support: $3,420 – $3,400
Resistance: $3,482 – $3,500
SELL XAUUSD PRICE 3517 - 3515⚡️
↠↠ Stop Loss 3521
→Take Profit 1 3509
↨
→Take Profit 2 3503
BUY XAUUSD PRICE 3448 - 3450⚡️
↠↠ Stop Loss 3444
→Take Profit 1 3456
↨
→Take Profit 2 3462

Gold in a Sideways RangeHello traders and investors!
The 3283 level, which was the sellers’ target on the daily timeframe, was confidently defended by buyers.
The attacking seller’s candle at this level showed high volume but was absorbed by buyers.
On the 1H timeframe, the market is moving sideways, with active buyer initiative.
The boundaries of the range are marked on the chart with black lines.
It is reasonable to expect the price to move toward the upper boundary of the range at 3363–3370.
This analysis is based on the Initiative Analysis concept (IA).
Wishing you profitable trades!

Gold Ideas - XAUUSD Weekly Outlook | April 28, 2025🧠 Quick Outlook:
Gold remains locked in a corrective range after its aggressive rally to new all-time highs.
Price is currently consolidating between major liquidity zones, preparing for its next big move.
However, growing geopolitical risks — including rising Middle East tensions and potential currency interventions out of Japan — could trigger safe-haven flows, especially during Asia session volatility.
While the high timeframe structure remains bullish above the 3220–3235 pivot,
the immediate tactical focus is on the 3340–3365 zone, where key liquidity battles are unfolding.
🔥 Major Zones to Watch:
Resistance 3380–3395 Major supply and flip zone — strong liquidity cluster
Resistance 3350–3360 Minor local resistance — potential bull trap area
Support 3260–3280 Critical intraday support and liquidity pocket
Support 3220–3235 Last pivot standing to maintain bullish structure
⭐Tactical Focus This Week:
🎯 Will Gold reject or conquer the 3380–3395 stronghold?
🎯 Will 3350–3360 act as a stepping stone or a snare for early buyers?
🎯 Are buyers prepared to defend the 3260–3280 liquidity pocket with real force?
🎯 What happens if 3220 collapses?
Patience and sniper discipline will make the difference this week, as Gold approaches critical decision points and major news.
📌 Important Notice!!!
The above analysis is for educational purposes only and does not constitute financial advice. Always compare with your plan and wait for confirmation before taking action.
🖊️ If these insights help you refine your trading plans, give us a boost and follow GoldMindsFX on TradingView. Let's grow together! 🛡️

Gold rebounds weakly and returns to a downtrendGold trend analysis: The current gold price is in a stalemate stage of long-short game. On the one hand, the path of the Fed's easing policy has been basically clear, and the US dollar is facing correction pressure; on the other hand, the stable global risk sentiment and the strong performance of the stock market have weakened the attractiveness of gold as a safe-haven tool. The repeated signals of global trade negotiations have also made the market direction unclear. From a technical point of view, gold has received support after the correction to the 26.3% Fibonacci retracement level of 3317 this week, and has returned to above $3,300 in the short term. The upper resistance focuses on the 3380 position. Once it breaks through, it will open up space to the 3400 mark.
From the daily gold chart, yesterday's gold price fell sharply and recorded a large real body negative candlestick pattern. The previous price peaked at a relatively obvious high, suggesting that the upper pressure effect is strong. The MACD indicator double line began to turn downward, increasing the risk of further short-term correction. However, the MA5 and MA10 moving averages have not turned downward yet, so you can pay attention to the support and defense of the moving averages. From the 4-hour gold chart, the gold price has maintained a volatile decline since it came under pressure at the 3500 line. The current price has fallen back to the 3260 line, with a short-term decline of US$240. Although there has been a rebound during the day, the upward trend has been destroyed. The MACD indicator double line has issued a dead cross reversal signal, suggesting that the correction trend may have started.
After the rise, gold fell back and fell below the support levels of 3351 and 3330. Now the market rebounded near 3314, which is also in line with our analysis of the long and short trend. In the big trend, the gold rally did not cross 3380, so there is still downward demand, that is to say, it can only be regarded as a rebound during the decline. In the short term, this wave of gains stopped at 3367, and now it broke through 3351 and pierced 3316 to rebound. The main focus on the upper support conversion resistance level of 51, followed by 3342. Specifically, you can wait for 42 to be touched and use 51 as protection to go short to see the gold price break the previous rebound low of 3314 to 3300. If it breaks down effectively, you can move the protection loss down to see the position of the rebound turning point of 3283 and 3260.

Gold Updates - Friday April 25🔔 Friday Market Prep | Key Gold Zones Only
Microstructure whispers. Friday price action bites.
Friday is notorious for:
Low-volume traps after London lunch;
Dealer sweep games;
Profit-taking volatility;
And “just because” fakeouts to set up Monday gaps;
We don’t predict—we prepare. These are the zones that matter going into NY session.
🔴 SELL INTEREST ZONES
• 3362–3372 - HIT today gave 700+ pips profit✅
🔁 Proven supply—hit twice already, high reactivity
🧠 Only valid on LTF confirmation for re-entry
• 3384–3393
🔁 HTF imbalance + OB trap zone
🧠 Ideal for NY fakeout spike
• 3410–3415
🔁 Premium OB + liquidity grab zone
• 3450–3457
🔁 Untouched HTF OB + stop hunt territory
🟢 BUY INTEREST ZONES
• 3278-3288
📍 Support pocket – OB + below Asia low
• 3250–3260
📍 Deep OB + structural base
• 3224–3233
📍 HTF EQ + reactive demand sweep zone
🧐 Friday is not for heroes—it’s for hunters. Watch for the sweep ➝ shift ➝ confirm before touching anything.
Let Gold make the first move. We respond.
📌 Important Notice!!!
The above analysis is for educational purposes only and does not constitute financial advice. Always compare with your plan and wait for confirmation before taking action.

Gold: boldly to the upsideThe price of gold continues its way up to higher grounds, supported by high uncertainty caused by trade tariffs imposed by the US Administration to the rest of the world countries. Certainly, the most important tariffs are related to China, as the US major trade counterparty, which is currently in a wait-and-see phase. The price of gold reached a new all time highest level at $3.350 on Thursday, after which, the price reverted just a bit. Analysts are noting that this could be the profit-taking moment on the market.
The RSI shortly reached the level of 50 two weeks ago, however, reverted again back toward the higher grounds. In the past week, the RSI again headed toward the overbought market side, closing the week at the level of 72. There is still no change with MA lines. Both MA 50 and MA 200 are moving as two parallel lines with an uptrend, without any signal that the potential change of trend might come anytime soon.
Analysts are pointing that there might be some short reversal of the price of gold in the coming period, as it reached a fresh new all time highest level. They are pointing that this reversal might be a reflection of a profit=taking. Such a scenario might be possible in the week ahead, but some higher reversal to the downside should not be expected. Fundamentals are the ones which have been driving the price of gold for some time in the past, and they will continue to do it in the future. As long as the topic of tariffs is a major narrative of the US Administration, the price of gold will be supported by it. Considering that gold is currently moving in an uncharted territory, new ATHs are quite possible also in the future.

Short gold directlyGold's 1-hour moving average is still in the form of a dead cross, and gold fell back again after rising high, so gold is now beginning to fluctuate. Although gold broke through the 3367 line, gold did not stand firm after the breakthrough. For the time being, gold is still fluctuating in a wide range.

XAUUSD TRADE PLAN H1XAUUSD TF H1
SELL/SHORT PLAN (BASE AREA)
cancel if price break ma100(blue line) or break structure pattern
take profit max bos area (c) max correction wave price (3241-3200)

Gold XAUUSDLooking strong bullish. Targets are as shown in Analysis.
Let me know in private if you have any questions or concerns.
Thanks,

Gold’s Super Bullish Breakout – Eyeing $3700 or $3200?My previous analysis played out very well, except I was concerned that we didn't reach the $3,180 area. With the ongoing trade wars and recent comments from Powell, the USD is weakening significantly, and we’re seeing a gold move unlike any I’ve experienced before—possibly the most bullish pattern yet.
Based on my analysis from the edge of the market, we can identify key breakout levels that must hold to continue pushing toward $3,700.
Watch the 1H and 4H wick and body formations:
1. If the 1H candle body can break above $3,500, we’ll likely continue making higher highs and higher lows toward $3,700.
2. If the 1H candle body fails to hold the $3,400 level, we might see the pullback I’ve been anticipating—possibly down to the $3,200 level >> and pullback towards $3700.
GOLD Trending Higher - Can buyers push toward 3,300$?OANDA:XAUUSD is trading within a well-defined ascending channel, with price action consistently respecting both the upper and lower boundaries. The recent bullish momentum indicates that buyers are in control, suggesting a potential continuation.
The price has recently broken above a key resistance zone and may come back for a retest. If this level holds as support, it would reinforce the bullish structure and increase the likelihood of a move toward the 3,300 target , which aligns with the channel’s upper boundary.
As long as the price remains above this support zone, the bullish outlook stays intact. However, a failure to hold above this level could invalidate the bullish scenario and increase the likelihood of a pullback toward the channel’s lower boundary.
Remember, always confirm your setups and use proper risk management.

The gold strategy is correct, enter the market at key points.Gold clearly treated the wide range of fluctuations, and the strategy was basically realized! In the real market, I also arranged short orders at 3345 and 35, and took profit at 3313-14! I continued to arrange long orders at 3302, and finally successfully reached the profit target of 3315! The overall harvest was good.
Analysis of gold trend:
On Tuesday (April 29) in the Asian market, spot gold fluctuated in a narrow range and is currently trading at $3337.58/ounce. Gold prices reversed their decline on Monday and rose. Earlier, they fell to around $3268, but then there was a low-absorption buying, and gold prices closed at $3343.91/ounce; the dollar fell across the board on Monday, which also provided support for gold prices. Investors cautiously waited for further news on US trade policies and prepared for a week of intensive economic data, which may initially indicate whether US President Trump's trade war is having an impact.
From a technical perspective, gold prices reversed their decline on Monday and rose. Gold repeatedly tested the 3260-3270 area for support. Gold has formed a multiple bottom structure in the short term, so gold may end its short-term adjustment. This time, gold has already adjusted, and it is unlikely to adjust again. Therefore, as long as it does not break the 3260 low in the near future, gold will rise and there will be room for growth. As for the high point, there are two dividing points, one is the 3337 high point, breaking 3337 is a strong shock, and the other is the 3370 high point, breaking 3370 is absolutely strong, then, the upper space is opened, and then look at 3420-3500.
From the daily chart, the daily line forms three bottoms at 3260, and the daily line closes positively, and the bullish trend is obvious. As long as the daily line is positive, it will not be able to go to the upper track or the previous high is just around the corner. The 4-hour cycle is also absolutely strong after Monday's rise, but now the unilateral rising mode of the Bollinger opening has not yet formed, and the gains and losses of 3370 will be tested here. Therefore, if the bullish long position continues on Tuesday, it must pay attention to whether 3370 breaks. If 3370 breaks, there will be a strong unilateral rising space. If 3370 does not break, it will still be a large range of fluctuations. Then, the only thing to consider during the day is to adjust the long position. Today, the lower support is around 3300-3310, and the upper pressure is around 3350-3360.

Gold's wide range of fluctuationsGold failed to break through the 3370 level last Friday, and was blocked and fell back. The lowest level reached 3265, a single-day drop of more than 100 US dollars. Gold rebounded and continued to short at the beginning of this week, paying attention to the upper resistance of 3352. Rebounding and relying on this resistance, continue to short, and look at the 3260-3265 line.

XAUUSD LONG SIGNALUnder current market conditions, the area near 3315.25 has been identified as a critical support zone, where the AI model detects a high-probability trade setup.
From a technical perspective, a clear directional bias based on recent price action patterns. Suppose the market demonstrates increased volume and price stability above key moving averages in the 3315.25 area. In that case, traders are advised to monitor for trend-continuation entry opportunities in alignment with the prevailing momentum.
Profit targets are defined at 3352.88 and 3401.74, corresponding to logical technical resistance zones. These levels are designed for staged profit-taking across different trade management styles. Stop-loss should be strictly enforced at the designated level; once breached, the strategy is considered invalidated in order to limit potential downside.

Gold's decline under pressure is in line with expectations! Gold market trend analysis:
Gold technical analysis: This week, gold prices fluctuated, opening at 3332. So far, the high is 3500 US dollars and the low is 3260 US dollars. On Monday, it soared by 100 US dollars. On Tuesday, it continued to rise to 3500 highs in the Asian session and then fell back. On Tuesday and Wednesday, it plummeted by nearly 240 US dollars. The volatility slowed down on Thursday. The overall intraday fluctuations remained within 3367-3288. Today, the weekly line closed. The weekly line will compete for the closing of the Yin-Yang cross K line. The short-term is more intense. From the consolidation on Thursday, there is no further decline, which also leaves room and suspense for today's weekly closing. If the weekly line closes lower, it is expected to adjust further next week. Pay attention to the closing strength and weakness of the weekly K line this week.
Today's opening trend of the gold market is like yesterday. The Asian session started the upward mode, rising all the way to around 3370 US dollars. However, it encountered strong resistance here, and then turned downward and started a decline. It is worth noting that today's gold price not only failed to break through this key resistance level, but also fell below the low hit in yesterday's European and American sessions, falling to a low of US$3,287 before rebounding.
In view of the important trend of gold price breaking the key point, the market will most likely continue the short-selling idea in the future. From the current market structure, the position of $3260 has become the focus of the market. Investors need to pay close attention to whether the gold price can reach or even fall below this point. Once it effectively falls below, the short-selling trend will be further strengthened, and the market may usher in a deeper adjustment.
From the hourly level, yesterday's low was at $3306, and the rebound just now showed an obvious stop signal at this position. Based on this, the current short-term suppression level can refer to $3315, and the upper level is $3328. For short-term investors, you can consider waiting for the gold price to rebound to around $3315 to arrange a short order and continue to be bearish on the gold price. The first thing to pay attention to below is the support of the low point just touched at $3287. If this support level is lost, the next key support level will be $3260, the first low point on the previous downward journey. If $3260 is also effectively broken, the short-selling force will be further released, and the gold price may face a larger decline. On the whole, today's short-term operation strategy for gold is to short on rebound and long on pullback. The upper short-term focus is on the 3315-3320 resistance line, and the lower short-term focus is on the 3285-3260 support line. Friends must keep up with the rhythm.
Gold operation strategy reference: short gold rebound near 3310-3320, target near 3290-3285, break to see 3260 line.
Gold pullback near 3270-3260 long, target near 3290-3310, break to see 3330 line.

Lingrid | GOLD potential Trend Continuation FormationsOANDA:XAUUSD market pulled back as expected and retested 50% of the previous daily range. The market is forming bullish flag pattern or triangle pattern which are both trend continuation formations. If the price breaks above, it may trigger more upward pressure pushing price toward the channel border. Furthermore, on the 4H timeframe a pinbar candlestick pattern was formed suggesting the price may establish new all time highs. Considering that we don't have high impact news today, the price may move sideways closing Friday candle near previous day high. My goal is resistance zone around 3380
Traders, if you liked this idea or if you have your own opinion about it, write in the comments. I will be glad 👩💻
