XAUUSD m15 SellHello everyone, a sell trade opportunity may be considered for gold on the M15 chart. It is advisable to set your trade with a 1:1.50 risk-reward ratio.
GOLD trade ideas

Gold is expected to continue to retrace the 3235-3225 region.Fundamentals:
1. The tariff issue has been relatively eased, and Trump's repeated attitude towards tariffs has made the market bullish energy not firm;
2. A small-scale conflict broke out between India and Pakistan, which has not had a great impact on gold for the time being. It is necessary to pay attention to whether the situation will escalate;
3. At the same time, it is necessary to pay attention to the dynamics of the Federal Reserve, the Russia-Ukraine negotiations, the US-Iran negotiations, etc.
Technical aspects:
At present, gold is in a state of shock correction as a whole, but from the current structure, the rebound momentum of gold is insufficient, and the rebound high is gradually decreasing. The short-term support below is in the 3265-3260 zone; the short-term resistance above is at 3310-3320; if gold cannot stand above 3300 in the short term, gold may fall further and break through the 3265-3260 zone, and continue to the 3235-3225 zone.
Trading strategy:
Short-term trading is still mainly shorting gold after the rebound. You can use the 3300-3320 area as resistance and short gold in batches
Trading target:
Profit target this week: ≥$30K;
OANDA:XAUUSD CAPITALCOM:GOLD FOREXCOM:XAUUSD FOREXCOM:XAUUSD

GOLD Goes "Buy The Dip", Following 200-hour SMA Major SupportGold prices have experienced significant volatility over the last days, with conflicting reports on the current trend. According to some sources, gold prices have increased, with spot gold reaching $3,500 per troy ounce, new all the history high on Tuesday, April 22, 2025.
The $3,500 milestone has sparked increased interest from investors and market analysts, meaning that Gold spot doubled in price over the past 5 years, 3rd time in history ever.
Despite the short-term volatility, gold has shown a strong performance since the beginning of 2025, with an increase of approximately 30-35% year-to-date. Market analysts remain bullish on gold, with some forecasting prices to reach $ 4'000 per ounce in the near term.
The main 1-hour Gold spot OANDA:XAUUSD graph indicates on 200-hours SMA technical support, with further upside opportunity due to forming on the chart descending triangle (flat bottom/ descending top) breakthrow.
--
Best #GODL wishes,
💖 Your Beloved @PandorraResearch Team

XAUUSD4H Supply Zone (3367.55 area): Price has rejected from here multiple times (highlighted with red arrows).
4H Demand Zone (3260.25 area): Price has also rejected upwards (green arrows) from here.
Current Structure:
Price is stuck between supply and demand, inside a 4H consolidation zone.
There’s a 1H resistance currently being tested (~3308 area).
Trading Plan Outlined:
If price breaks and retests above the 1H resistance → Look for buys toward 3365.
If price rejects at 1H resistance → Look for sells down toward 3268.
EMA Setup: Blue (9 EMA) and Orange (likely 50 EMA) are being used for momentum cues.

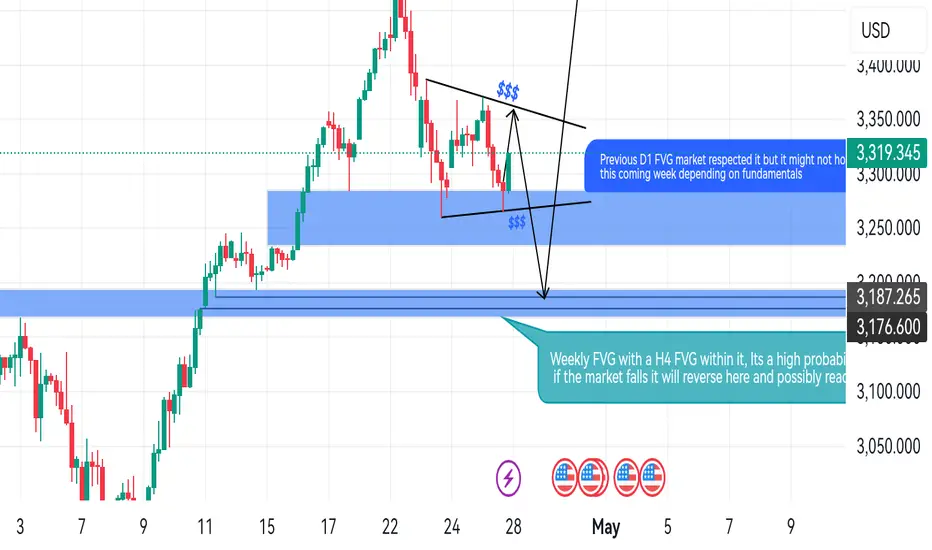
Possible Buy, explanation is in my previous analysisRefer to previous analysis!!!
Market is at the Daily gap currently but the daily gap might not hold and we could see it drop to the weekly gap where it is highly to turn around and could go all the way to 3500 area again
Gold still has the risk of adjustment in the short termAnalysis of gold market trend:
From the daily level, gold rose strongly during the trading session on Tuesday, touched the key price of 3500, then fell under pressure and finally closed with a negative line. This trend of rising and falling shows that the selling pressure from above is heavy, and the bulls are strongly blocked by the bears at high levels. Then, gold continued to fall on Wednesday and closed with a negative line again, forming a technical pattern of two consecutive negative lines. This continuous decline further confirms that the short-term bears are dominant.
From the 4-hour gold chart, the gold price has maintained a fluctuating decline since it was under pressure at the 3500 line. The current price has fallen back to the 3260 line at its lowest, and the short-term decline has reached 240 US dollars. Although there has been a rebound during the day, the upward trend has been destroyed. The MACD indicator double line has issued a dead cross change signal, suggesting that the callback trend may have started. Pay attention to the pressure effect of the 3368 line during the day. For the current market, the rebound is just a flash in the pan, and it rebounded sharply again, reaching the highest point near 3367 and then retreated. It is currently maintained near 3330. In fact, the market is actually at a loss for long and short positions, and is simply unable to withstand its huge shocks. For the Asian session's highs and falls, we support it according to the shock retracement. For example, if the European session rebounds again near 3358-60, we will continue to try to short, with the target at 3320-10, and a loss of 3370. The market amplitude is so drastic that I need to strictly implement good operating habits, try with a light position, strictly stop loss, and don't have a fluke mentality! On the whole, today's short-term operation strategy for gold is to rebound and short, supplemented by callbacks. The short-term focus on the upper side is 3368-3370, and the short-term focus on the lower side is 3260-3285. Friends must keep up with the rhythm.

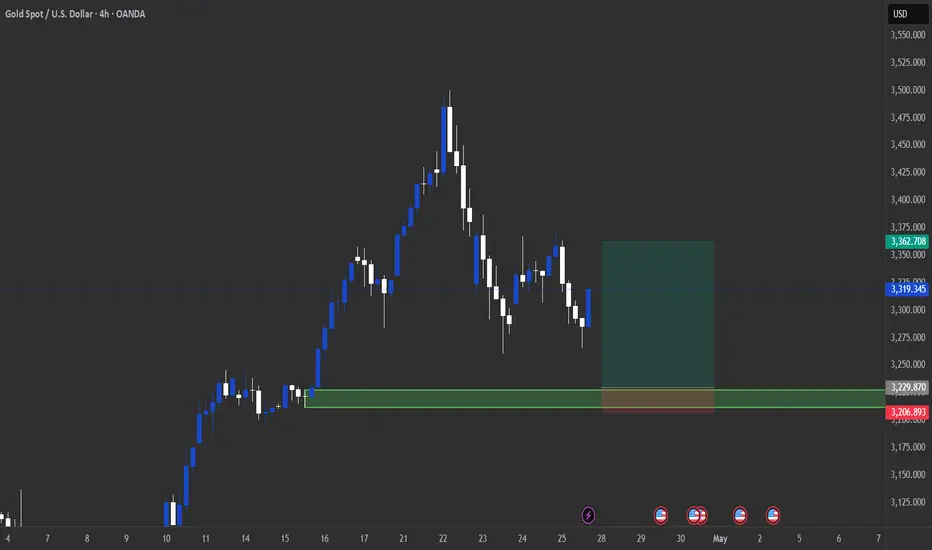
XAUUSD Potential Demand zone Long playIdeas on this one? potential long play off the demand zone marked in the chart
Short XAUUSD from the key level 3500The 3500 selling zone is the key level, the price is in an uptrend, but there are signs of profit taking, adjustment, selling to the 3260 zone is the imbalance zone.

XAU/USD: All-Time High Reached with Pullback Opportunity AheadThe XAU/USD market has set a new all-time high, continuing its strong bullish trajectory toward the 3300 resistance zone. This level may act as a potential reversal point, offering a chance to enter on a pullback.
A range zone has formed around the 3225 level, which, along with the nearby upward trendline, could serve as a key support area for identifying buy signals. With high-impact news scheduled for today, volatility is expected. Should a retracement occur, the support zone around 3225 may provide a launchpad for the next move toward the resistance zone at 3390

#GOLD Sell 3470 - 3490#GOLD Sell 3470 - 3490
Stoploss 3530
Breakeven 3465
TakeProfit 1: 3468
TakeProfit 2: 3460
TakeProfit 3: 3446
TakeProfit 4: 3434
TakeProfit 5: 3422
Trade at your own risk
Protect your capital
The Wizard 🧙♂️ FDT
TUE 22 APR '25 04 AM EST

Gold ended successfully, Where will the market go next week?The idea of keeping gold short at a high level is that after the winning streak of gold ended, gold continued to fluctuate in a narrow range. If there is no opportunity, then it will end early and rest. After all, it is Friday. After a hard week, it is time to rest. The news on the weekend has changed a lot, and it is full of uncertainty. Gold rebounded again in the second half of the night, which seems to be strong, but has gold reversed? It is too early to say now.
The 1-hour moving average of gold continues to be short, but after gold bottomed out at the first-line support near 3265, gold rebounded by more than 50 US dollars. Is this rebound a reversal? Not necessarily, because now it basically fluctuates by about 100 US dollars every day, and it is hard to say that a rebound of 50 US dollars is a reversal. The strength of next week is the key. If the rebound of gold next week is not very strong, then gold will still fluctuate and be short. The resistance of the 1-hour moving average above gold is near 3354, and the top of the negative line of gold on Friday is near 3352. If there is no effective breakthrough of these two positions next week, it will still be a fluctuating and short trend.
The weekly line of gold is also a shooting star with a long upper shadow at a high level. If there is no big bullish news to support gold in the short term, gold will be under pressure at a high level in the short term, and the daily line is also down from a high level without a strong counterattack. On the whole, there is still room for adjustment in the short term for gold.
The market is changing rapidly and confusing. Sometimes we cannot be confused by the illusion in front of us. Only by not being afraid of the clouds blocking our eyes can we see clearly behind the market. Before gold reverses, it is still bearish in the short term. It is light to follow the trend and messy to go against the trend. The market is always right. Going against the market will eventually be taught a lesson by the market. Don't have any fluke mentality in the face of the trend. The market will not forgive your mistakes again and again.
Next week's operation ideas: short gold 3350-60, target 3310-3300;

Market trend analysis and unique operation layoutTechnical analysis of gold: From the performance of the daily chart, the recent trend of gold prices has shown a high consolidation trend, and there has been a significant correction from the high point near $3,500. After hitting the low point of the week, the gold price rebounded to a certain extent, but the rebound strength was blocked near the 23.6% Fibonacci retracement level (about $3,368-3,370), which has now become an important short-term resistance. Today's opening trend of the gold market is like yesterday. The upward mode started during the Asian session, rising all the way to around $3,370, but encountered strong resistance here, and then turned downward and started a decline. It is worth noting that today's gold price not only failed to break through this key resistance level, but also fell below the low point hit by yesterday's European and American sessions, and rebounded after the lowest point fell to $3,265.
In view of the important trend of gold prices breaking down key points, the subsequent market is likely to consider the idea of swinging and shorting. From the current market structure, the position of $3,260 has become the focus of the market, and investors need to pay close attention to whether the gold price can reach or even fall below this point. Once it effectively breaks, the bearish trend will be further strengthened, and the market may usher in a deeper adjustment. From the 4-hour chart, the intraday rebound is under pressure from the middle track downward. At present, the K-line has returned to run below the moving average. The short-term trend is bearish. The market may further test the support near the lower track 3260. The short-term upper pressure focuses on the pressure near 3315, which is near the ma5 moving average. Above it is the pressure near the middle track currently moving down to 3338. Relying on these two pressures, there is still room for further decline in the short term, pointing to the previous day's low of 3260, so you can try to buy the bottom with a light position for the first time. On the whole, today's short-term operation strategy for gold is to focus on long positions on pullbacks and short positions on rebounds. The upper short-term focus is on the 3315-3320 line of resistance, and the lower short-term focus is on the 3265-3260 line of support. Friends must keep up with the rhythm.

Short selling profit exceeds 940pips, how to plan today?Hey! Bros, have you ever referred to my trading strategy yesterday? Yesterday I reminded my brothers that we are paying attention to the 3315-3305 target area. Now gold has fallen to our TP as scheduled. I manually closed the position near 3313 and locked in the profit in time. This transaction earned over 940 pips.
This is a considerable transaction. If you carefully refer to my trading strategy, you can also achieve the same good gains as me.
Now let’s see how to do the trading! The 3260 line below has failed to fall below in previous consecutive tests and has become a key support level for this round of market. If the gold price fails to effectively fall below 3260, it will inevitably encounter resistance and rebound again. From the market point of view, the daily trend of gold is still very likely to retrace its trend. It is currently an adjustment at the daily level, but the intensity of the adjustment has become relatively weaker! However, there are bound to be variables after the gold rise has been adjusted. Therefore, if the Asian and European lows of 3310-3300 are not broken, we can maintain the high-altitude, low-long trading strategy. Look at 3350-3370 above. If there is resistance and pressure near 3370, we can consider shorting again.
If you agree with this point of view, or you have a better idea, please leave a message in the comment area. I look forward to hearing different voices.
OANDA:XAUUSD CAPITALCOM:GOLD FOREXCOM:XAUUSD FX:XAUUSD

Gold once fell below the 3,300 mark, can it rise again?
📌 Driving Event
Spot gold (XAU/USD) once fell below the 3,300 US dollar mark, a significant correction from the previous historical high of nearly 3,500 US dollars. The market's risk appetite has increased, making the attractiveness of safe-haven assets weakened in the short term. However, repeated news about the direction of US policy and the Fed Chairman's movements may still affect the market in the medium and long term.
📊Comment Analysis
From the perspective of market sentiment, the strong rise in gold prices in the early stage mainly relied on safe-haven demand and speculation about subsequent monetary easing. However, the short-term trend has led to some profit-taking in safe-haven assets due to the recovery of the equity market. This change in sentiment reflects the current market's optimism and caution about the US macroeconomic environment: once risk appetite weakens again, gold may be supported again; if risk appetite continues to rise, gold prices may continue to retreat.
Overall, the market is in a state of repeated game, and sudden news can easily lead to large fluctuations in gold prices, and we need to continue to pay attention to the evolution of risk sentiment.
✅ Outlook for the future
Short-term outlook: In the case of short-term technical continuation signals, gold prices may remain weak, and the support around $3,300 and $3,230.00 is worth paying attention to. If volatility further increases, it is not ruled out that prices will rebound quickly or bottom out rapidly.
Medium- and long-term outlook: The upward structure at the daily level has not been completely destroyed. If the uncertainty of US policies increases or economic data is weak in the future, it will once again drive the recovery of safe-haven demand. Gold prices may still regain their upward momentum and hit $3,500 or even higher. On the contrary, if the equity market continues to strengthen, gold prices will face deeper correction pressure.
⭐️ Note: Labaron hopes that traders can properly manage their funds
- Choose a lot size that matches your funds
- Profit is 4-7% of the fund account
- Stop loss is 1-3% of the fund account

#XAUUSD 1H ANALYSISXAUUSD 1H Supply & Demand Analysis
In this analysis we're focusing on 1H time frame, for finding upcoming movement and changes in Gold prices. Price action shows a clear bearish structure following a strong upside move that was met with resistance near the 3370–3380 supply zone. After two Breaks of Structure (BOS), price is retracing toward a premium level where supply is expected to be reactivated.
Marked areas:
🔴 Supply Zone: 3370–3380 (potential short-entry zone)
🔵 Demand Zone: 3260–3290 (reversal or TP zone)
Target 1: 3315
Target 2: 3305
Target 3: 3292
This setup suggests an ideal Sell from Supply once price reacts and confirms bearish intent with internal structure shifts. Patience is key wait for price to tap the zone and show signs of weakness before entering. Confirmation is very important.
Always use stoploss for your trade.
Always use proper money management and proper risk to reward ratio.
This is just my analysis not financial advice.
#GOLD 1H Technical Analysis Expected Move.

Oscillating downward! The bearish trend is beginning to emerge!【Gold Analysis】
Interpretation of news: The current market presents a "three-legged" pattern: First, the uncertainty of the trade war. If the US insists on imposing new tariffs, the gold price may hit the $3,500 mark again; second, the suspense of the Fed's policy. Whether the May meeting will release a signal of interest rate cuts will become a key turning point; finally, the trend of the US dollar. If subsequent economic data continues to deteriorate, the US dollar index may fall below the 99 integer mark. The current gold market is caught in a fierce game of long and short factors. In terms of the trade war, the situation is not as good as Trump's remarks. The Asian giant issued a solemn statement on Thursday, emphasizing that if the US is sincere about solving the problem, all unilateral tariffs should be immediately cancelled. This statement is in sharp contrast to the "negotiation signal" recently released by the White House, making the trade outlook more confusing.
The current market sentiment is cautiously optimistic. On the one hand, Finance Minister Bensont's statement that the trade confrontation may continue has triggered a rise in risk aversion; on the other hand, the expectation that the Fed may cut interest rates has provided fundamental support for gold. This complex psychology is the main reason why the price of gold fluctuates in the range of 3260-3500 US dollars. There is one last trading day this week. Let's see how this week ends.
From the daily chart of gold, after the exaggerated reversal in the middle of the week, the current price of gold has not only lost the important support of 3350, but also formed an obvious bearish evening star in terms of shape, which means that there may be further correction space in the future. In addition, at this stage, the short-term moving averages MA5 and MA10 have been broken one after another, so it is not ruled out that they will continue to move closer to MA20, but their position is still below 3200.
From the 4-hour chart of gold, although it once fell nearly 200 US dollars from the high, the price of gold gradually stood firm yesterday and began to fluctuate and rebound. It has now returned to above 3270. However, given that the moving average group is in a sticky state and the MACD indicator is adjusted to near the 0 axis, the short-term long and short competition may become more intense. Therefore, it is recommended to keep selling high and buying low as the main strategy, which is more stable. Pay attention to the resistance of 3370-3375 on the top and the support of 3285-3280 on the bottom;
Investment strategy: short gold at 3310-3320, target 3265.

Gold Drop to 3256Hello traders! The impulse wave is down, there is a correction, and another impulse wave has started. I expect it to reach 3256.

Golden three-game winning streak, next week’s market?Gold's 1-hour moving average continues to be short, but after gold bottomed out at first-line support near 3265, gold rebounded to more than 50 US dollars. So is this rebound a reversal? Not sure yet, because the fluctuations are basically around 100 US dollars every day, and a rebound of 50 US dollars can hardly be called a reversal. The strength of next week is the key.
If gold does not rebound very strongly next week, then gold will still fluctuate and be bearish. The resistance of the 1-hour moving average above gold is near 3354, and the top of the negative line of gold on Friday is near 3352. If there is no effective breakthrough of these two positions next week, it will still be a fluctuating and bearish trend.

Buy gold, gold is expected to rebound to the 3330-3335 zoneFundamentals:
1. First, pay attention to the dynamics of Trump and the Federal Reserve;
2. Pay attention to whether the geopolitical conflicts will escalate, including the situation between India and Pakistan, Russia and Ukraine, and the situation between the United States and Iran.
Technical aspects:
Gold rebounded and tested the area near 3353, then encountered resistance and fell back. During the decline, it stopped falling near 3305, and in the short-term structure, a triple bottom structure and an arc bottom pattern were constructed around the price of "3308-3305-3308", proving that in the 3310-3305 area, there is a large amount of buying funds entering the market in the short term; in addition, before the NFP market, it is difficult for gold to form a unilateral trend, and overall gold is still in a state of shock.
Short-term trading strategy:
It is possible to consider buying gold in batches in the 3315-3305 zone; TP: 3330-33340
OANDA:XAUUSD FOREXCOM:XAUUSD FOREXCOM:XAUUSD FOREXCOM:XAUUSD TVC:DXY

GOLD | Breakout 4H Downward TrendExpecting some pullback and then Uptrend.
Possibility to short till 3000.
Then Long.

Gold 100% Trading StrategyGold prices continued to fluctuate this week. Last Thursday, gold prices stabilized and rebounded near $3,284, and remained strong after breaking through $3,300. During today's Asian session, gold prices repeatedly hit the 3,385 pressure level but failed. After retreating to around 3,369 and gaining support, they rebounded again to around 3,396. The current price faces technical repair needs, but the overall upward trend has not changed, and the probability of breaking through the $3,400 mark is still high. The support level of the retracement is focused on the Asian session low of 3369 US dollars and the 4-hour MA5 moving average of 3360 US dollars. You can arrange long orders on dips; the upper pressure focuses on the 3396-3400 line. After breaking through, you need to be alert to the pressure of the daily error band indicator of 3425-3430 US dollars. At present, you can go short at the rebound of 3395 in the short term. The general trend is still dominated by low and long.
Gold recommendation: Go short near the rebound of 3395-3400, stop loss 3405, target 3370, strict stop loss for large fluctuations
Gold operation: Go long near the retracement of 3370-3375, stop loss 3362, target 3400, strict stop loss for large fluctuations

Gold is trending bearishGold has fallen a lot since it opened. The rise and fall of gold is not based on technical factors, but more on fundamentals and news. We are bearish on gold at the moment. If it continues to fall, the target will be 3230. Gold operations are mainly short-selling on rebounds, supplemented by long-selling on pullbacks. Pay attention to the 3300 resistance on the top and the 3260-support on the bottom.

Gold price remains volatile at 3,300, short-term operation
💹Fundamental analysis
Fed officials have hinted at an openness to possible rate cuts, a stance that could limit further gains in the U.S. dollar (USD) and provide support for non-yielding gold prices. In addition, growing concerns about the economic impact of President Donald Trump's aggressive tariff measures, coupled with ongoing geopolitical instability, continue to enhance the appeal of safe-haven assets. In this environment, the overall trend of gold remains biased to the upside, prompting traders to remain cautious when considering bold shorts.
📊Comment Analysis
Continue to consolidate, the price range fluctuates around 3300
💰Strategy Package
Long position:
Actively participate at 3282 points, profit target around 3320 points
Short position:
Actively participate around 3320 points, profit target around 3300 points
⭐️ Note: Labaron hopes that traders can properly manage their funds
- Choose the number of lots that matches your funds
- Profit is 5-10% of the fund account
- Stop loss is 1-3% of the fund account
