GOLD - at his current support? whats next ???#GOLD. market perfectly placed his current supporting region that is around 3448-49 to 3452-53
keep close that region because only that region can create agian buying volume.
NOTE: we will cut n reverse below 3449 on confirmation.
good luck
trade wisely
GOLD trade ideas

XAUUSD 4H Timeframe – Technical & Fundamental Analysis XAUUSD 4H Timeframe – Technical & Fundamental Analysis
Gold continues to shine during times of uncertainty. Whether it’s global conflict, inflation fears, recession talks, or market turbulence, investors tend to turn to gold as a hedge against risk.
However, there is still room for short-term exhaustion. On the 4-hour chart, we observed a sharp decline from $3,500 to $3,330, primarily driven by recent political developments in the United States. President Donald Trump retracted his threat to remove Federal Reserve Chair Jerome Powell and expressed optimism regarding a potential trade agreement with China. These actions eased market fears and reduced gold's appeal as a safe-haven asset, causing a temporary dip in demand and price.
📉 Technical Outlook:
On the 4H chart, gold hit an all-time high of $3,500 yesterday.
We’ve identified a Three Black Crows candlestick pattern, a strong signal of a potential reversal from a bullish to a bearish trend—suggesting that downward momentum may follow.
A minor key support level is seen at $3,340. A breakout below this level could:
Trigger pending sell orders
Initiate the accumulation phase in the liquidity zone
If the price breaks $3,290, it may confirm a Change of Character (CHOCH)—a strong sign of a bearish shift.
🧠 Trade Plan: After accumulation and liquidity grab, we wait for a clean breakout to confirm our setup.
📌 Sell Stop Entry: $3,317.20
📌 Stop Loss: $3,386.20
📌 Take Profit: $3,167.80
📌 Disclaimer:
This is not financial advice. As always, wait for proper confirmation before executing trades. Manage your risk wisely and trade what you see, not what you feel.

Gold - XAUUSD- Symmetrical TriangleGold consolidates within a symmetrical triangle after a strong bullish rally and a sharp correction. The price is nearing the triangle's apex, suggesting a major breakout or breakdown. The structure shows sellers consistently pushing lower highs, while buyers are holding the same support zone around 3260–3270. This indicates compression, with volatility likely to expand soon.
Bullish Breakout: A clean breakout above the descending trendline and retest could trigger a rally toward 3360, 3420, and even 3480.
Bearish Breakdown: A failure to hold the horizontal support could lead to a sharp drop toward 3190, 3100, and potentially 3000.

XAUUSD (GOLD) BULLISH NOW(READ CAPTION)Hello Guys Here is my Gold Signal Update Share your Thoughts About it.
Gold Will Continue Its Bullish Trend Again I can Expect if Gold Breaks Resistance Area Of 3332-33 It can Further Move to 3380-86 .
TECHNICAL OUTLOOK:
Support Area Identified At 3266.
Resistance Area Identified At 3332-33
Technical Targets Area : 3380-88
Note : This Analysis is For Education Purpose Only.

GOLD → Gold Market Forecast and AnalysisFor most of the period from 2025 to now, gold prices have risen almost continuously, hitting new all-time highs. Since October 2022, gold prices have almost doubled, rising by more than 25% in 2025 alone, reaching a new all-time high of $3,500 per ounce on April 22. The $4,000 price level, once considered untouchable, is now openly discussed in trading halls around the world.
The easing of global tensions, especially between the United States and China or in Eastern Europe, could significantly reduce safe-haven demand.
While this is not the base case for 2025, it is still an unexpected risk that traders must consider. In fact, gold prices have retreated from recent highs after US President Trump hinted that tariffs on China might be reduced.
The sharp rise in gold prices increases the possibility of a correction. If the upward momentum slows, profit-taking could trigger a rapid and violent sell-off. As with any parabolic rise, volatility is inevitable; prices often experience a short-term downward trend before setting new all-time highs. Traders with short-term strategies should be aware of such price declines and practice risk management: avoid large trades, set stop-losses, and diversify their portfolios.
Quaid wants to say:
Opportunities always come to those who dare to act. Be bold in the gold market, and the next winner will be you, my friend.

Gold is down 100 points, but it still remains high and short.Technically speaking:
① Yesterday's daily line hit a high and fell back to close with a hanging neck line with a long upper shadow, which represents a short-term peak signal. Today's opening opened low and rebounded to repair the gap, which can determine the bottom support in the short term. Therefore, today's range has become a large range of 3313-3500.
From the daily Fibonacci retracement extension line, the current support is around 3291, that is, the range of 3291-3371, and the middle 0.236 is located at 3370.
②The 4-hour indicator macd is dead cross at a high level and runs with large volume, and the smart indicator sto is running near oversold, which means that the 4-hour market is still volatile and weak. In the short term, pay attention to the middle track and the moving average MA5 and MA10 corresponding to the 3403-3358-3404 line, and the short-term moving average MA30 corresponds to the 3350 line. From the 4-hour perspective, the current range is 3291-3371.
③ The current MACD of the hourly line is dead cross with shrinking volume, and the dynamic indicator STO is hooked upward, which represents the rebound trend of the hourly line. At present, we focus on the MA60 moving average, the middle track and the MA30 moving average, which currently correspond to the 3397-3354-3405 line, but will gradually move down over time.
In summary: short-selling in the area near the upper pressure of 3321-3351-3371, and maintaining high altitude as the main theme
Summary: In the short term, the high altitude callback is the main focus, and the key support level is arranged in batches for long orders to follow the long-term trend.

XAU/USD.gold 4h chart pattrenIt looks like me updating your gold trading strategy with an entry point at 3300, and two target points at 3400 and 3500. Here's a breakdown:
1. Entry Point: Buy gold at 3300.
2. First Target (3400): This would be your first profit-taking level. A price increase from 3305 to 3400 represents a potential profit of 95 points.
3. Second Target (3500): This is your more aggressive target. If gold reaches 3500, you'd be looking at a profit of 195 points from your entry point.
Key Considerations:
Stop Loss: Consider placing a stop loss below 3300 to limit any potential downside risk if the price moves against your position.
Market Factors: Keep an eye on factors like economic data, inflation, interest rates, and geopolitical developments, as these can affect gold prices.
Timeframe: Be clear about your investment horizon. Are you trading in the short term or holding longer?
Let me know if you'd like help with anything like stop-loss strategies or a deeper dive into market conditions.

XAUUSD quick BUY tradeHi fellow traders, XAUUSD will be ready to make a move higher from the blue box after completing the correction. Target the 3334.67 level. Good luck and trade safe!

GOLD BUY The overheated Gold rally looks to be in need of some further cooling. Traders look to be buying into the rumors that a trade deal between the US and China could come very soon, despite China coming out contradicting those rumors. The risk here could be that markets are misinterpreting the US semantic on whether they are “talking” or “negotiating”, and that no deal is done anytime soon with possibly a revisit to $3,500
Looking at technical levels, the daily Pivot Point at $3,335 is the first upside and intraday level that needs to be reclaimed. The R1 intraday resistance saw a small attempt for a test in very early opening this Friday, coming in around $3,381. Further up, Gold price could extend the rally to the R2 resistance at $3,414, surpassing the $3,400 handle.

Is Black Friday an up or down?From the current market, gold continued to fall on Wednesday. This wave peaked at 3500 and hit a low of 3260 on Wednesday. It fell by 240 US dollars in two trading days this week. The force is very strong and the trend is very panic. Adjustment is an opportunity to go long, so once the adjustment is over, you can start to go long and bullish. At the opening of Thursday morning, gold rose directly to 3368, and the bulls have recovered 100 US dollars of lost ground. It is also this wave of rise that confirms that the adjustment of this cycle will end at 3260, the mid-term decline is over, and the market will follow the general trend to rise. If you have arranged a long order on Wednesday, you can hold it firmly. This cycle is expected to rise to 3386-3420. If you have not arranged a long order, you still have a chance to enter the market today.In terms of short-term gold operation ideas, it is recommended to focus on buying on pullbacks and shorting on rebounds. The short-term focus on the upper side is the 3380-3400 line of resistance, and the short-term focus on the lower side is the 3340-3320 line of support.

GOLD
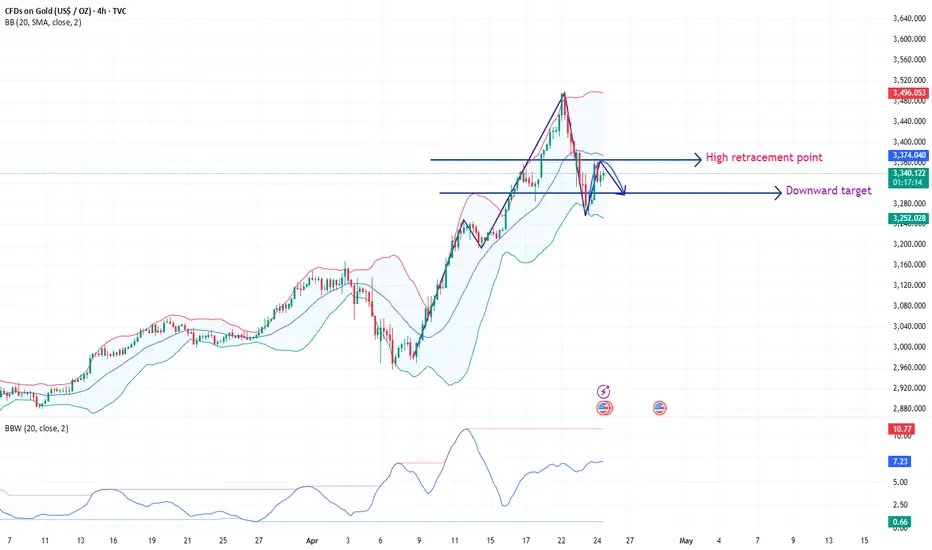
This Gold (XAU/USD) outlines a bullish retracement setup, targeting a potential move toward the order block around 3,373.348. After bouncing from the support level near3,280, price is consolidating in a tight range and showing signs of upward momentum.
The move aims to revisit the order block, which previously acted as a breakdown zone. If price successfully reaches and reacts from this level, it may also attempt to fill the nearby Fair Value Gap (FVG) above.
Key Technical Zones:
- Support Level: Around 3,280, where buyers stepped in.
- Order Block: Immediate resistance and primary target at3,373.
- FVG Zone Above: Suggests a potential bullish continuation if broken.
Short-Term Target: 3,373.348
If momentum holds, a breakout above the order block may expose price to further upside toward3,440 and beyond.
Traders can watch for breakout confirmation or signs of rejection at the order block for the next directional cue.

Gold short-term trading looks at retracements
Don't make things difficult for yourself, don't waste the time, don't expect any sudden surprises, just hope there will be no sudden troubles, and that will be good enough.
Today, we will focus on the suppression of 3361-67. If this level is not broken, it may weaken and fall. Of course, if it breaks and rises, the price may still be strong. Therefore, short-term operations around this range today can be carried out with a stop loss of 3175 and a take-profit of 3317/3300. Only when it falls below can we further look at 3280-3250
Gold short-term trading: short near 3365, stop loss 3375, take profit 3317/3300
Hello traders, if you have better ideas and suggestions, welcome to leave a message below, I will be very happy
US policy news triggers huge shock in gold Analytical StrategyThe short-term 4-hour middle track 3380 line has been lost, becoming a key counter-pressure point. As long as the price cannot stand on this position again, it will maintain a downward correction trend. If it falls below 3292, the gains and losses of the 66-day moving average 3260 will be concerned. The 1-hour level K line is under pressure from ma10 and ma5 and continues to fall. After last night's consolidation and pull-up, the current K line has re-run above ma10, and at the same time, macd forms a golden cross below the zero axis. This wave of 200 US dollars of rapid exploration has almost corrected most of the overbought situation. If the price continues to fall, or with the help of bottom divergence, it will slowly brew a short-term bottom. Today's gold rebound reminds that attention should be paid to the resistance below 3340, and the limit is below 3356. If it is not under pressure, it will still be bearish adjustment. Strong support is at 3260 or 3245. After the position stabilizes, it will begin to consider bottom-fishing. For today's short-term operation of gold, it is recommended to focus on rebound shorting and supplemented by callback longing. The short-term focus on the upper side is 3350-3370 first-line resistance, and the short-term focus on the lower side is 3300-3280 first-line support.

Gold profit taking continuesThe gold market opened at 3337.5 yesterday due to the profit-taking of the previous day. After the market fell back to 3315.6, the market rose strongly to fill the gap. The daily line reached a high of 3386.7 and then fell strongly. The daily line reached a low of 3259.6 and then the market consolidated at the end of the day. The daily line finally closed at 3287.9 and the market closed with a long upper shadow line. After this pattern ended, today's market continued to be empty. In terms of points, the short positions at 3496, 3468 and 3442 the day before were reduced and the stop loss was followed up at 3400.
SELL:3340 45 50 Stop loss: 55
TP1:3330
TP2:3320
TP3:3300

Quick Trading Idea - GoldGood Afternoon,
Here is a quick trade idea that I will be taking advantage of.
Enjoy!

XAUSUD LONG 1-10RRXAUSUD LONG 1-10RR. Look a this beautiful trade Im expecting for Gold. Lets see if we get those 10 . Have a great trading day.

SELL GOLDBearish flag on XAUUSD, I would like to see price reverse from here towards the support at 3292. I doubt that support will hold but let us see how price reacts here

Sell@3300Currently, the level of 3300 is demonstrating rather strong resistance. We can initiate short positions at this point.
⚡️⚡️⚡️ XAUUSD ⚡️⚡️⚡️
🚀 Sell@3300
🚀 TP 3285
Accurate signals are updated every day 📈 If you encounter any problems during trading, these signals can serve as your reliable guide 🧭 Feel free to refer to them! I sincerely hope they'll be of great help to you 🌟

Gold Potential Short to Form the NecklineGold on Larger Timeframe has formed a H&S after the massive bull run possible major sell off incoming
Short enetry entered due to LTF H&S Price below key level
looking to see the formation of the neckline
and see if price will break down further

4/28 Gold Trading SignalsLast Friday, gold retested the 3260 support zone for the second time. After confirming support, prices began to climb steadily, and our low-entry long positions have already delivered impressive returns.
From a technical perspective, the broader structure still resembles a head-and-shoulders pattern, but recently, a double-bottom pattern has formed around the right shoulder, signaling an intense battle between bulls and bears—mainly influenced by geopolitical tensions.
Here, I would like to propose a bold yet speculative thought:
Could the current turmoil possibly lead to a regime change for Trump, or trigger massive nationwide protests? If such scenarios unfold, it would likely be extremely bullish for gold, potentially pushing prices toward 4000.
On the other hand, if Trump softens his trade policies under pressure, it would be bearish for gold, making a decline toward 2800 highly probable.
Of course, this is purely my personal speculation, and I don't claim deep expertise in international politics.
Focusing back on the technicals:
The 3260 support is critical.
A breakdown could see prices moving toward the 3245–3213 range, or even lower toward around 3190.
Any rebound from there should be carefully watched near the 3260 resistance; failure to break above would suggest a potential further drop toward 3153–3137.
If the double-bottom pattern holds firmly, a return to above 3400 this week is highly likely.
🔥 Today's Trading Plan:
Sell zone: 3407–3418
Buy zone: 3273–3241
Scalping zones: 3288–3323 / 3386–3344
Manage your positions wisely and stay flexible!

Key Buying Levels For Monday Use Proper Money Management !
This trade is based on advanced Concept
Follow for more !
Take only 1% Risk on this Trade

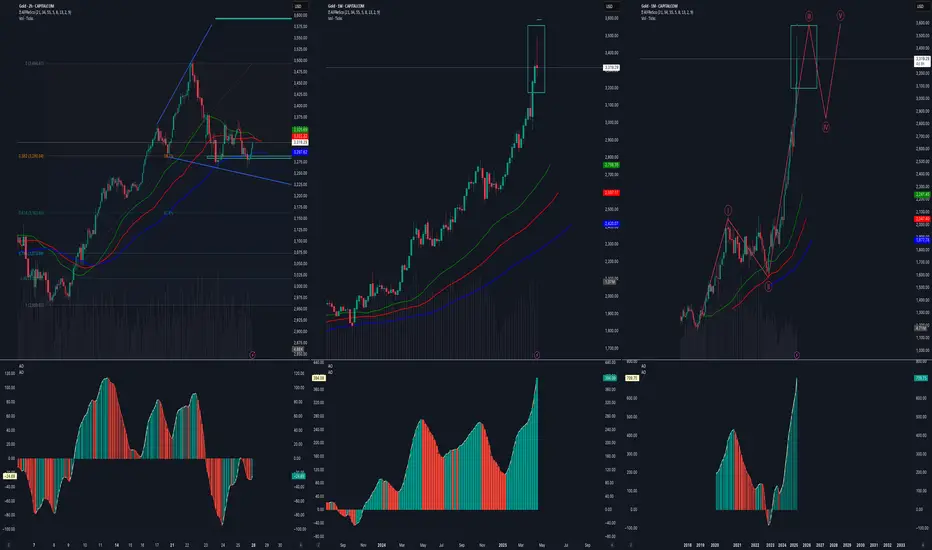
GOLD Analysis (April 26, 2025) - 2 hours, weekly & MonthlyChart 1: 2-Hour Chart (Short-Term View)
Pattern Observed:
Clear Elliott Wave structure identified.
Wave ①, ②, ③, and ④ are completed.
Currently in Wave ⑤ (ongoing impulsive up move).
Current Setup:
Wave ⑤ has started and appears to be very impulsive.
The target for Wave ⑤ is near $3600 zone.
Expect a sharp upside move toward $3600 in coming sessions (possibly within next 1–2 weeks).
Important Note:
Since Wave ⑤ is impulsive, price may move very fast with little retracements.
Strategy:
Short-term bullish until $3600 is reached.
After completing ⑤, expect a strong and sharp correction downward.
Chart 2: Weekly Chart (Medium-Term View)
Pattern Observed:
Weekly candle has formed a long-legged inverted hammer, almost like a high wave spinning top.
This is a warning sign indicating strong indecision and possible trend exhaustion.
Interpretation:
Weekly structure is signaling that GOLD is losing strength at higher levels.
There is hesitation for further continuation of the uptrend.
After a small last push (likely completing the final Wave ⑤), there are high chances of a bigger retracement.
Strategy:
Watch closely how next week’s candle forms.
If next week closes weakly or forms a bearish pattern (like bearish engulfing), expect bigger fall.
Chart 3: Monthly Chart (Long-Term View)
Pattern Observed:
Monthly chart shows momentum loss at top.
AO (Awesome Oscillator) indicator is flattening after a massive upmove.
Momentum divergence starting to appear (price made higher high, AO showing flattening/slightly diverging).
Interpretation:
GOLD is still strong, but momentum is clearly reducing at the top.
If GOLD touches $3600 next month and fails to sustain, a big red monthly candle can form.
This could mark the start of a medium-term bearish phase (several months correction).
Strategy:
Next month (May 2025) is extremely critical for GOLD’s major trend decision.
If a red candle forms in May after touching $3600, it could trigger a multi-month downward correction.
Conclusion:
In the short term (next few days), GOLD likely continues to rally towards $3600.
Next 2–3 weeks are critical — observe if reversal signs appear near $3600.
May 2025 is very important:
A monthly red candle after touching $3600 can confirm a bigger downward correction.
If correction starts, it will likely be sharp and deep, matching the intensity of the 5th wave up.
Disclaimer:
This analysis is for educational purposes only and not a financial advice. Trading involves risk. Please consult your financial advisor before making trading decisions.
XAUUSD SUPER LONGI don't know just get angry and go up to the lane In the end. use your own common sense to decide
