XAUUSD SUPER LONGI don't know just get angry and go up to the lane In the end. use your own common sense to decide
GOLD trade ideas

Gold. Further downside is possible.Hey traders and investors!
Gold price bounced from a contextual level 3283 — the correction low within the dominant buyer’s initiative on the daily timeframe.
Further downside is possible. Watching levels 3381 and 3283.
The structure in this post is based on the logic of Initiative Analysis (IA).

How to break through the gold shock patternOperation suggestionsTechnical analysis of gold: The current gold price is in a stalemate stage of long-short game. On the one hand, the path of the Fed's easing policy has been basically clear, and the US dollar is facing correction pressure; on the other hand, the stable global risk sentiment and the strong performance of the stock market have weakened the attractiveness of gold as a safe-haven tool. The repeated signals of global trade negotiations have also made the market direction unclear. From a technical point of view, gold has received support after the correction to the 26.3% Fibonacci retracement level near 3317 this week, and has returned to above $3,300 in the short term. The upper resistance focuses on the position of 3380. Once it breaks through, it will open up the space leading to the 3400 mark.
From the daily chart of gold, yesterday's gold price fell sharply and recorded a large real body Yin line K-line pattern. The peak pattern of the previous price high is more obvious, suggesting that the upper pressure effect is strong. The MACD indicator double line began to turn downward, increasing the risk of further correction in the short term. However, the MA5 and MA10 moving averages have not turned downward yet. You can pay attention to the support and defense of the moving average. From the 4-hour gold chart, the gold price has been fluctuating and falling since it came under pressure at the 3500 level. The current price has fallen back to the 3260 level, with a short-term decline of 240 US dollars. Although there has been a rebound during the day, the upward trend has been destroyed. The MACD indicator has issued a dead cross signal, suggesting that the correction trend may have started.
Gold fell after rising in the Asian session, and fell below the support levels of 3351 and 3330. Now the market rebounded near 3314, which is also in line with our analysis of the long and short trends. In the big trend, the gold rally did not exceed 3380, so there is still a downward demand, that is to say, it can only be regarded as a rebound during the decline. In the short term, this wave of gains stopped at 3367. Now it broke through 3351 and pierced 3316 to rebound. The main focus on the upper side is the support-to-resistance level of 51, followed by 3342. Specifically, you can wait for the area near 3345 to go short and see the gold price break the previous rebound low of 3314 to 3300. If it breaks down effectively, you can move the protection loss down to see the position of the rebound turning point of 3283 and 3260. On the whole, the short-term operation strategy of gold today is to short on rebound and long on callback. The short-term focus on the upper side is 3350-3370 resistance, and the short-term focus on the lower side is 3300-3280 support.

war to consolidate resistance or build supportAs you can see, the trend is in a powerful descending zone as the trend below the midfield is a powerful decline but now the trend is moving towards 3370 to 3390.You can buy in an important area by seeing the purchase signal to these prices

XAUUSD FALLING WEDGE PATTERNI Created This XAUUSD Chart Analysis In 30-M Tf
Entry: BUY from 3325
Support zone : 3295
Target Will Be : 3380
NOTE : XAUUSD MADE FALLING WEDGE PATTERN IN 30-M AND THIS CHART IS BASED ON PERSONAL ANALYSIS FOR LEARNING PURPOSES. PLEASE USE PROPER RISK MANAGEMENT

Gold is still on the bearishIt can be seen that the price of gold is currently in minor support, if this support is broken, the potential for decline will still be far away.
SL: 3325 (200 pips)
TP: 3265

Gold shocks pull long and short without continuation!From the daily line, the K-line closed with a hammer-shaped small positive line with a long lower shadow, showing a trend of falling back from a high position, which intensified the change of the top K-line pattern. At present, the gold price is suppressed by the double top of 3370 above and supported by the multiple bottoms of 3260 below. The market outlook mainly focuses on the shock adjustment of this range. The middle track of the Bollinger band at the hourly level is near 3322, which can be used as a watershed of strength and weakness. After the gold price falls below the middle track of the Bollinger band, it is likely to go to the lower track of the Bollinger band, and it is more likely to test the shock bottom position of 3260. In terms of the short-term operation of gold, it is recommended to mainly short on rebounds and supplemented by long on pullbacks. The short-term focus on the upper side is 3329-3335 resistance, and the short-term focus on the lower side is 3265-3260 support.

XAUUSDWe see two scenarios in gold, we see it now in the retracement zone, and often when it is in the retracement zone, liquidity is withdrawn. If liquidity is withdrawn upward, we wait for the selling area at 3477 and 3505, and if liquidity is withdrawn downward, we wait for the purchase zone at the price of 3195 and 3161. Note: If a political decision or a sudden political event occurs, it may change the course, or we may have another analysis or other theories.

GOLD Gold (XAU/USD) shows price action ranging between a strong support level and a visible order block above. Price recently tested the support zone near 3,260.000, showing potential signs of a bullish reaction.
The chart highlights a possible upward move toward the Fair Value Gap (FVG) zone, targeting around 3325.626.
Key Technical Points:
- Support Level: Price bounced from the 3,260.000 zone.
- FVG Area: Gap available for price to fill up toward 3325.626.
- Order Block: Major resistance near the 3,440.000 region.
- Structure: A potential bullish short-term recovery setup.
Target Projection: $3325.626
If buyers maintain control around the current support, we could see a move into the FVG before facing major resistance at the order block above. Watch closely for bullish confirmations or possible rejections around the FVG area.

Tariffs have not eased. How will gold trend in the future?Spot gold fell nearly 1% on Friday to close at 3316.26. Earlier this week, gold rose to a record high of 3500. After Trump's statement on tariffs eased, the market rose to 3500 and investors chose to close their long positions. The lowest gold price this week fell to around 3260.
At the moment when tariffs are deadlocked, any remarks made by Trump on tariffs have not reduced the risk of the market, but increased the uncertainty of the market. Next week, the gold market will usher in the World Gold Council's first quarter "Gold Demand Trends" report. In addition, next week's gathering of Trump's 100th day in office may become an important window for gold prices to choose to test the 3500 mark again or continue to fall from 3300.
This week, the international gold price as a whole showed a high and then fell, with the opening price at $3332.96, the highest price at $3499.92, the lowest price at $3260.2, and the closing price at $3316.2. After such a pattern appears, it indicates that the gold cycle will face violent fluctuations.
Quide's analysis:
If international news helps short selling, it is possible for gold to fall to 3100 or fall below 3000. Therefore, we should remain vigilant next week and pay close attention to the geopolitical situation and news such as tariffs, so as to make a buying or selling decision for next week.
At present, the Bollinger Bands continue to close, and the short-term market continues to maintain a range consolidation until the Bollinger Bands reopen and choose a new direction.
Before the upward and downward ranges are broken, the intraday short-term operation adopts the range high-altitude low-multiple operation.
There is currently no international news and comments that can analyze the trading signals for next week; Quide will pay attention to news and comments that may affect the trend of the gold market at any time, so as to bring analysis and strategies to everyone at any time.
Every calm analysis by Quaid is a step towards success. In the gold market, please trust Quaid's professional analysis. It can help you stand at the top of the gold trading market.

Interpretation of ideas after gold opensTechnical pattern: This week, gold closed in a "shooting star" pattern, which is a common peak signal, indicating that the price of gold may face a correction or decline.
Influence of news: This week, affected by Trump's tariffs and dismissal of Powell, gold first hit a record high of 3500 due to its safe-haven properties. Then Trump's remarks changed, and the price of gold plunged from the high point to around 3260. Overall, it ended in a volatile situation under the uncertainty of tariffs, Powell's stay and interest rate cuts. If there are no new safe-haven factors in the market news, there is room for further decline in the price of gold.
Short-term trend analysis
Four-hour level: After the safe-haven, the price of gold rebounded at the low point of 3260, but was unable to continue near 3370. It is believed that the high-level selling repair and low-level buying intervention have affected it. The opening of the gold price next week may continue to fall.
Hourly level: Since the decline in the price of gold, the rebound strength has been insufficient. It rebounded twice near 3260 below, and the overall center of gravity was downward before crossing 3380. Next week, pay attention to the 3330-3346 range to determine the nature of the rebound at the end of this week. At the same time, pay attention to whether 3260 can be broken. If there is a break, you can look down to 3221.
Operational suggestions: Overall, the overall idea for next week will continue to be bearish. Pay attention to the resistance of the 3330-3346 range on the top, and try to go short if it is touched; the initial support below is 3260, and the bearish trend can continue to 3221-3219 if it breaks.
Suggestions for being stuck at high positions: For investors who are standing guard at high positions, if they can withstand the pullback of gold prices, they can continue to hold and wait for the return of their capital; if not, it is recommended to recognize the loss and leave the market first, and then enter the market after the gold price has adjusted to the right level.

Gold is under pressure and falls again Short again on rebound!Gold rebounded weakly during the European session, and fell twice during the US session, with the lowest price dropping to 3265. However, even though it is extremely weak at present, it is not recommended to blindly chase the short position. The support below is 3260, which is the previous low point and is close to the volatility limit. Instead, you can try short-term long positions with a light position. The short-term pressure above is maintained at 3306, and the breakthrough will gradually reach 3315 and 3328!
Operational suggestions: Gold is short near 3310-20, and look at 3300 and 3280! Long positions can be made if the support below 3260 is not broken!

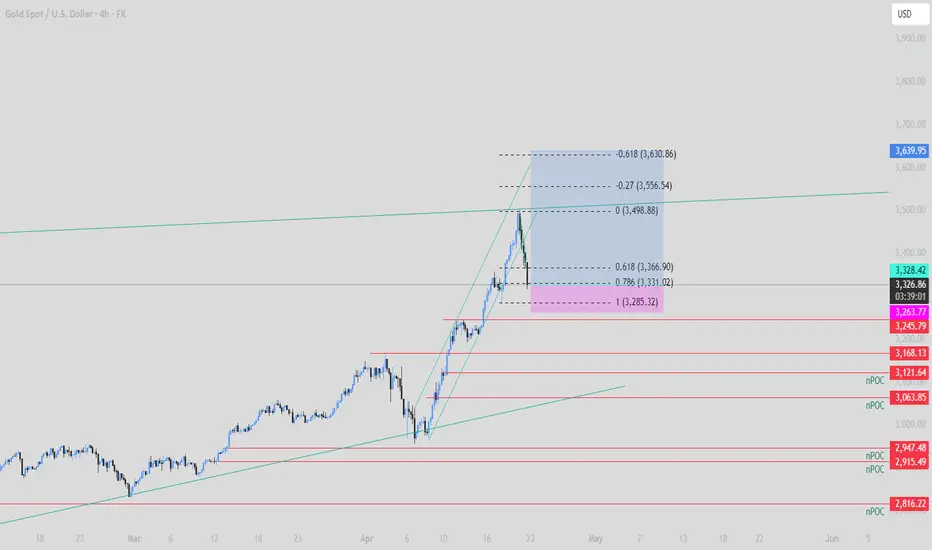
Gold Analysis The recent gold rally has achieved all anticipated price targets in a remarkably short timeframe, subsequently attracting profit-taking activity. These sellers are currently dominating price action, creating what appears to be a potential head and shoulders pattern with the head at $3,500 and neckline at $3,280. Should the 4-hour candle close below this neckline, it would confirm the pattern formation, suggesting a downside target of $3,080. The RSI indicator further supports this bearish outlook, with a clear negative divergence forming over the past three days while remaining below the 50 level
SAXO:XAUUSD AMEX:GLD AMEX:IAU COMEX:GC1!

GOLD: Strong Bearish Sentiment! Short!
My dear friends,
Today we will analyse GOLD together☺️
The market is at an inflection zone and price has now reached an area around 3,270.77 where previous reversals or breakouts have occurred.And a price reaction that we are seeing on multiple timeframes here could signal the next move down so we can enter on confirmation, and target the next key level of 3,242.15..Stop-loss is recommended beyond the inflection zone.
❤️Sending you lots of Love and Hugs❤️

Gold INTRADAY corrective pullback supported at 3227Gold prices slipped on Friday and are on track to end the week lower.
China denied any ongoing trade negotiations with the US, contradicting former President Trump's claims.
Despite this, markets are rallying on deal speculation, with traders rotating out of Gold and into equities.
Key Support and Resistance Levels
Resistance Level 1: 3392
Resistance Level 2: 3457
Resistance Level 3: 3500
Support Level 1: 3227
Support Level 2: 3173
Support Level 3: 3130
This communication is for informational purposes only and should not be viewed as any form of recommendation as to a particular course of action or as investment advice. It is not intended as an offer or solicitation for the purchase or sale of any financial instrument or as an official confirmation of any transaction. Opinions, estimates and assumptions expressed herein are made as of the date of this communication and are subject to change without notice. This communication has been prepared based upon information, including market prices, data and other information, believed to be reliable; however, Trade Nation does not warrant its completeness or accuracy. All market prices and market data contained in or attached to this communication are indicative and subject to change without notice.

Is XAUUSD bullish or bearish today? I'm bearish on GOLD (XAUUSD) today!
Logic: GOLD recently hit its historic high. After that retracing but not sustaining at any point just because of the big players booking profits, it's common in GOLD .
Now, GOLD is reversing, and I can see it formed a bearish flag pattern today in the 15- or 5-minute time frame, as you can see in my chart drawing. So, I'm bearish at least till the 3270 level .
Thank you

How will gold go? Analysis of the technical outlook for gold priSpot gold is basically stable after a sharp rise in the early Asian session, and the current price of gold is around $3,325/oz.
Quaid believes that gold prices may show a consolidation trend in the next few days, but we are in a bull market and any significant decline will be taken over by buyers.
From a technical perspective, gold prices rose in the morning, but they are still in a range. Technical indicators changed direction and moved higher within positive levels, gaining new momentum and supporting further gains in gold prices. At the same time, gold prices continue to develop above all of its moving averages, and the bullish 20-day simple moving average is currently around $3,182/oz, well above the bullish 100-day and 200-day moving averages.
The 4-hour chart shows that gold prices are consolidating easily. Gold prices continue to trade below the mildly bearish 20-period SMA, which provides dynamic resistance near $3,370/oz, but the longer-term moving averages maintain a bullish slope at a level far below the current gold price. Finally, technical indicators remain directionless within negative levels. If gold prices break through the above 20-period SMA resistance, it should open the door for a more sustainable rebound in gold prices.
Quaid comprehensively analyzes important support and resistance levels:
Support: $3314/oz; $3301/oz; $3288/oz
Resistance: $3358/oz; $3370/oz

Gold fluctuates in the short term, but you can still make a prof
Gold is still fluctuating. Due to the pressure from the upper moving average, don't chase high for the time being. Wait for gold to pull back and you can still continue to short.
During the US trading time today, short-term gold bulls have begun to be powerless, so when gold pulls back to around 3350, shorts can enter the market at any time, and gold still has the opportunity to adjust. Gold continues to wait and see the adjustment market in the short term, and pay attention to trading signals in time.
Keep an eye on the price and participate well. Grasp the rhythm of gold pullback short-selling transactions. You will find that this kind of fluctuation is much more fun than the big fluctuation.
📊Comment analysis
Gold is currently just a rebound. If there is no special risk-averse news for gold, it will still be difficult to go up directly. At least it will fluctuate first, and it is still a bearish fluctuation now.
💰Strategy Package
Short position:
Actively participate at 3350 points, profit target is around 3310 points
⭐️ Note: Labaron hopes that traders can properly manage their funds
- Choose the number of lots that matches your funds
- Profit is 4-7% of the capital account
- Stop loss is 1-3% of the capital account

Gold Once again possible for Going to 3369 Gold Once again possible for Going to 3369-3380-3390 sl 3320 cmp. 3328

XAUSUD COMPRA I'm entering XAUSU on lower timeframes (scalping/intraday).
Be careful — this pair can move hard with high volatility.
💡 Manage your risk, adjust your lot size properly, and always use a stop loss.
Discipline above all! 🔥💰

Gold long I think she will continue to impress everyone .
This was just another dump.
Let the fun begin again.
Gold is in a long-short tug-of-war, waiting for a breakGold enters the range fluctuation in the 4-hour chart. From the chart, we can see that the trend is triangular, with high points gradually moving down and low points gradually moving up. When the space cannot be expanded, there will be a breakthrough in one direction. There will be news this week. Therefore, short-term trading still depends on highs and lows. The daily chart MACD begins to cross downward. The daily chart is horizontally consolidated and paused, unable to set a new high, and there is still a need for short-term correction. In summary, I suggest that short-term operations should focus on long and short positions, supplemented by long positions.

Analysis of the latest gold market trend on April 29:
1. Current market structure: wide range of fluctuations, direction to be broken
Key range: 3260-3338 (recently tested the upper and lower edges many times, no effective breakthrough).
Fierce long-short game:
3260-3270 (multiple bottoming rebounds, strong support area).
3336-3340 (recent high resistance, breakthrough opens up the upward space).
3370 (mid-term long-short boundary, head and shoulders right shoulder pressure).
2. Technical signal analysis
4-hour chart shock pattern:
If it stands firm at 3336 → it may continue to rebound and test 3352-3370.
If it falls back under pressure at 3336 → look down to 3278-3260, and if it falls below, it will open the downward space to 3225-3200.
Key patterns:
Head and shoulders top prototype: If the right shoulder is formed at 3370, the risk of medium-term shorting will increase.
Fibonacci support: 3225 (50% retracement), 3200 (psychological barrier).
3. Today's operation strategy
(Use 3336 as the dividing line, flexibly switch between long and short positions)
Short opportunity (main idea)
Entry conditions:
Price stagnation at 3336-3340 (such as reversal signals such as long upper shadow and engulfment on the K-line).
Target: 3278 → 3265-3260 (add positions after breaking through to see 3225).
Stop loss: above 3352 (to prevent false breakthroughs).
Bull opportunity (auxiliary idea)
Entry conditions:
Retracing to 3270-3260 and stabilizing (quick rebound or lower shadow confirmation).
Target: 3336 → 3352 (reduce position after breakthrough).
Stop loss: below 3255 (strict risk control).
4. Key risk reminder
Fake breakthrough risk: The recent volatility is drastic, and it is necessary to observe whether the breakthrough of 3336 and 3260 is accompanied by large volume.
The dollar and the news: Federal Reserve policy expectations and geopolitical situations may cause sudden fluctuations.
5. Summary
Volatile market → Sell high and buy low, strictly stop loss.
Breakthrough strategy:
Break above 3336 → Go long on the retracement, look at 3370.
Break below 3260 → Go short on the rebound, look at 3225-3200.
