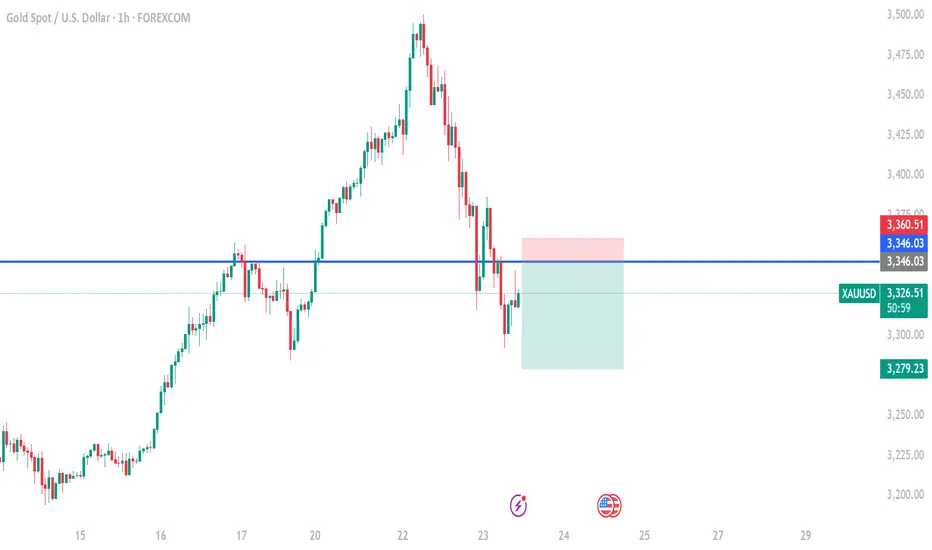
Gold Rejection Zone in Play – Bears Take the Lead!After testing a key resistance zone around 3,328–3,334, gold saw a sharp rejection, confirming bearish control. Price retraced aggressively, reaching the 3,293 level before consolidating. Short setup played out with clean risk-to-reward. Watching for a potential continuation or reversal at this consolidation zone. Stay sharp!
GOLD trade ideas

Gold buy ideaWe see gold creating a strong support and a reversal pattern for a possible bullish momentu.
With proper risk management we can have our stop loss at 3285

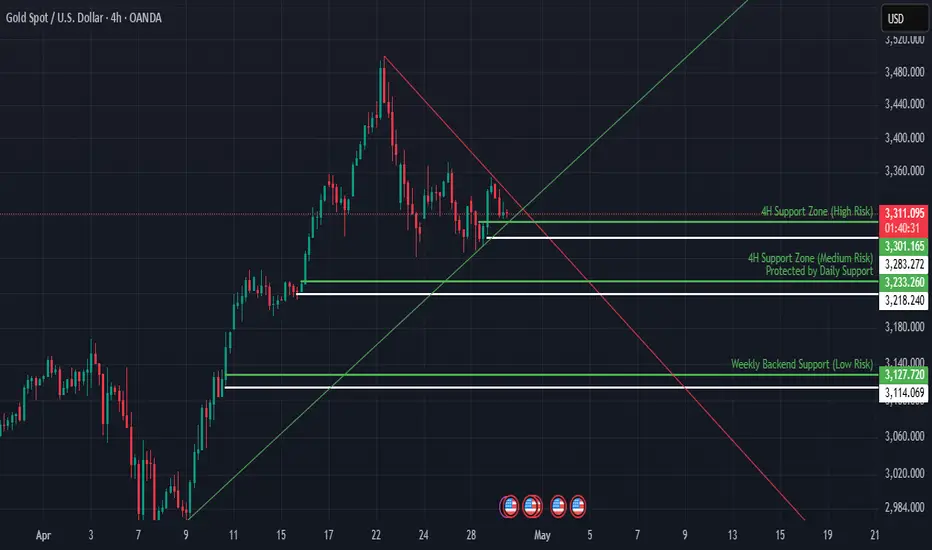
Gold 4H – Compression Builds | Key Zones in FocusGold is consolidating beneath descending trendline resistance, compressing within a defined structure on the 4H chart. As volatility tightens, price is approaching a critical decision point. This post outlines the key actionable zones, ranked by risk, and highlights the stop-loss levels to manage exposure.
Technical Analysis:
Price action remains trapped within a descending triangle, marked by lower highs and flat support. Buyers have shown interest around the $3,313–$3,283 range, while broader structure still favors caution until a clean breakout or breakdown occurs.
We’ve identified three main zones, each offering different trade opportunities based on structure and risk tolerance:
🔴 $3,313 – Minor Intraday Level (Higher Risk):
This is not a formal support zone but a short-term reaction level. Positioned directly under descending trendline resistance, it's highly reactive and prone to stop hunts or liquidity spikes. Entries here carry elevated risk and require tighter stop placement.
Stop-loss: Below $3,301.165 – A clean invalidation if structure breaks.
🟠 $3,283 – 4H Support Shelf (Medium Risk):
A more defined level based on prior multi-candle rejections. This zone has shown stability and represents the core of current consolidation. A breakdown below here would likely trigger downside continuation.
Stop-loss: $3,263.450 – Under the consolidation base, confirming bearish expansion.
🟢 $3,240 – 4H Support Zone (Low Risk – Backed by Daily Structure):
This zone aligns with a broader daily support level and has not been tested in the current cycle. It offers a structurally clean and lower-risk long entry, especially for swing traders.
Stop-loss: $3,218.240 – Invalidation of the daily support structure.
Outlook:
Bullish trigger: Break and close above $3,320 and the trendline → opens path toward $3,420 and $3,510.
Bearish trigger: Clean loss of $3,283 → exposes downside toward $3,240, then possibly $3,127.
Current bias: Neutral-to-bullish while price holds above $3,283 and compression remains intact.
Note: The FOMC decision on Wednesday may act as a catalyst. A dovish tone could support bullish continuation in gold.
✅ Conclusion:
Gold is compressing within a clean descending triangle structure. If buyers defend one of the mapped support zones, we could see a push toward $3,420 and possibly $3,510. Until a confirmed breakdown below $3,283 occurs, the bias remains neutral-to-bullish, with opportunity on structured pullbacks.
Not financial advice. Like & follow for more Gold trade setups and structured market analysis.
XAUUSD... 1H CHART PATTERNI am looking at a **buy trade setup for XAU/USD (Gold vs USD)** with the following levels:
- **Entry (Buy Now):** 3315
- **Target (Take Profit):** 3350
- **Support (Stop Loss):** 3275
### Here's a quick breakdown of the trade:
| Parameter | Value |
|----------------|-----------|
| Entry | 3315 |
| Target (TP) | 3350 |
| Stop Loss (SL) | 3275 |
| Risk (per oz) | 40 points |
| Reward | 35 points |
### Risk/Reward Ratio:
- **Reward/Risk = 35 / 40 = 0.875**, which is **less than 1**.
- This means the risk is slightly higher than the potential reward. Normally, traders aim for at least a 1:1 ratio, preferably 1.5:1 or higher.
### Suggestions:
- If you're confident in strong bullish momentum (e.g. fundamentals or technicals support it), it could be worth it.
- Consider adjusting the **target higher** or tightening the **stop loss** slightly to improve the risk/reward.
- Watch for key resistance around **3350**, as price action may stall there.

xauusd next move?gold currently trading at 3330 and we are anticipating the target 3370 and 33350 good luck

XAUUSD SHORT POSITIONI took this short position in gold, we can see a correction, gold is still bullish.
If price breaks breaks level 3260 than is the possibility to extend the TP to level 3234.

selling in xauusdgold has break previous m15 low and then retrace upward to the supply we took sell after cisd

XAU/USD Short Term Pullback is Possible (READ CAPTION)📢As Of April 22, 2025 Gold (XAU/USD) is Exhibiting Strong Bullish movement Having recently Reached a Record high Of 3431.70 per ounce.
📌Key Levels:
✅️Resistance: Immediate resistance is observed around $3452 A breakout above this level could pave the way toward $3,485 and potentially $3,500 in the near term.
✅️Support: Support is established near $3,392. A decline below this point may lead to a correction toward the $33,74 level.
📈Market Outlook:
While the overall trend remains bullish, the overbought RSI suggests caution, as a short-term pullback is possible. So If it's decline below this point it will Drop to 3374-70
🚀Don't Forget to Support me With Your Precious Feedback 💗

XAUUSD to print LOWERGuaging that price will print lower and sweep more liquidity before making a bullish run again upon uncertainty

Possible buy opportunity First fair value gap which is a FVG that was identified on the D1 time frame might not be enough to push the market back up to the 3500 level
But the FVG below that is a weekly FVG and within that weekly FVG we have H4 FVG, if the D1 FVG doesn't hold the market we will definitely see it fall to the weekly FVG below and wick the H4 FVG within it then we could have a good opportunity to buy with a target at 3500 or 3480.

GOLD Weekly Levels Update for April 28 - May 2 2025in mentioned chart you can the see the levels for the upcoming
Trade wisely and place SL's accordingly

Daily live trade with XAUUSD in 15m/30m/1h 20250425Daily live trade with XAUUSD in 15m/30m/1h 20250425

GOLD (XAUUSD, 1H) Double Bottom & Continuation to Lower FibsOn the 1-hour chart, gold attempted to form a double bottom structure, which initially showed bullish potential. However, the price action quickly reversed near resistance, failing to sustain above key EMAs and trendline zones. This invalidates the reversal attempt and reaffirms the current bearish structure within the descending channel.
The price is now trading back below broken support and heading towards deeper Fibonacci retracement levels, with visible supply pressure and repeated failure to hold any bullish breakout. Volume has shifted lower on rallies, confirming weak buyer commitment.
Downside targets (Fibonacci structure):
– $3251 – 0.382 retracement
– $3221 – 0.618 retracement (primary structural support)
– $3165 – 0.786 extension zone (final support before breakdown scenario)
The descending wedge remains valid. Unless the market reclaims $3305–$3334 with strong confirmation, the corrective leg toward the lower support zones is likely to continue. A clean break below $3220 would open the door for a move toward the $3160s.
The failed double bottom setup confirms bearish continuation. Structure, volume, and trendlines all align with a move lower. Watch for reactions at $3221 and $3165 as critical levels.

Gold prices staged a "roller coaster" market, and the trade war In the early Asian session, spot gold showed a trend of rising and falling. The gold price reached a high of US$3370.58/ounce and then fell back to around the 3350 mark for consolidation. After experiencing a sharp drop of nearly 3%, the gold price ushered in a strong rebound, with a single-day increase of 1.83%, and finally closed at US$3348.50. This wave of rebound was mainly driven by the weakness of the US dollar and the entry of market bottom-fishing funds.
The trade deadlock fell into a "Rashomon", and the rebound of the US dollar was blocked
The current gold market is caught in a fierce game of long and short factors. The Asian power issued a solemn statement, emphasizing that if the US side really wants to solve the problem, all unilateral tariffs should be canceled immediately. This statement is in sharp contrast to the "negotiation signal" recently released by the White House, making the trade outlook more confusing.
Affected by this, the US dollar index fell 0.61% to 99.29, while gold received strong support from safe-haven buying.
Quaid believes that the gap between the positions of the United States and China on trade issues is as huge as the Pacific Ocean, and this uncertainty will continue to affect the market trend. The US dollar rebounded but was blocked. Although Trump's attitude eased and it strengthened briefly in the early stage, it showed signs of fatigue again in the morning. At the same time, the US stock market achieved three consecutive positive days, and the S&P 500 index rose by 2.03%, with technology stocks leading the gains.
Quaid's analysis:
Looking forward to the later period, high-level fluctuations may become the main theme, and traders need to grasp the rhythm.
The current market presents a pattern: First, the uncertainty of the trade war. If the US insists on imposing new tariffs, the gold price may hit the $3,500 mark again; second, the suspense of the Fed's policy. Whether the May meeting will release a signal of interest rate cuts will become a key turning point; finally, the trend of the US dollar. If subsequent economic data continues to deteriorate, the US dollar index may fall below the 99 integer mark.
Market operation strategies:
Go long on a pullback of 3335, stop loss at 3330, look at 3380
Go short after rebounding at 3380, stop loss at 3390, and look at 3330

Gold with Technical aspect XAUUSD Gold Update | M15 Timeframe 🙌
- This Analysis is based on educational purposes using Technical aspect
In M15 time Frame we have been observed that market bias is in bullish
- We have been waiting for our point at 3320 - 3314.00 as a Good Buy opportunity on behalf of Technical Analysis ❗️
If the body closing below the trendline on H4 Timeframe we will definitely share our thoughts
Although our targets would be 3364 - 3384.00
- All you need to stick with one Mentor 👋
#XAUUSD

Gold’s upside seems limited given overbought conditionsGold appears to be showing signs of finally cracking after an impressive run higher, with the excitement surrounding its rally potentially approaching a crescendo. The precious metal experienced a sharp intraday reversal on 22 April, a decline that continued into 23 April. Since the recent uptrend began in mid-March, gold has consistently found support at its 10-day exponential moving average (EMA).
For now, gold continues to hold just above this key support level; a break below the 10-day EMA could signal a heightened risk of further declines, potentially targeting $3,280 per troy ounce.
Gold remains extremely overbought on the weekly chart, trading above the upper Bollinger Band, with the relative strength index (RSI) above 80. This suggests that gold could be due for a sideways consolidation or pullback towards the 10-week moving average at $3,100.
Gold also remains overbought on the monthly chart, trading above the upper Bollinger band and with an RSI above 85. In this scenario, a break below $2,900 may lead to a decline towards the 10-month moving average of $2,800.
It is not often that an asset class trades at such extreme levels, and this suggests that gold may be overdue for a period of consolidation, either by trading sideways and marking time or by pulling back to retest some of the moving averages situated at lower levels. It continues to indicate that overall gold’s upside may be limited.
Written by Michael J Kramer, founder of Mott Capital Management
Disclaimer: CMC Markets is an execution-only service provider. The material (whether or not it states any opinions) is for general information purposes only and does not take into account your personal circumstances or objectives. Nothing in this material is (or should considered to be) financial, investment or other advice on which reliance should be placed.
No opinion given in the material constitutes a recommendation by CMC Markets or the author that any particular investment, security, transaction, or investment strategy is suitable for any specific person. The material has not been prepared in accordance with legal requirements designed to promote the independence of investment research. Although we are not specifically prevented from dealing before providing this material, we do not seek to take advantage of the material prior to its dissemination.

XAUUSD Higher Potiential to SellHNS Forming in H1, H4
CHOCH in m5, pull back to fvg then buy for a short time
but mostly aiming for BOS and retracement then Sell at fvg

Gold Price ActionHey traders! 👋 Looking at the current structure, gold has been respecting the bearish trend perfectly — with each flag pattern breaking down as expected.
🔴 We're now seeing a pullback into a key supply zone and the setup is shaping up for a potential short opportunity.
Let the market come to you, no need to chase 🙌
Manage your risk wisely 📊
Wishing you all green pips and solid setups! 💰✨
Happy Trading! 🔥

gold on sell#XAUUSD today we expect price to continue bearish, but firstly we need retest above 3346 to sell.
Above 3346 sell limit, take profit 3280, stop loss 3360.
Bullish can take formation unless the H1 candle closes long above 3350.
XAUMO XAUUSD Tactical Breakdown – April 30, 2025
1. XAUMO Tactical Map
Red Zone – Bearish Rejection (Sell Trap Zone):
Upper Limit: 3314.60–3318.00
Strong historical rejection + VWAP & Ichimoku base rejections.
Yellow Zone – Liquidity Sweep Trap Area:
Zone: 3297.50–3306.00
Price bounced repeatedly from this sweep zone; stop hunts likely.
Green Zone – Bullish Activation (Breakout):
Break Level: 3318.50+
Clean air above with strong upside potential to 3330+
2. Market Structure Overview
Ichimoku Cloud: Bearish crossover confirmed, price below cloud.
Volume Spike (RVOL): Reaching 1.93 on final leg = heavy sell interest.
Price Action: Lower highs forming. Current candle series weak.
VWAP Rejections: Ongoing rejection at 3305–3310.
Momentum: Bearish, confirmed by RSI < 45 on M15 & M30.
3. Tactical Entry Setups (Live Ready)
A. Intraday Sell Setup – Trap Breakdown
Type of Entry: Sell Stop
Entry Price: 3280.00
SL: 3287.00
TP1: 3270.50
TP2: 3259.00
TP3: 3246.00
Confidence: 82%
Justification:
Break below key liquidity shelf w/ heavy volume + trend confirmation from Ichimoku + RVOL surge.
B. Breakout Reversal Long Setup
Type of Entry: Buy Stop
Entry Price: 3318.50
SL: 3310.00
TP1: 3326.50
TP2: 3334.00
TP3: 3341.00
Confidence: 71%
Justification:
Break above compression + rejection cluster. Cloud flip + volume confirmation required.
C. Mean Reversion Scalp Play
Type of Entry: Sell Limit
Entry Price: 3305.00
SL: 3309.50
TP1: 3298.00
TP2: 3292.00
Confidence: 75%
Justification:
Previous VWAP + red zone overlap. Perfect trap zone confluence with divergence across M5.
4. STRIKE | DEFEND | SCALP | SWING
STRIKE:
15:30 Cairo → Enter Sell Stop @ 3280 if NY Open flushes.
3318.50 breakout long only if volume sustains.
DEFEND:
Stay out of chop 3298–3305 unless confirmed wick fakeout.
SCALP:
Inside Yellow Zone: scalp wick traps at 3304–3305 or 3288–3290.
SWING:
If price holds below 3280 post-NY, swing short down to 3259+ over 1–2 sessions.
5. Summary
Market still biased Bearish unless 3318.50+ breaks.
Volume + structure + Ichimoku confirms ongoing downside with brief retrace attempts.
NY Open = trigger window for explosive move.

The gold market fluctuated sideways. Waiting for a new trend?OANDA:XAUUSD During the Asian trading session, gold prices maintained a slight decline; in the early European trading, gold began to fall sharply, but it was still within the trend range expected by Quaid.
Today, the initial value of the US real GDP in the first quarter of 2025 will be released, and it is expected to grow by 0.3% at an annualized quarterly rate, after a strong growth of 2.4% in the fourth quarter of 2024.
If the world's largest economy unexpectedly shrinks, it will re-ignite bets on a sharp interest rate cut by the Federal Reserve. And this data will boost the upward trend of gold.
On the other hand, if the cooling of US economic growth is less than expected, it may bring a short-term relief to the overall market and the US dollar, which will continue to put gold under corrective downward pressure.
However, traders will remain cautious before the release of US ADP employment data this week; this data will limit the reaction of gold prices to GDP data. US non-farm payrolls will help the market assess whether US tariffs have had a substantial impact on the labor market.
Current trend analysis:
The daily line closed negative, and it is still bearish today. At the same time, yesterday's decline encountered 3300 support. In this pattern, regardless of today's strength, short once and see how the European session trends. If the European session falls, short the US session; if the European session rises strongly, the US session may remain volatile. If the European session breaks the downward channel, the US session may continue to fall.
Hi guys, if you want a solid trade, please wait for the US GDP data this morning. Quaid conducts gold trading after professional analysis.

ORB Strategy - Bearish GOLDHead and shoulders
Bearish break of the ORB - tried breaking out in the NY session but couldn't quite do it. The London session gold will have the volatility to text previous support.

GOLD Once more fall what will next?According this analysis a next Gold movement ,
Forest from Mr Martin Date 29 April Tuesday 2025
Gold has been in under pressure amid tariff war and head if US Data.
on Monday Gold is testing the last week 3260 remining under pressure from strengthening dollar and easing trade risks between the US and china. Gold will a new zone will formed I will see the market price once more fall and catch the strong Support.
Resistance Zone 3330 / 32340
Support Levels 3285 / 3275
You may find more details in the chart Ps Support with like and comments for more analysis.
