Gold is long, bottoming out during the day and rising
We can never predict what will happen at the crossroads of fate, but we can choose whether to give up or move forward with pain and run towards the end of our dreams. Even if there is no medal of victory, dignity and pride will accompany us all the way. Defeating opponents is only the winner of life; defeating yourself is the strong man of destiny!
After the gold gap opened high, it began to fall back quickly to around 3267. After a small rebound in the European session, it continued to retreat. The US session had a sideways correction before, and the US session started a large-scale pull-up, which continued to around 3353 and closed in the form of a small positive line with a long lower lead. After opening during the day, it continued to fall, and the current lowest reached around 3308. At present, the long and short positions are still fluctuating in a large range. The upper key pressure and the upper edge of the range are maintained at around 3370, while the lower edge and support of the large range below are maintained at around 3260. It is very likely that there will be multiple shocks and choices in this range again. At present, the multi-hour line is expected to form a sideways trend. After finishing, the daily line will fight at the short-term moving average position. The short-term moving average is also between the strength of long and short positions. Today's retracement needs further confirmation from the European session. If the European session continues to be weak, it is still necessary to pull back and short before the US session. The short-term support below is maintained near the integer level of 3300. If gold pulls back to 3310 during the day, it can be long first, with a target of 3330-50 and a loss of 3295. If the European session continues to break down, the US session will pull back below 3300 and short, with a target of 3270-60 and a loss of 3308. There will be large fluctuations in the short term, so be cautious about sweeping back and forth between long and short positions!
Today's operation: Gold will pull back to 3310 during the day and go long, with a target of 3330-50 and a loss of 3295.
Hello traders, if you have better ideas and suggestions, welcome to leave a message below, I will be very happy
GOLD trade ideas

BearishThe market hasn't been able to dip below the support price and due to that it seem like a bearish movement.

Gold has the potential to rebound towards the 2338 "Gold has the potential to rebound towards the 2338 area, but first, a correction to the 3212–3293 range is needed to create a strong momentum for further upward movement."
Today's Scenario: XAUUSD Trading Strategy Around the Key Price Zones
🔻 Sell XAUUSD around 3338
Stop Loss: 3346
Take Profit 1: 3328
Take Profit 2: 3218
Take Profit 3: 3212
🔺 Buy XAUUSD around 3212
Stop Loss: 3200
Take Profit 1: 3218
Take Profit 2: 3225
Take Profit 3: 3230
Note: Always set a Stop Loss in every trade to manage risk and protect your capital.

No need to hesitate, gold continues to be bullish
I just told you that you can go long near 3298. Gold once retreated to around 3275 during the European session.
I think if you want to go long, there is definitely a chance, and I have been emphasizing this.
I am still in a stable state, and I only suggest going long near 3290 during the US session.
As of now, gold has reached around 3330, which has reached my two target positions.
Since gold can stand at 3330, it will definitely continue to rise in the future.
At present, gold is a W-shaped structure, and it will definitely hit the top near 3360 in the future.
So, my suggestion here is still to go long. But maybe gold will not be given a position below 3300.
Therefore, if there is a subsequent retracement of gold, you can focus on entering the market near 3300-3310 and go long. The final target is still around 3360.

Another beautiful target hit for today Monday treated me gently today. Prediction fulfilled beautifully. GOD be praised

GOLD buy setup H1Hello! Friends,
Greetings. Please leave a Like if you like the idea.
Before start talking about technical Let's share your LOVE by giving me LIKES to support this work. Thanks in advance.

gold on bearish#XAUUSD price have multiple retest and decline between 3280-3293.
Now we await for price breakout below 3275 to sell which will reach 3247, stop loss 3291.
Below 3247 have a reversal which will take the price back 3260-3280 for new formation.

If the price enter these red-marked zones!Gold Market Analysis (Engulfing & Zone-Based Strategy)
This analysis is based on a straightforward zone-trading method using engulfing patterns and filtered key levels. The marked zones on the chart highlight high-probability trading areas.
Red Zones (Sell Areas):
If the price enters these red-marked zones, we look for bearish confirmation to enter sell trades.
These zones are derived from the 4H timeframe, making them more reliable. If the market reacts from here, you can target around 60–80 pips in profit.
A second sell zone offers potential for a larger move—up to 150+ pips—if the price respects it.
Green Zones (Buy Areas):
If the price drops and enters the green-marked zone, it’s a signal to look for buy setups.
This area may deliver a strong bounce, potentially yielding 100+ pips.
There’s no need for complicated patterns or indicators—just follow the zones. If the price hits a zone and shows confirmation, you trade it.
Trade at your own risk DYOR!!

Oscillatory tradingA conflict has broken out between India and Pakistan in the Kashmir region, and attention should be paid to whether the situation will escalate. This is a geopolitical event with a greater influence than the Russia-Ukraine conflict. The combined total population of Russia and Ukraine is less than 200 million, while the total population of India and Pakistan exceeds 1.6 billion! At the same time, pay attention to the dynamics of the Federal Reserve, the peace talks between Russia and Ukraine, the negotiations between the United States and Iran, as well as the situations involving Israel and Palestine, and Syria, etc. There was a large explosion at a port in Iran, leaving hundreds of people injured and dozens dead.
In view of the tariff remarks made by Trump on our country over the weekend, it has provided support for the gold bulls. The conflict between India and Pakistan and the explosion at the Iranian port have also provided support for gold. Therefore, there is a pattern that the gold price in the Boya market is likely to rise on next Monday. As for whether the decline pattern can continue after the rise, before this pattern is broken, we should assume the continuation, and adjust our thinking once it is broken. After this week's large-scale fluctuations in the gold market, next week the price is inclined to rise sharply at first and then fall back. However, considering the fundamental news, the gold bulls have a greater advantage. In fact, there is some contradiction between the fundamentals and the technical aspects! Therefore, in terms of operation, with such large-scale fluctuations, there are opportunities for both long and short positions, but neither long nor short positions should be chased blindly.
If the gold market opens normally on Monday morning, we can first take a long position. If it gaps up, do not chase the rise. Pay attention to the resistance level and consider taking a short position. If the price falls, as long as the support level between 3260 and 3270 is not broken, a long position can still be taken. Once this support level is broken, implement risk control and consider following the short position in the direction of the trend!
If your current gold trading performance is not satisfactory and you hope to avoid detours in your investment, you are welcome to communicate and exchange ideas with us!

Analysis of the latest trend of gold prices: 3280-3360Analysis of the latest trend of gold prices: 3280-3360
Gold prices have fluctuated violently recently, with the rise and fall of one day equivalent to the rise and fall of the past few months.
This has greatly increased the difficulty of trading. At the same time, it also magnified the leverage and profit and loss opportunities of the trading account.
As shown in Figure 4h:
The current gold price range fluctuates widely: 3280-3360
The market maintains a triangular oscillation pattern. Gold prices gradually rebounded after the trend line support, and the medium- and long-term bullish trend began to emerge.
Short-term upper key suppression: around 3360
Continued rise further strengthens the bullish signal.
Support level: focus on the 3260-3290-3300 line
If it stands firm, it will look up to the 3350-3360 area;
It is expected that Monday will show a wide range of fluctuations, and the overall range will remain at 3370-3260. After breaking through this position, you can follow up and do more.
Repeated sweeps are still the main theme, and there is no clear direction signal.
The upper pressure level is around 3350-3360. If the rebound continues at the opening of next week, pay attention to this position. If it breaks through, pay attention to 3370-3380.
The lower support level is 3288 and 3260. The operation is mainly based on shocks, and try to participate in band operations near key positions.
Operation suggestions:
Gold is long near 3290
Stop loss: 3280
Target: 3325, 3240!
If the upper 3248 pressure is not broken, you can short in the opposite direction!

Weekly Analysis for gold chart XAU/USDTrade Ideas:
1. Bearish Setup (if price stays below resistance zones)
Sell Zone: 3350–3377 (Daily + 4H resistance cluster)
Entry: Look for bearish candlestick patterns (like engulfing, pin bars) around 3350–3370.
Stop Loss: Above 3377 (safe distance, maybe 3385).
Take Profit 1: 3275 (Day support)
Take Profit 2: 3265–3243 (next support zones)
2. Bullish Setup (if price holds support and shows strength)
Buy Zone: 3265–3276 (4H and Day Support)
Entry: Wait for bullish confirmation (strong bullish candle, or bullish divergence).
Stop Loss: Below 3260 (like 3255 or lower).
Take Profit 1: 3337–3350 (Minor resistance)
Take Profit 2: 3377 (4H resistance top)
Notes
Watch carefully
If 3265 breaks cleanly, expect a deeper drop toward 3005–3024 (Weekly support).
If 3377 breaks strongly, bulls could push toward 3424–3435 or even 3503 (Monthly resistance).
Volume confirmation is important — watch for increasing volume on breakouts.
Use EMA 50/200 crossovers for intraday confirmation if you scalp.

Gold Rally Nears Exhaustion? Key Levels for the Next Big MoveGold has seen a powerful impulsive rally recently, but technical signs suggest a healthy correction could be near. Traders should keep a close eye on key levels for potential buying opportunities after a pullback.
Key Technical Points
Wave 5 Completion: The current bullish impulsive wave 5 appears to be nearing completion.
Key Fibonacci Level: The 0.618 Fibonacci retracement sits at $2,857 — a critical level for a potential corrective move.
Support to Watch: Loss of the $3,210 daily support would confirm the start of a corrective ABC pattern.
If gold maintains its daily support at $3,210, momentum could continue higher before any deeper pullback. However, if this support level is lost, traders should expect a correction down towards the 0.618 Fibonacci at $2,857, where swing long setups could become highly favorable. A healthy reset here would set a stronger foundation for the next bullish leg.

The yellow metal has reached the end of its journeyConsidering the approach to the 1.618 Fibonacci extension level and its alignment with the top of the ascending channel and the rapid growth of gold, it seems that we will not see gold at current levels for months and its price will decrease to the range between $2,000 and $2,700 for correction.

Interpretation of 4.25 Gold Short-term Operation IdeasFrom the technical analysis of the hourly market, yesterday's low was at $3,306, and the rebound just now showed an obvious stop signal at this position. Based on this, the current short-term suppression level can refer to $3,315, and the higher level is $3,328. For short-term investors, you can consider waiting for the gold price to rebound to around $3,315 to arrange short orders and continue to be bearish on the gold price. The first thing to pay attention to below is the support of the low point just touched at $3,287. If this support level is lost, the next key support level will be $3,260, the first low point on the previous downward journey. If $3,260 is also effectively broken, the short-selling force will be further released, and the gold price may face a larger decline.

XAUMO | Tactical Market Report – Friday, April 25, 2025
Overall Market Outlook:
The market is currently moving in a clear distribution zone, between 3,337 and 3,346.
There’s strong evidence of a bull trap near the 3,346 high.
Price is failing to stay above the VWAP, and we’re seeing overlapping signals between the HMA5 and EMA21.
A close below 3,329.00 would be a major reversal signal, possibly kicking off a wide downward move.
Session-Based Behavior (Cairo Time):
1. London Session (10:00 AM – 1:00 PM):
Expected Behavior: Fake breakout to attract buyers
Tactics:
Watch for fast moves into the 3,337–3,345 zone
Sell if rejection candles appear (Shooting Star / Bearish Engulfing)
Confirm with divergence or internal support break on the 15-min chart
2. Pre-New York (1:00 PM – 3:00 PM):
Expected Behavior: Tight consolidation and position building
Tactics:
Monitor price around 3,320–3,329
If price stays below VWAP, stick with short positions
Don’t go long unless there’s a real breakout with strong volume + RSI confirmation
3. New York Open (3:30 PM – 4:30 PM):
Expected Behavior: Initial fake move followed by strong momentum
Tactics:
Sell after a break below 3,306 + retest
RSI dropping below 40 = strong bearish momentum confirmation
4. New York Continuation (After 4:30 PM):
Expected Behavior: Continuation in the dominant direction
Tactics:
If price stays under 3,306.50 → continue selling
Use a trailing take profit and adjust based on price movement
Trading Scenarios:
Main Bearish Scenario (Primary Setup):
Entry Options:
Sell Limit at 3,329
Sell Stop at 3,306
Stop Loss Levels:
SL1: 3,341.12
SL2 (Trailing): 3,345.35
Take Profit Targets:
TP1: 3,294
TP2: 3,278
TP3: 3,255.74
TP4: 3,226.88
TP5: 3,198.01
Confidence Level: 85%
Why This Trade?
Failed breakout
Clear distribution signals on the chart
Confirmed bull trap above 3,342.82
Alternative Bullish Reversal Scenario (Low Probability):
Entry: Buy Stop at 3,346
Stop Loss: SL at 3,337
Take Profit:
TP1: 3,355
TP2: 3,367.45
Confidence Level: 50%
Conditions Needed:
Ichimoku Cloud breakout
EMA21, EMA8, and HMA5 aligning upward
Bullish RSI divergence + MACD crossover
Structural Outlook (10:00 AM):
Moving Average Cluster (HMA5 + EMA21): 3,307 – 3,310
Institutional Resistance Zone: 3,337 – 3,346
Confirmed Traps:
Bull Traps at 3,342.82 and 3,338.70
Volume Profile:
VWAP = Rejected
VPOC shifted toward 3,294
Large selling volume: 246.69K
=========
Key Economic Events Today (Cairo Time):
4:00 PM – Final US Consumer Confidence (April):
Strong reading = Bullish for USD = Bearish for Gold
Weak reading = Bearish for USD = Bullish for Gold
Evening – US Oil Rig Count:
Increase = Rising inflation expectations → indirect support for Gold
No change = Minor short-term impact
========
XAUMO | Bullish Tactical Plan
Bullish Idea Summary:
Even though the market is under heavy selling pressure, there’s still a chance for a bullish counter move if these technical reversal signals show up:
Reversal candles like a Hammer or Bullish Engulfing near 3,294–3,286 support
A solid breakout above the Ichimoku Cloud at 3,346
Bullish RSI Divergence + MACD Crossover
Conditions for Bullish Activation:
Price must break and hold above 3,346 with rising volume
HMA5, EMA8, and EMA21 must cross upward on both 15-min and 1-hour charts
Must see strong momentum + BBMA reversal confirmation
Buy Scenario Details:
Entry: Buy Stop at 3,346.20
Stop Loss:
SL1: 3,337
SL2 (Trailing): 3,333.15
Targets:
TP1: 3,355.00
TP2: 3,367.45 (weekly high)
TP3: 3,385.00 (Institutional exit zone via BBU)
Confidence Level: 50–60%
Why the caution? Previous breakouts in this range have failed repeatedly.
Final Note:
“Below 3,306, price gets crushed. Above 3,346 is just a distribution trap.
Buying without a real breakout? That’s tactical suicide.
Read the chart, not your wishes.”
Conclusion:
If the bullish scenario plays out today, Friday April 25, 2025, the market may be heading into a short-term rally fueled by temporary momentum after a sharp pullback.
The key to this move is a strong and confirmed breakout above the 3,346 resistance zone. As of now, price is still hesitating below that level, which signals ongoing distribution—or maybe preparation for a breakout.
To confirm the setup, you’ll need:
a clean close above 3,346
upward crossover of HMA5, EMA8, and EMA21 on the 15m and 1h
RSI crossing 55 and MACD flipping positive
Only then does the Buy Stop at 3,346.20 become a serious play, with stops placed smartly at 3,337 and a trailing stop at 3,333.15 to avoid fakeouts.
Initial targets are 3,355, then 3,367.45, and finally 3,385 as the stretch goal—an institutional area where profit-taking is likely.
Still, with confidence only around 50–60%, this trade needs clear technical confirmation before execution.
If the market drops back below 3,329, the bearish plan remains the default.
The price decides. We just stay ready.

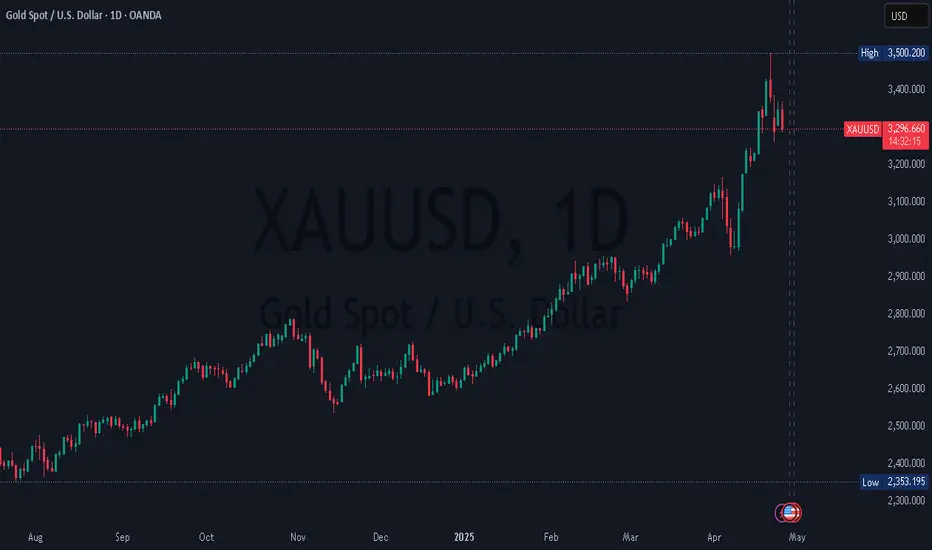
Analysis of XAU/USD for the coming days, based on daily chartAnalysis of XAU/USD for the coming days, based on daily chart and recent market information.
Technical Analysis
Trend & Patterns
Since late December 2024, gold has been in a strong uptrend, breaking out of the descending channel that formed in December–January. Recently we’ve seen a brief consolidation around the $3,300–$3,400 zone after peaking near $3,500.
Indicators
The RSI sits just above 50, pointing to continued bullish momentum. The MACD lines remain positive, though they’re approaching a potential turning phase.
Support & Resistance
Resistance: $3,400 (recent daily highs), then $3,500 (all-time high).
Support: $3,300 (current consolidation floor), followed by $3,250 and $3,100 as deeper support levels.
Short-term Outlook
Gold is likely to trade sideways between $3,300–$3,400, with dips offering buying opportunities. A decisive break above $3,400 would open the door to retests near $3,450–$3,500. If XAU/USD falls below $3,300, it could quickly slide toward $3,250–$3,100.
Fundamental Catalysts
Safe-haven demand from geopolitical and trade tensions continues to underpin gold prices.
Fed policy: the odds of a rate cut before summer remain low, as Fed officials emphasize patience. That limits downward pressure on the dollar (and thus supports gold).
Macro agenda:
May 2: US Non-Farm Payrolls
May 7: Fed meeting & Powell remarks
May 13: CPI report vs. rate guidance
These releases could trigger significant intraday volatility.
Conclusion & Near-term Outlook
Given the technical bullish bias and upcoming US data, I expect over the next few days:
Consolidation: $3,300–$3,400
Bullish scenario: recovery above $3,400 leads to retests of $3,450–$3,500
Bearish scenario: a break below $3,300 triggers a swift drop toward $3,250–$3,100
Stay alert around the NFP, Fed, and CPI releases—they’ll drive the near-term direction.
GOLD-SELL strategy 3 hourly chart GANNYesterday we went slightly higher, but we failed to push through. Today, the 3 hourly chart is starting to show negative influence, and I feel we have now greater chance to see $ 3,235 area in coming sessions.
Strategy SELL @ $ 3,310-3,350 and take profit near $ 3,247 for now.

Spot Gold Retreats After Early Rally, Holds Above $3,300 Amid CaSpot gold surged in early trading before pulling back, hitting a high of $3,370.58 before retreating to fluctuate around $3,350. After a 3% single-day plunge on Wednesday, the metal rebounded 1.83% on Thursday to close at $3,348.50/oz, driven by a weaker dollar and bargain-hunting demand.
The price is now firmly above the $3,300 threshold, with cautious optimism prevailing in the market. U.S. Treasury Secretary warnings about prolonged trade tensions continue to bolster safe-haven demand, while growing bets on a Fed rate cut in June provide fundamental support.
Technically, the daily chart shows an uptrend, with prices holding above the MA55 and MA14 averages. The RSI (64.37) nears overbought territory but remains moderate, while the MACD golden cross signals sustained bullish momentum. On the 4-hour chart, gold has stabilized above $3,300, with narrowing MACD histograms hinting at the end of a correction and potential short-term bottoming.
Key Levels:
Resistance: A break above $3,380–3,385 could pave the way for $3,390 and a retest of $3,400+.
Support: A drop below $3,300 may trigger a retreat toward $3,260.
Outlook: While gold may consolidate in the near term, medium-to-long-term momentum remains bullish.
Trading Suggestion:
Buy on dips near $3,340–3,345, stop loss at $3,332, target $3,378.
Strict risk control advised due to high volatility.
(Note: All prices in USD/oz unless specified.)

Bearish Reversal in Play! | Key EMA Rejection & Support Targets🔍 Chart Analysis Summary
🕐 Timeframe: Likely a short-term (H1 or H4) chart.
📈 Asset: Most probably XAU/USD (Gold) or a similar asset.
🔴 Trend Breakdown
📍 Previous Trend:
✅ Strong bullish momentum 📈 pushing price into a resistance zone.
📍 Current Price Action:
🚨 Bearish rejection from resistance 🟥
Price got rejected exactly at the resistance zone (gray box) and the EMA 50 line 🔴 — a classic setup for a reversal ⚠️
📉 Key Technical Levels
🟦 Resistance Zone:
🔹 Between 3,385 – 3,400 USD
🧱 This zone rejected price strongly (see red candles)
📌 Also aligned with EMA 50 (3,400.837) — confluence adds strength 💪
🟩 Support Zones:
First Support Zone – ~3,285 📉
💙 In line with the EMA 200 (3,285.687)
🛡️ Might cause a temporary bounce 📈
Second Support Zone – ~3,240
📉 Marked as the deeper support in the bear case 🕳️
💥 If the first support breaks, this becomes the next target 🎯
📊 Indicator Insights
EMA 50 (🔴 Red): 3,400.837 – acting as dynamic resistance 😤
EMA 200 (🔵 Blue): 3,285.687 – acting as dynamic support 🛡️
📉 Price breaking below EMA 50 = first bearish sign
📉 Approaching EMA 200 = watch for either a bounce 🏀 or a breakdown 💥
🎯 Bearish Setup Forecast
📉 Here's what the arrows show (strategy logic):
📉 Breakdown below resistance → strong bearish move
🎯 Target 1: First support (EMA 200 / ~3,285)
🔄 Minor pullback possible (fake bounce 🪃)
💣 Continuation lower toward next support (~3,240)
📌 Critical Zone to Watch 🔍
⚫️ The circle marked “FOCUS ON THIS POINT” is key:
📌 Failed retest = confirmation of resistance
📌 Price rejected this level + closed below = strong bearish signal 🚨
🧠 Professional Insights
Element Observation Emoji
Trend Shift Bullish ➡️ Bearish reversal 🔄📉
Momentum Bearish pressure increasing 💨🟥
Risk Point Resistance near EMA 50 ⚠️🧱
Trade Idea Short toward supports 📉🎯
Confirmation Rejection candle after retest 🕯️🔁
Focus Level EMA confluence near resistance 🎯📌
🛠️ Possible Trade Plan (for educational purposes only)
Short Entry: Below 3,385 (after rejection 🔻)
Stop-Loss: Above 3,405 (above EMA 50 🛑)
Target 1: 3,285 🧲
Target 2: 3,240 📉

Gold surged and then fell back to fluctuate, pay attention to 33
The first goal of trading is survival, and the second is profit.
📌 Driving events
After experiencing the biggest drop in five months, gold prices rose on Thursday (April 24) and returned to above the 3300 mark.
After US President Trump hinted that tariffs on China might be reduced and expressed no intention to remove Federal Reserve Chairman Powell, the market's risk aversion has cooled down. Gold hit a high of $3,367 during the Asian trading session, which can be regarded as ice and fire!
📊Comment analysis
For participants in the gold market, the impact of this price plunge is self-evident. The stock prices of gold mining companies have fallen accordingly, and the production capacity that expanded in the early stage due to the rise in gold prices may face the risk of shrinking profits.
At present, gold is under obvious pressure from above, and what needs to be paid attention to now is that the current round of gold adjustments is likely to continue, which means that it is not time to buy the bottom yet!
💰Strategy Package
Except for the early morning wave, the strength of the hourly line rebound is actually somewhat weak. As for the European session, Labaron is more inclined to continue to be bearish, and the current first round of rebound pressure is around 3350! If the rebound is in place, you can continue to try short orders!
⭐️ Note: Labaron hopes that traders can properly manage their funds
- Choose the number of lots that matches your funds
- Profit is 4-7% of the fund account
- Stop loss is 1-3% of the fund account

Volume Gap at 3300-3290Currently market plays Accumulation zone between 3326-3335 area.
What we have If we got closing above 3335-3337 then market will again carry the Rising wedge channel upto 3380.
On the other hand, once candle closes below 3326-3320 we'll see the the area which we called (volume imbalance or opening gap) will be covered.
Additionally: I'm holding the sell trade and expecting the drop first then long .
Although above 3335-3338 closing I will shift my trades.
Today's we have alot high impact news coming, technical sentiments will effect.

Is gold about to peak? Is the bull market still there?In fact, it is normal for a strong bull market to have a rapid washout. The logic of the bull market is not Trump's call to Powell. Trump's tricky operation is only a plus for the rise of gold, not a must. The logic of the rise of gold is that the repayment ability of US debt is questioned and the hegemony of the US dollar is challenged. The fact of the long-term fiscal deficit of the United States and the visible growth of US debt are the real driving forces.
As the International Labor Day is approaching, the bulls in the Asian market often choose to leave or reduce their positions in order to reduce warehouse interest and realize profits, which will cause a phased downward adjustment. In other words, from the perspective of the future, the underlying logic of the bull market has not changed. Holders of physical gold do not need to worry too much. They are optimistic about the strong bull market of gold in the future. The decline is often an opportunity to get on the train again. In the past, they waited for adjustments, and after adjustments, they were afraid that the bull would be gone, which made them worried about gains and losses.
Technical analysis:
The current gold price is in a stalemate stage of long-short game. On the one hand, the path of the Fed's easing policy has been basically clear, and the US dollar is facing correction pressure; on the other hand, the stable global risk sentiment and the strong performance of the stock market have weakened the attractiveness of gold as a safe-haven tool. The repeated signals of global trade negotiations have also made the market direction unclear. From a technical point of view, gold has received support after the correction to the 26.3% Fibonacci retracement level near 3317 this week, and has returned to above $3,300 in the short term. The upper resistance focuses on the position of 3360. Once it breaks through, it will open up the space leading to the 3400 mark.
Quide Strategy Analysis:
After the early Asian market rose, it fell back and fell below the support levels of 3351 and 3330 analysis. Now the market rebounded near 3325, which is also in line with the trend of pulling back and forth. In the big trend, the gold rally did not exceed 3380, so there is still downward demand, that is to say, it can only be regarded as a rebound on the way down. In the short term, this wave of gains stopped at 3367. Now it broke through 3351 and pierced 3316 to rebound. The main focus on the upper side is the support-to-resistance level of 3350.
With 3350 as the protection, go short to see the gold price break through 3314. If it breaks down effectively, it can move down to see the turning point of the rebound between 3283 and 3260. On the whole, in terms of the short-term operation strategy of gold, Quide recommends rebound shorting as the main strategy and callback longing as the auxiliary strategy. The upper short-term focus is on the 3360-3370 line of resistance, and the lower short-term focus is on the 3310-3300 line of support.
Market trading signals are fleeting. Market trading signals are fleeting, and Quaid hopes that traders will seize every trading opportunity and become ace traders in the gold market.

Gold ShortI am looking to Short Gold. and I will target the Gap that was formed during the Asia session. We join the Market at the current rate
