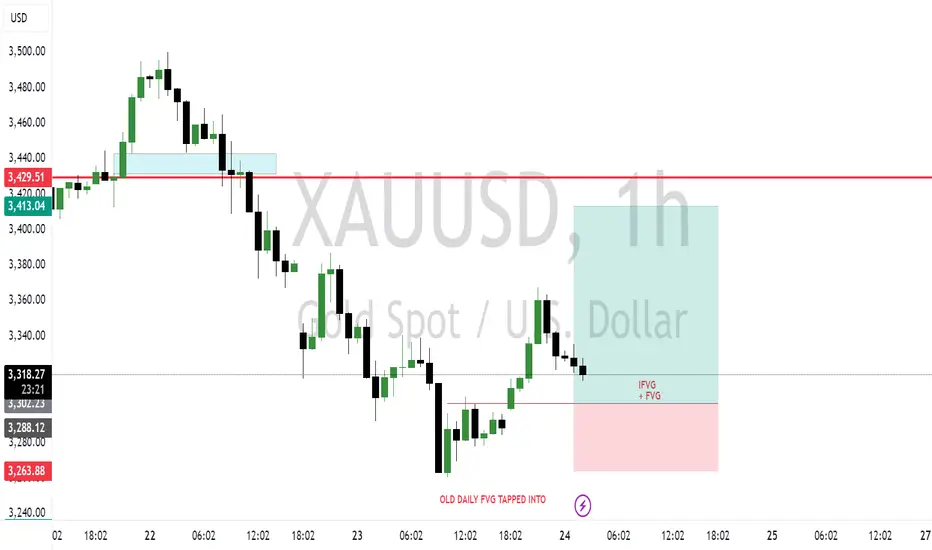
BUYS FOR HOLDSRecently price came down and tapped into an old Daily FVG. Yesterday's candle closed above the FVG signifying no interest to continue lower.
Today I was looking for long set ups and this is the outcome.
There's a probability that price will bounce back after retracing to that discount level where we have the FVG + OB and a confluence of iFVG with other lower TF confluences.
Let's see how price will play this out.
Safe trading guys.
GOLD trade ideas
XAU/USD Price Action Update – April 24, 2025📊XAU/USD Price Action Update – April 24, 2025
🔹Current Price: 3,319.80
🔹Timeframe: 1H
📌Key Supply Zones (Resistance):
🔴3378–3386 – Major Supply Zone (HTF rejection expected)
🔴Short-Term Rejection Blocks near 3,341.86 and 3,328.38
📌Key Demand Zones (Support):
🟢3306.84–3316.29 – Strong Demand Zone (recent bullish reaction)
🟢H1 RBS near 3,226 – Higher Timeframe Bullish Origin
📈Bullish Outlook:
Price recently reacted from the 3306 demand zone and is forming a higher low. A break above minor supply (3,328–3,341) could lead to a retest of the 3378–3386 area. Ideal bullish setup: price holds above 3,306 and forms BOS on the lower timeframe.
📉Bearish Outlook:
If price fails to break above the 3,328 zone and starts rejecting, expect a retest of 3,306. Below that, further downside toward the RBS zone at 3,226 is possible. Watch for signs of supply absorption or rejection candles.
⚡Trade Setup Tip:
✅Watch for CHoCH or BOS at 3,328
✅Enter on retest of demand with confirmation
✅Avoid FOMO – wait for confirmation before entry
#XAUUSD #GoldAnalysis #PriceAction #SmartMoneyConcepts #SupplyAndDemand #TechnicalAnalysis #FXF #fxforever #BreakOfStructure #LiquidityZones #IntradaySetups #MarketUpdate

24/4/2025 Gold structure formed.24/4/2025
Gold structure formed.
In the biggest time frame like weekly and daily trend is still strong bullish. However current trend is bearish due to the strong rejection from 3500 to 3260.
From which today gold has seen respecting 3260 start to gave a sign of the continuation to climb back up to test again 3500.
Current resistance is 3367. And the current cmp support stand at 3267-3277.
Today is a good potential to scalp buys and sells in either support or resistances.
With cloned trendline placed we can witness a bullish flag pattern also forming. However its too early to say and its just an assumptioned.
To sell at the market its seems to be a little high risk so a slightly higher postion seem safer like 3410 where the broke of support to 3500 breaks and strong push down ever since.
To buy of current smaller timeframe seems safer and with a continuation of fresh breakout pullback in M15 or M30 however avoid buying near resistance.

Gold buy trade Gold buying from supply zone support sl below the zone . Target XI zone. If sl hits will sell in break down of supply zone target demand zone .

XAU/USD(20250424) Today's AnalysisMarket News:
The United States hit a 16-month low in April. The total number of new home sales in the United States in March was an annualized to a new high since September 2024.
Technical analysis:
Today's buying and selling boundaries:
3311
Support and resistance levels:
3436
3389
3359
3263
3233
3186
Trading strategy:
If the price breaks through 3311, consider buying, the first target price is 3359
If the price breaks through 3263, consider selling, the first target price is 3233

XAU / USD 4 Hour ChartHello traders. Looking at the 4 hour chart I have marked the area of interest. Let's see what tomorrow brings after tonight's overnight sessions. Big G gets a shout out. Be well and trade the trend.

Shorting GoldTaking a short position on gold , targeting the previous HTF support
1:1:5 RR using strict risk management


Gold Traders Pay AttentionA Major Buying Opportunity is Emerging for GOLD ( XAUUSD )
In this analysis, we highlight an upcoming potential buy zone on GOLD ( XAUUSD ) that could present a significant trading setup. We’ll break down recent price action, key support zones, and technical signals that traders should keep on their radar.
Whether you're focused on intraday strategies or swing trading, these insights can help you position effectively for the next major move.
Don't miss out—watch the full breakdown for complete details.
Share your GOLD trade strategy in the comments below.

Gold falls from highs, medium-term bullish structure remains uncSpot gold prices continue to fall, extending the correction of the psychological level of $3,500.
At the same time, senior Trump administration officials hinted that they are "paving the way" for a trade agreement with Asian powers, further boosting investors' confidence in the global economic outlook, thereby weakening demand for safe-haven gold.
Fed policy expectations still support gold's downward space.
Despite improved risk sentiment, the market still expects the Fed to launch a new round of interest rate cuts in June, with three rate cuts expected throughout the year, which makes gold's medium-term trend still optimistic. At present, weak US economic data and the president's erratic trade policy have further suppressed investors' confidence in US dollar assets.
Quaid believes that the market's expectations for the Fed's interest rate cuts have supported the structural upward trend of gold, even if it faces a technical correction in the short term.
Technical aspects show that gold may adjust in the short term, but the support below is strong.
Quaid's analysis:
The current adjustment pressure faced by gold comes more from short-term market sentiment repair and technical profit-taking, but the medium- and long-term fundamentals are still strong. The Fed's interest rate cut expectations have not changed, the US dollar has a clear medium-term weakening trend, and geopolitical factors are still highly uncertain. Gold is still in a bull-dominated pattern overall.
Operation strategy:
3325 long, stop loss 3315, take profit 3350. If it stops rising at 3350, traders can flip the operation strategy and short at this position.

GOLD Short-term analysisGold started to fall after hitting 3500. The current low point is temporarily at 3260. The daily cycle has failed to break down after three trading days of testing. The pattern is very obvious. The trend has no continuity, that is, it runs back and forth.
The gold daily line has maintained a wide range of fluctuations for 5 consecutive trading days. The short-term four-hour chart and hourly chart moving averages are glued together, the RSI stops and maintains the middle axis, and the Bollinger Bands gradually close, forming a box range of 3265/3385. The trading idea is to participate in the high-altitude, low-long and short-term trading.
Gold continues to fluctuate. The data in the second half of the week is dense. Gold is likely to wait for data to break the current situation. It maintains a fluctuating trend before the data. Gold continues to rise in the Asian session and is blocked. The rebound is still under pressure. Today's ADP data is also a key node for gold longs and shorts. If gold chooses a direction, it must follow.
Gold continues to fluctuate in the 1-hour period, and the fluctuation range begins to narrow, which indicates that it is getting closer to a change. Gold now seems to be fluctuating downward. Gold hit a high of 3328 again in the Asian session and fell under pressure. According to the ADP data tonight, if gold breaks through the fluctuation range today, then follow the trend at that time.
Key points:
First support: 3300, second support: 3275, third support: 3260
First resistance: 3340, second resistance: 3355, third resistance: 3373
Operation ideas:
Buy: 3298-3305, SL: 3290, TP: 3325-3335;
Sell: 3350-3355, SL: 3364, TP: 3330-3320;

Gold starts to fluctuate at a high level, will it fall or rise iFrom the 4-hour chart of gold: From the above chart, the current trend may be a convergent triangle consolidation, with the high point gradually moving down and the low point gradually moving up. When the space can no longer be expanded, a breakthrough in a certain direction will be obtained. At present, the upper track is at 3344 and the lower track is at 3273. It may not be able to completely touch the upper and lower tracks, but there is a certain support or pressure performance near them; now the key middle track has been lost again, under pressure at 3315, and there is still a chance to explore and approach the lower track tonight; from the hourly chart: the trend of the Asian session in the past few days has been relatively smooth, with better continuity. Once it reaches the European session, it is a volatile oscillation back and forth; the current 3330 line is today's Feng Shui Ridge. If it can withstand pressure here, there is still room for a second exploration.
On the whole, the short-term operation strategy of gold today is recommended to sell on rebounds as the main strategy, and buy on pullbacks as the auxiliary strategy. The short-term focus on the upper side is the 3330-3340 line of resistance, and the short-term focus on the lower side is the 3300-3290 line of support.
Buying range: 3302-3300, SL: 3290, TP: 3320-3335
Selling range: 3333-3335, SL: 3345, TP: 3320-3315
Key points:
First support: 3300, second support: 3295, third support: 3290
First resistance: 3330, second resistance: 3335, third resistance: 3345

XAUUSD waiting for breakoutThis XAU/USD 1-hour chart shows a symmetrical triangle pattern forming, which typically signals a potential breakout as price compresses between converging trendlines
Potential Scenarios:
• Bullish Breakout:
If the price breaks above the upper trendline (~3345–3350 area) with strong volume and RSI follow-through, the next targets could be:
• Short-term: 3380–3400
• Medium-term: 3450 and possibly retest the recent high of 3500
• Bearish Breakdown:
A break below the lower trendline (~3280–3270 area) with RSI dropping below 40 could lead to:
• Short-term: 3240
• Medium-term: 3200 or even 3160

Analysis of the latest gold trend on April 30:
1. News analysis: Bullish and bearish factors are intertwined, gold is under pressure but safe-haven support is still there
The strengthening of the US dollar suppresses gold prices
Trade optimism boosts the US dollar: The progress of negotiations between the United States and major trading partners (such as China and India) has eased market concerns about tariff escalation, and the recovery of risk appetite has driven demand for the US dollar, and the attractiveness of gold as an interest-free asset has declined.
Focus on US economic data: If this week's "super week" data (ADP, initial jobless claims, non-agricultural) performs strongly, it may further strengthen the Fed's expectations of suspending interest rate cuts, which is bearish for gold.
Geopolitical risk aversion supports gold prices
India-Pakistan conflict escalates: Geopolitical tensions (such as the Kashmir issue) may limit the decline of gold, and we need to pay close attention to the evolution of events.
Trump's softening policy toward China: If the China-US trade agreement achieves a breakthrough, it may be bearish for gold in the short term; but if there are new variables, risk aversion will return quickly.
Market sentiment is contradictory
Despite the strengthening of the US dollar, the gold daily line closed with a "hammer line", showing strong buying support below, indicating that the bears have not completely controlled the market.
2. Technical analysis: range oscillation to be broken through, pay attention to key positions
Daily level
Form: high-level hammer small positive line, suggesting bull resistance, but the 3360-3370 area forms a double top suppression, and we need to be alert to the risk of peaking.
Key position:
Support: 3260-3268 (multi-bottom support), 3300 (psychological barrier).
Resistance: 3325-3330 (Bollinger middle rail), 3360-3370 (double top).
4-hour level
Range oscillation: Gold prices are in a wide range of 3260-3370, and the short-term direction needs to be confirmed by a breakthrough.
Bollinger band signal:
The middle rail 3325 is the watershed of intraday strength and weakness. If the rebound is blocked here, you can try a short order.
If the lower rail 3300 falls below, it may test the support of 3285-3260.
Hourly level
Short-term trend: After rebounding to 3325 on Tuesday, it fell back, indicating that there is selling pressure at this position. If the attack fails again, the shorts may dominate the short-term trend.
3. Operation strategy: sell high and buy low, keep a close eye on the breakthrough
Intraday short-term (conservative)
Short on rebound
Entry: 3325-3330 (Bollinger middle rail + previous high resistance).
Target: 3300→3285, break to see 3260.
Stop loss: above 3335.
Long on callback
Entry: around 3300 (previous low support), give up if it breaks down quickly.
Target: 3320-3325.
Stop loss: below 3290.
Mid-term layout (breakthrough and follow)
Break above 3370: chase long, target 3400-3420, stop loss 3350.
Break below 3260: chase short, target 3220-3200, stop loss 3280.
IV. Risk warning
Data risk: This week's US employment data (especially non-agricultural) may cause violent fluctuations. It is recommended to lighten positions or wait and see before the data.
Geopolitical events: India-Pakistan conflict and sudden news of Sino-US trade negotiations may reverse short-term trends.
Liquidity risk: Thin trading during Asian hours (such as Chinese holidays) may amplify fluctuations, so position management needs to be prudent.

XauUsd Gold $100 Sideway Range🟢 Buy-Side Trades (Bullish Setups)
Entry Logic: Price enters discount zone (below 0.5–0.618 Fibonacci), confirms BOS, then takes off.
Notable Buy Setups:
+570 PIPS
+220 PIPS
+1540 PIPS
+970 PIPS
+910 PIPS
+560 PIPS
+410/460 PIPS
+780 PIPS
These are mostly based on:
Price rejecting the 0.618 retracement
Entry from FVG/OB (Order Block) or Premium/Discount Zone
Targets near key Fibonacci extensions or imbalance fills.
🔴 Sell-Side Trades (Bearish Setups)
Entry Logic: Price taps into Premium zones, shows rejection, then breaks down with BOS confirmation.
Notable Sell Setup:
Around 3,370–3,351, a Premium Entry zone is tagged, followed by a BOS down.
Price respects:
0.786–1.0 retracement zones for reversals
Often used 0.25, 0.382, and 0.618 levels for TP calculations
📏 Fibonacci Application
Fib retracements and extensions are used across all setups:
Entries: 0.5–0.618 retracement zones
Targets: 0.236, 0.382, -0.25, -0.618 extensions
The confluence between price action, Fibs, and BOS is very precise.

Gold INTRADAY Key trading level at 3227Gold INTRADAY corrective pullback supported at 3227
Trade optimism is lifting market sentiment, with the US Dollar gaining strength and pulling investment away from safe-haven Gold. However, uncertainty lingers due to conflicting signals in US-China trade talks. While President Trump claims discussions are ongoing, China denies any tariff negotiations. At the same time, traders anticipate the Federal Reserve will restart rate cuts in June, with markets pricing in the likelihood of at least three cuts this year. These expectations could provide near-term support for Gold despite current headwinds.
Resistance Level 1: 3392
Resistance Level 2: 3457
Resistance Level 3: 3500
Support Level 1: 3227
Support Level 2: 3173
Support Level 3: 3130
This communication is for informational purposes only and should not be viewed as any form of recommendation as to a particular course of action or as investment advice. It is not intended as an offer or solicitation for the purchase or sale of any financial instrument or as an official confirmation of any transaction. Opinions, estimates and assumptions expressed herein are made as of the date of this communication and are subject to change without notice. This communication has been prepared based upon information, including market prices, data and other information, believed to be reliable; however, Trade Nation does not warrant its completeness or accuracy. All market prices and market data contained in or attached to this communication are indicative and subject to change without notice.

XAU/USD(20250429) Today's AnalysisTechnical analysis:
Today's buying and selling boundaries:
3321
Support and resistance levels:
3405
3374
3353
3289
3268
3237
Trading strategy:
If the price breaks through 3353, consider buying, the first target price is 3374
If the price breaks through 3321, consider selling, the first target price is 3289


Gold sell idea Gold's growth has stalled due to the US-China trade war uncertainty, repeatedly testing support levels. As a safe-haven asset, further decline to the 3270-3246 support zone is possible. Given the market's sensitivity to news, it's crucial to approach gold trading with caution, as sentiment can shift rapidly.

XAUUSD on correction to 3315I'm holding my Buying order at 3279 which I mentioned why I took buy at 3278-80 area
What possible scenario we have?
Bullish scanario:
Currently market Is in falling wedge channel and market Is on retest upper trend line which meets 3315-20 resistance area although my buy trae3s that 3315 in first round.
Additionally : if market breaks the trend line and closed above the 3315-3320 then stay on bullish move upto 3360 target.
Brearish Scenario:
On the other hand, market shows 3270-3280 shows strong rejection area at this time ,if market directly fall to that area and gives closing below then we’ll enter on selling side and 1st target will be 3245 then 3230.
Additionally: as currently I'm holding my buy and my tps are 3315. If market remains low candles closes below 3320 ,then we'll on selling side.

XAUUSD - Gold trend reversed?!Gold is trading below the EMA200 and EMA50 on the hourly timeframe and is in the specified pattern. The continuation of gold's movement depends on the breakdown of one of the two established trend lines, and after a valid breakdown, we expect to reach the established targets.
In recent weeks, gold prices have experienced significant volatility. This precious metal, long regarded as a safe-haven asset during periods of economic uncertainty, faced a decline in Monday’s trading session. The primary reason behind this drop was signs of easing trade tensions between the United States and China, leading to decreased demand for safe assets. This decline occurred while investors awaited clarity regarding ongoing trade negotiations between the two countries.
Last week, media reports indicated that China exempted some American imports from 125% tariffs, signaling a reduction in bilateral tensions. In response, Donald Trump stated that trade talks were underway; however, this claim was rejected by China. Additionally, the U.S. Treasury Secretary announced that he was unaware of any active negotiations, further fueling market doubts.
According to a recent Federal Reserve survey, participants cited the outflow of foreign capital from U.S. assets and a decline in the dollar’s value as potential new economic shocks. Some respondents believed that increased tariffs might only cause limited market disruptions. The survey indicated that despite market turmoil in April, prices remained elevated relative to fundamental indicators.
Meanwhile, investors were closely awaiting key U.S. economic data set to be released over the coming week. While the previous week was relatively quiet in terms of economic indicators, market focus has shifted toward a series of critical U.S. employment reports. These include the Job Openings and Labor Turnover Survey (JOLTS) on Tuesday, the ADP private-sector employment report on Wednesday, and weekly jobless claims on Thursday—all paving the way for the most crucial event of the week: the April Non-Farm Payrolls (NFP) report, to be released Friday morning.
Beyond these reports, several major events are scheduled in the economic calendar: Canada’s federal election on Monday, the U.S. Consumer Confidence Index on Tuesday, preliminary first-quarter GDP data, pending home sales figures, and the Bank of Japan’s monetary policy decision on Wednesday, followed by the U.S. ISM Manufacturing PMI on Thursday—all of which could impact market sentiment.
On another front, the China Gold Association reported that gold consumption fell by 5.96% in the first quarter of 2025, reaching 290,492 tons. Although gold jewelry demand declined by 26.85%, investment-related gold demand surged by 29.81%, reflecting investors’ pursuit of safe assets amid economic and geopolitical uncertainty.
Domestic gold production in China increased by 1.49%, and assets held in gold ETFs rose sharply by 327.73%, indicating heightened financial caution among Chinese consumers in 2025.
A recent report from Goldman Sachs suggests that the downward trend of the U.S. dollar is far from over and that the currency remains significantly overvalued. Jan Hatzius, the bank’s chief economist, stated that despite the dollar’s recent 5% drop, it still stands roughly two standard deviations above its long-term real average since 1973. Historically, such levels have marked the beginning of multi-year correction cycles for the dollar.
Similar patterns occurred during the mid-1980s and early 2000s when the U.S. dollar experienced declines of around 25% to 30% following such valuations. Based on this, Goldman Sachs expects a similar scenario to unfold in the coming years.
One of the key structural factors fueling this anticipated correction is the portfolio composition of global investors. Specifically, non-U.S. investors hold about $22 trillion worth of assets in the United States, roughly one-third of their total portfolios.Half of these investments are unhedged against currency risk, which could lead to sharp fluctuations in the currency markets if investor sentiment shifts.
Goldman Sachs analysts believe that even a modest reallocation of global capital away from U.S. assets could significantly lower the dollar’s value. Therefore, they view the dollar’s gradual yet sustained decline not as a temporary fluctuation, but as a long-term structural trend.

XAU/USD 28 April 2025 Intraday AnalysisH4 Analysis:
-> Swing: Bullish.
-> Internal: Bullish.
Analysis and bias remains the same as analysis dated 23 April 2025
Price has now printed a bearish CHoCH according to my analysis yesterday.
Price is now trading within an established internal range.
Intraday Expectation:
Price to trade down to either discount of internal 50% EQ, or H4 demand zone before targeting weak internal high priced at 3,500.200.
Note:
With the Federal Reserve's dovish stance and persisting geopolitical uncertainties, heightened volatility in Gold is expected to continue. Traders should proceed with caution and adjust risk management strategies in this high-volatility environment.
Price could also be driven by President Trump's policies, geopolitical moves and economic decisions which are sparking uncertainty.
H4 Chart:
M15 Analysis:
-> Swing: Bullish.
-> Internal: Bearish.
Analysis and Bias remains the same as analysis dated 24 April 2025.
Price printed as per my note yesterday whereby I mentioned that we should be surprised if price printed a bearish iBOS as all HTF's require a pullback.
Price subsequently printed a bearish iBOS which confirms internal structure.
Intraday Expectation:
Price has traded up to just short of premium of internal 50% EQ where we are seeing a reaction. Price could potentially trade further into premium of 50%, or H4/M15 nested supply zone before targeting weak internal low priced at 3,260.190.
Note:
With the Federal Reserve maintaining a dovish stance and ongoing geopolitical tensions, volatility in Gold prices is expected to remain elevated. Traders should exercise caution, adjust risk management strategies, and stay prepared for potential price whipsaws in this high-volatility environment.
Trump's tariff announcement will most likely cause considerably increased volatility and whipsaws.
M15 Chart:

Clear shot towards 3250Watch the weekly Episode multitime detailed analysis why we're heading to bearish cycle.
What possible scenario we have?
Bullish scanario:
Currently market Is below the 3320 ,I'm expecting opening of market will rise Gold upto 3350-60 area which will be almost 400 pips.
Additionally if market again surpass 3360-3370 then ready for the next new ATH above 3500.
Bearish Scenario:
On the other hand, 3360-70 multiple rejection resistance cluster, where we have to wait for the candle closing below for selling opportunity towards 3250 for intraday target.
