HCH in XAUUSD?It looks like we are going to witness a possible bearish HCH in gold! The key level is 3260. If it is broken, the outlook is bearish in the short term. In the medium to long term, the outlook depends on what happens with this level and the geopolitical environment.
GOLD trade ideas

Golden times!Gold is not done yet, imo. 5k is in play. Hard assets like Gold and Bitcoin are becoming a safe haven.

Gold forms a top patternOn the H4 chart, the gold price chart is forming a clear bearish structure after forming a three-peak pattern in a row around the $3,435–$3,470 range. Each time the price touches this range, it is strongly rejected, indicating that selling pressure controls the market. The fact that the price cannot maintain above the EMA34 and EMA9 at the same time is also a sign of confirmation of a weakening trend in the short term.
Although gold recovered slightly to the $3,365 range in the Asian session on April 25 thanks to news of PBOC money injection and a weakening USD, the buying pressure was not enough to break the bearish structure. The price quickly reversed and fell below the $3,300 mark, confirming the possibility of further correction in the near future.
Currently, the price has cut below the two EMAs and broken the nearest bottom at $3,290, triggering a bearish signal according to the “small head and shoulders” pattern on the H4. The next target is the strong support zone of $3,180–$3,220. If this zone is broken, the correction trend may extend deeper to the $3,100 area.
The appropriate short-term strategy at this time is to wait for the price to retrace to the $3,310–$3,330 area, cut losses above $3,350 and take profits around $3,200. The bullish scenario will only happen if the price breaks above $3,370 and closes above the old resistance – then the bearish structure will be broken.

GOLDEntering gold trades when I observe strong buying activity in the market.
I take no responsibility for the sharing or use of these ideas.

Gold?
Hi,
If Tomorrw it trades around 3283.
I will be looking at long term Sell.
Get ready to unloads of gold profits.
Trend would be for few weeks to 3mo.
(My plan)
Not a guru. My 2cents
All the best

$XAUUSD - An Ending Diagonal Pattern..Potential Peak in place following a completed five-wave advance with an ending diagonal in the fifth-wave position. The uptrend has indeed entered its mature stage.

Emas masih turun lagi.Gold always obeys the 200 EMA, taking the inductmemt first before turning up again

GOLD USDHI GUYS.
well here gold hopefully will sell soon i expect double top h4,h2 h1 chart for sell entries . if it doesn't happen and gold dumps without pull back we wait because investors are waiting for it to sell down and confirm the daily trend chart pattern and div on RSI for second confirmation for buys some time next month. so u can either be patient and let gold sell or dump down or grab entries when situation presents itself

Has the GOLD trend reversed?Technically, gold failed to challenge the 3500 mark, and the daily chart formed a bearish pattern. It closed at 3380 yesterday, and opened lower in the Asian session and fell to 3312.6. Now it has recovered the gap of 3380.
At present, the price of the daily chart retreated to the MA7 daily moving average of 3320 and then rebounded to repair. The RSI indicator turned downward after continuous overbought and divergence. The monthly and weekly RSI indicators are both in the overbought area above the high 80 value.
The price of the short-term four-hour chart broke through the middle track of the rising channel Bollinger band at 3382, and the moving average formed a dead cross near 3420. The RSI indicator also turned downward after being overbought. The top pattern signal of gold appeared, and the price trend changed. The trading idea is to sell at a rebound high.
Yesterday, the bullish strength of gold was insufficient. The US market directly retreated more than 120$ from the intraday high of 3500. The rise was as fierce as the fall. The recent fluctuations are relatively large. You must pay attention to risk control when trading. The market is always there and there will be no lack of opportunities. Please be cautious about the current market.
The 4-hour inverted V reversal, the gold 1-hour moving average also began to show signs of turning. The market is changing rapidly. Gold retreated 188$ from 3500, so the bullish trend of gold is temporarily over.
The easing of gold risk aversion is the main reason for the decline. Gold opened directly at a low gap in the Asian session. Now after filling the gap, if gold cannot continue to rise, then the gold bears will continue to exert their strength. The current gap resistance of gold is at the 3383 line, but the current market is volatile. If the gap is filled, gold may still have momentum to repair in the short term, so you can pay attention to the suppression of the 3400 line. For the Asian session, gold can be sold first in the rebound resistance area.
Key points:
First support: 3356, second support: 3342, third support: 3323
First resistance: 3383, second resistance: 3400, third resistance: 3412
Operation ideas:
Buy: 3327-3330, SL: 3318, TP: 3350-3360;
Sell: 3397-3400, SL: 3412, TP: 3380-3370;

XAUUSDI think GOLD gonna go that way. Take these lows and then go up. Use small lot. Do your own research. Thank me later.
This is not financial advice.

Gold can exit from wedge and drop to support levelHello traders, I want share with you my opinion about Gold. Price action on Gold has shown strong bullish momentum earlier, as it broke out of the previous upward channel and started forming an upward wedge. The rally gained traction once the price left the buyer zone between 3006 - 3025 points, pushing through multiple resistance levels and creating a new structure of higher highs. After the breakout from the wedge’s support line, the price continued to grow and eventually reached the upper boundary of the wedge pattern. Here, we saw a clear reaction and reversal, signaling potential exhaustion among buyers. Currently, the price is trading just below the upper wedge resistance and has already made a pullback after the latest local high. Given this structure and the fact that the wedge pattern is tightening, I expect gold to reverse again and decline toward 3270, which is my first TP. If pressure continues, the price may drop to the 3210 current support level as TP2. The reaction from the upper wedge boundary, combined with weakening momentum and a strong support area below, supports my bearish outlook for now. Please share this idea with your friends and click Boost 🚀

GOLD Bullish Bias! Buy!
Hello,Traders!
GOLD is trading in a strong
Uptrend and the price is
Making a local bearish correction
So after it retests the horizontal
Support level below around 3344$
We will be expecting a rebound
And a further bullish move up
Buy!
Comment and subscribe to help us grow!
Check out other forecasts below too!
Disclosure: I am part of Trade Nation's Influencer program and receive a monthly fee for using their TradingView charts in my analysis.

Gold initiates its trajectory toward the $4,000 markGold (XAU/USD) has confirmed a major bullish breakout from a long-term Cup and Handle formation, pointing to a macro target of $4,044.90. While price approaches immediate resistance at $3,404.72, the bullish structure remains intact above the breakout support zone. A retracement towards ISL or SL zones could offer potential re-entry opportunities in line with the prevailing uptrend.

XAUUSD Weekly ViewGold prices have soared to a new record high of $3,500 per ounce, fueled by a weakening U.S. dollar and escalating concerns over Federal Reserve policies and trade tensions. The dollar index has fallen to 98.164, prompting investors to seek refuge in gold as a safe-haven asset. This surge reflects a strong bullish sentiment, with traders buying into the rally despite traditional overbought indicators.
- Analysts are now eyeing a potential temporary pullback for gold and profit taking.

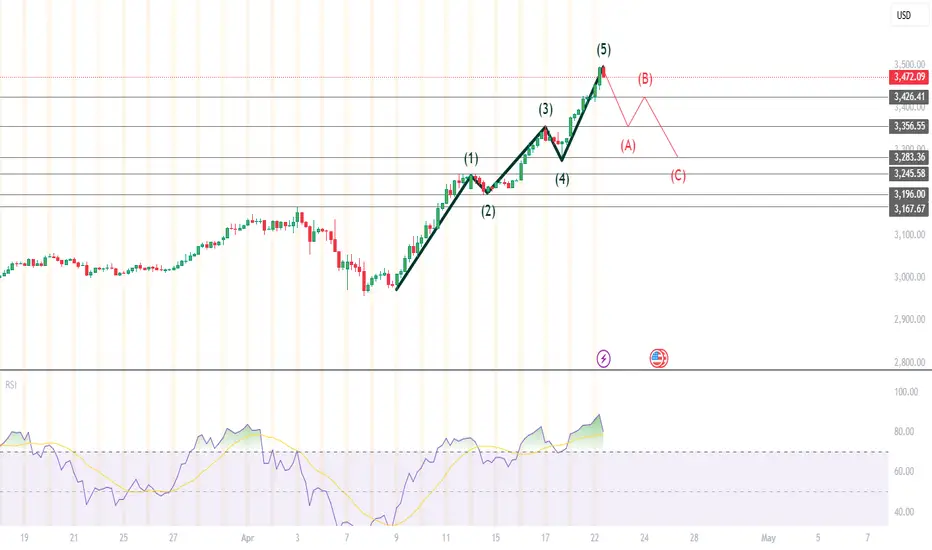
GOLD (XAU/USD) : Finally time for a correction Technical Analysis:
1.) Elliott Wave 5-wave impulse is complete.
2.) RSI is overbought (typically >70 on most platforms) — this often signals a momentum slowdown and coming reversal.
Thus,
The Market is likely about to shift into corrective mode → A-B-C pullback, as you’ve sketched.
Market Psychology:
At Wave (5) + Overbought RSI, the psychology is typically:
Retail traders rush to buy the top.
Smart money prepares to exit or short.
Trigger events (fundamental catalysts) are only needed for acceleration, not for reversal to start.
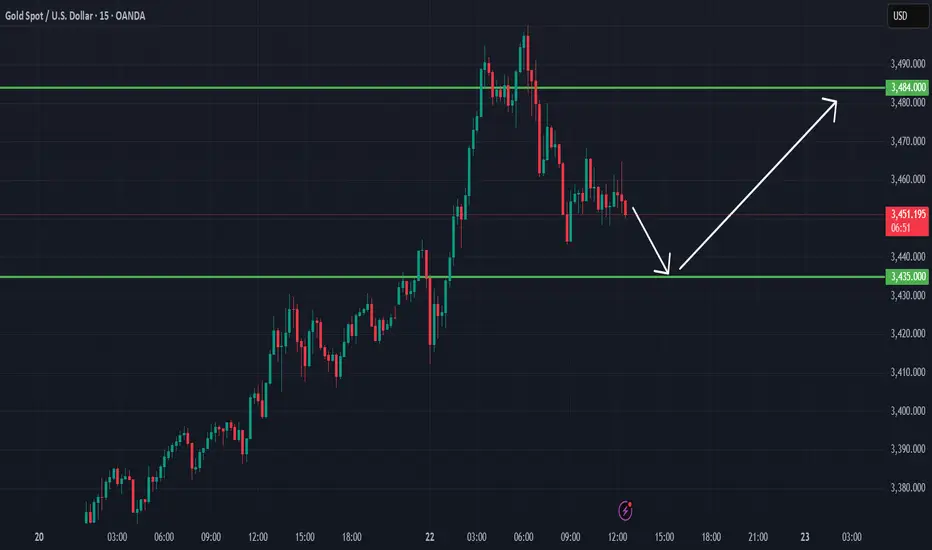
Gold Price Outlook (22nd April 2025) – Short-Term Move Expected 📉 Gold Price Outlook – Short-Term Move Expected
Gold is currently trading around $3452. We're anticipating a dip towards the $3435 area in the short term as part of a corrective move. This zone could act as a potential support level, where buyers may step in.
Following this expected pullback, we’re looking for a bounce back up toward the $3484 area, targeting a short-term bullish recovery.
📊 Key Levels to Watch:
Support Zone: $3435
Resistance Target: $3484
As always, manage your risk accordingly and watch for price action confirmation at these levels.
Today's market closing of Gold is very important ! XAUUSDToday's market closing of Gold is very important. If it is closed above the 3405 level then we can it further above 3500 level. If it closes below 3385 level, then it can find support near 3260 level.
Lets see and be patient.

Bearish drop?XAU/USD is rising towards the resistance level which is a pullback resistance that aligns with the 38.2% Fibonacci retracement and could reverse from this level to our take profit.
Entry: 3,419.43
Why we like it:
There is a pullback resistance that lines up with the 38.2% Fibonacci retracement.
Stop loss: 3,458.51
Why we like it:
There is a pullback resistance level that is slightly above the 61.8% Fibonacci retracement.
Take profit: 3,355.45
Why we like it:
There is a pullback support level that is slightly below the 61.9% Fibonacci retracement.
Enjoying your TradingView experience? Review us!
Please be advised that the information presented on TradingView is provided to Vantage (‘Vantage Global Limited’, ‘we’) by a third-party provider (‘Everest Fortune Group’). Please be reminded that you are solely responsible for the trading decisions on your account. There is a very high degree of risk involved in trading. Any information and/or content is intended entirely for research, educational and informational purposes only and does not constitute investment or consultation advice or investment strategy. The information is not tailored to the investment needs of any specific person and therefore does not involve a consideration of any of the investment objectives, financial situation or needs of any viewer that may receive it. Kindly also note that past performance is not a reliable indicator of future results. Actual results may differ materially from those anticipated in forward-looking or past performance statements. We assume no liability as to the accuracy or completeness of any of the information and/or content provided herein and the Company cannot be held responsible for any omission, mistake nor for any loss or damage including without limitation to any loss of profit which may arise from reliance on any information supplied by Everest Fortune Group.

DeGRAM | GOLD Preparing to Take $3520📊 Technical Analysis
Gold couldn’t clear $3 500 and is drifting toward $3 430 support.
💡 Fundamental Analysis
Central banks keep buying— 333 t in Q4 ’24 and still rising in April ’25.
The dollar just hit a 3‑yr low on Fed‑credibility fears.
Real yields have slipped, restoring gold’s carry appeal.
IMF warns tariff tensions could chill growth, fuelling hedge demand.
Street targets climb: GS sees $3 700–4 500, JPM $3 000+.
✨ Summary
Technicals flag a pullback, yet fresh central‑bank demand, a weaker USD, lower real yields and escalating trade risks add upside torque—any bounce off $3 430 could retest $3 520.
-------------------
Share your opinion in the comments and support the idea with a like. Thanks for your support!

Gold soaring on Fundamental pressure / Buy every dipTechnical analysis: Gold has gone into Asian session Buying rally continuation and having been slightly disconnected on it’s Technical background and especially correlation with DX, Bond Yields are Trading near local High’s (Bullish Gap fill) which is a mix which pushed Gold north aggressively and invalidated Selling potential prior every local High's. Sellers once again underestimated the Bullish potential of the recent Buying leg as Gold’s Price-action is isolated within healthy Ascending Channel on most of the charts. As long as aggressive Volatility lasts, and the probability of doing so is High as April is projected to be Bearish Month regarding DX, Gold will represent decent Short and Medium-term Buying option. If by some intervention DX start trending upwards (so far struggling to make Bullish comeback and finding meaningful Support or in general more stable Support zone), uptrend on Gold will be stalled but for now #3,500.80 benchmark is and should probably be next Gold’s most viable Target if DX don't deliver new full bodied positive candle. Daily chart’s curve for now holds Buying bias and usually this Technical setup points to new Bullish break-out.
My position: I have expected Gold to form a Top near #3,392.80 - #3,400.80 however since Price-action invalidated my potential reversal zone and closed the market above #3,400.80 benchmark, I continue Buying Gold all the way with #3,500.80 benchmark as new potential Ultimate Top's zone. Keep in mind that as long as DX is Trading on disappointing numbers, Medium-term Selling reversal on Gold will be postponed.

Will the price of gold collapse today? NoWill the price of gold collapse today? No
When an avalanche occurs, no snowflake is innocent
When gold falls, no long player is innocent
As shown in the four-hour cycle:
In order to make everyone feel the changes in trends and emotions more intuitively,
I have drawn almost all the center dividing lines.
The current gold price is approaching $3,500,
The trend line has changed from 1-6 lines, and the rise has been out of control.
But the more this trend continues in the short term, the more it means that the rise in gold prices has deviated from the fundamentals.
It is more like a product of emotional catalysis.
Everything will reverse when it reaches the extreme.
Such a trend indicates that a wave of selling is coming.
I am not asking you to short,
but reminding you to be alert to the super waterfall callback that may occur at any time.
We have made a profit of nearly 500 points from 3,000 points to now. As a professional trader, I have only made less than 200 points in the past two weeks.
This means that I am always worried about the huge pressure brought by high-level selling.
At present, no matter from the perspective of structure, support level, increase, volume, ratio, angle, channel and other indicators, the price of gold has completely exceeded the expected rise.
Yesterday I expected it to rise to 3450 points, and today it is close to 3500 points.
Next, I think waiting is the wisest choice.
Of course, you can try to short with a light position near 3500. Please keep a light position and set a stop loss.
Current support level: 3400-3440--3470
Old rules:
As long as the price of gold is higher than 3440, there is only one choice: continue to go long, wait for a decent waterfall as much as possible, and then go long at a low price.
If you have a different opinion, you can leave me a message and we will discuss it together

GOLD New Scenarios Available , Which One You Prefer ? Here is my new update on Gold , now the price create new res 3500.00 and move to downside very hard after give me 1300 pips from the entry i shared with you , so now we have 2 scenario , first one the price will retest 3450.00 and then go up again to hit 3550.00 or the price can close today below 3450.00 and give us some bearish movement , so i`m waiting for confirmation to choose which direction we can go with , tell me your opinion on the comments .

XAUUSD: 22/4 Today's Market Analysis and StrategyGold technical analysis
Four-hour chart resistance: 3500-3550, support: 3400-3380
One-hour chart resistance: 3500, support: 3430
30-minute chart resistance: 3480, support: 3440.
Tariff policy drives gold up, and it is clear that the recent technical analysis of gold trends has failed. Just follow the market. London market/NY market pays attention to the trading range (3430-3480), first sell high and buy low at the edge of resistance and support, and if the resistance and support are quickly broken, follow the trend.
Buy: 3430near SL: 3425
Sell: 3480near SL: 3485
Use small size transactions.
