surpassing the old peak, gold price will reach above 3400 soon⭐️GOLDEN INFORMATION:
Gold price (XAU/USD) resumes its upward momentum, climbing to a fresh all-time high around $3,375 during Monday’s early Asian session, as markets reopen following the extended holiday weekend. The surge comes amid renewed investor appetite for safe-haven assets, fueled by ongoing geopolitical tensions and lingering uncertainty surrounding US President Donald Trump’s aggressive tariff agenda.
With fears mounting over the broader economic fallout from escalating trade conflicts, gold has soared over 25% year-to-date. “In today’s environment of intensifying tariff ambiguity, slowing global growth, sticky inflation, and rising geopolitical risks, the strategic case for increasing gold exposure has never been stronger,” noted analysts at UBS, emphasizing a shift toward diversification away from US assets and the US Dollar.
⭐️Personal comments NOVA:
Big increase, gold price continues to rise thanks to tariff momentum
⭐️SET UP GOLD PRICE:
🔥SELL GOLD zone : 3404- 3406 SL 3409 scalping
TP1: $3395
TP2: $3380
TP3: $3370
🔥SELL GOLD zone : 3415- 3417 SL 3422
TP1: $3405
TP2: $3390
TP3: $3370
🔥BUY GOLD zone: $3357 - $3355 SL $3350
TP1: $3365
TP2: $3380
TP3: $3405
⭐️Technical analysis:
Based on technical indicators EMA 34, EMA89 and support resistance areas to set up a reasonable BUY order.
⭐️NOTE:
Note: Nova wishes traders to manage their capital well
- take the number of lots that match your capital
- Takeprofit equal to 4-6% of capital account
- Stoplose equal to 2-3% of capital account
GOLD trade ideas

XAUUSD trade idea for upcoming week Current Situation:
: Price is around 3326
: There’s a strong previous uptrend, and now price is recovering from a recent dip.
Trade Setup Explanation :
Bullish Phase (Short-Term Buy Idea)
: First Buy Zone: Current price up to the all-time high zone around 3355.
: The chart anticipates a short-term bullish push, likely to retest the ATH area.
: This zone is considered a liquidity grab or “trap” area, where price could reject and reverse.
Main Sell Zone:
> Sell Zone Identified: 3355–3360 area.
> This is a key resistance zone with:
> Previous multiple rejections (marked by red arrows).
> It's also where sellers are expected to be strong.
Sell Target Path:
1: TP1 = 3305 – Minor support, first logical reaction zone.
2: Price is then expected to range around 3305–3295 (highlighted in purple).
3: After consolidation, the expectation is a bearish continuation.
>>Final Target = 3255 – A major support zone and final destination of the swing short.<<

Risk aversion drives gold surging wildlyGold opened at $3,332 and closed at $3,424 yesterday, surging $92 throughout the day. The daily K-line formed a large bullish candle with minor upper and lower shadows, marking a nearly 3% gain and demonstrating a strong upward momentum.
Trump criticized Federal Reserve Chair Powell via social media, calling him a "big failure" and demanding immediate rate cuts, which intensified market uncertainty about the Fed's monetary policy and pushed the DXY lower.
The U.S. plan to impose new tariffs on solar products imported from Cambodia, Malaysia and other countries, combined with the long-term uncertainty of its comprehensive tariff policies, has fueled global risk aversion. Investors are withdrawing from U.S. dollar assets and turning to gold for hedging, serving as the core driver behind the sharp gold rally.
Overall, gold maintains a bullish trend in the long, medium and short terms, but short-term overbought correction risks need to be watched out for in technicals. It is recommended to focus on buying on dips, paying close attention to the retracement confirmation opportunity at the short-term support level of $3,440. Meanwhile, set reasonable take-profit and stop-loss levels to avoid volatility risks from chasing highs.
XAUUSD
buy@3440-3450-3460
tp:3480-3490-3500
I hope this strategy will be helpful to you.
When you find yourself in a difficult situation and at a loss in trading, don't face it alone. Please get in touch with me. I'm always ready to fight side by side with you, avoid risks, and embark on a new journey towards stable profits.

Gold Trade Plan 21/04/2025Dear Traders,
i believe price will be stop around 3440-3480 , and correction will be start to 3350-3360
If you enjoyed this forecast, please show your support with a like and comment. Your feedback is what drives me to keep creating valuable content."
Regards,
Alireza

XAUUSD 21/4/25We have another bullish run on the horizon after seeing a new all-time high placed last week and the week before. We expect nothing less than continued bullish momentum for gold.
As we mentioned in the EUR/USD markup, where price currently sits on many pairs is a relatively extended area. This means price action could pull back to more favorable pricing, especially due to the upcoming bank holidays. We know there are lower liquidity areas that may need to be filled, and if we want to follow this bullish move, we must also be prepared for a temporary dip.
As we remain bullish, we should avoid relying on short movements and instead wait for better pricing before entering long positions. As always, short-term lows may form between the last major low and the current price. If they do, those could be potential areas to buy from.
However, we must stay clear in our bias—we want to go long from any potential liquidity-driven lows, not just chase the upward move if it’s likely to retrace. Look for the high-liquidity low we've marked on our chart. If price reaches that area, it would present a highly probable zone for long trades.
Stick to your risk, let Orion lead the way, and always follow your trading plan.

GOLD MARKET ANALYSIS AND COMMENTARY - [April 21 - April 25]Earlier this week, the international OANDA:XAUUSD fell from $3,245/oz to $3,193/oz after US President Donald Trump exempted tariffs on 20 goods, including smartphones, laptops, hard drives, computer monitors and machinery used to produce semiconductors and chips. However, the US-China trade war became increasingly tense when Mr. Trump announced a tax of up to 245% on Chinese goods imported into the US, pushing the gold price to skyrocket to $3,357/oz, then adjusted down to $3,283/oz and closed the week at $3,327/oz.
Many experts believe that the unpredictable policy changes of the US President, as well as the risk of a global economic recession, especially Mr. Trump's threat to remove FED Chairman Powell...
May continue to support gold prices in the short term. In addition, the weakening of the USD has also been actively supporting the upward momentum of gold prices.
🕹SOME DATA THAT MAY AFFECT GOLD PRICES THIS WEEK:
There won’t be many important economic reports coming up next week, especially since markets will be closed on Monday for the Easter holiday.
On Wednesday, markets will get the preliminary S&P Global Composite PMI for April and new home sales data for March. On Thursday, a slew of important data will be released, including durable goods orders, weekly jobless claims and existing home sales. The weekend will close with the final report on the University of Michigan consumer sentiment index.
Markets will also be closely watching speeches from Neel Kashkari, Austan Goolsbee, Adriana Kugler and Patrick Harker, especially after notable comments from Fed Chair Jerome Powell on Wednesday.
📌Technically, gold is already deep in overbought territory, and a technical correction could be imminent before gold can move higher. Depending on the strength of the correction, gold could fall to $3,250/oz next week, followed by $3,150/oz, and then the psychological support of $3,000/oz. However, if $3,300/oz proves to be a solid support level, gold could soon break above $3,400/oz next week. It could even go as high as $3,500/oz if US-China trade tensions continue to escalate.
Notable technical levels are listed below.
Support: 3,304 – 3,300 – 3,261USD
Resistance: 3,338 – 3,372USD
SELL XAUUSD PRICE 3394 - 3392⚡️
↠↠ Stop Loss 3398
BUY XAUUSD PRICE 3243 - 3245⚡️
↠↠ Stop Loss 3239

GOLD Price Analysis: Key Insights for Next Week Trading DecisionLast week, Gold briefly hit an all‑time high of $3,357 before profit‑taking drove it back to around $3,320 zone📉
Ongoing uncertainty around US‑China trade relations and a weaker dollar drove traders into safe‑haven assets, supporting bullion bids despite the pullback.
Meanwhile, Fed Chair Jerome Powell’s hawkish speech on Wednesday capped the rally for now, though tariff risks and geopolitical tensions may continue to underpin Gold prices into the new week.
In this video, we:
🗺️ Break down the key chart levels
🔍 Highlight bullish vs. bearish setups
🚀🔻 Preview catalysts that could spark the next move
Disclaimer:
This is my personal take based on experience and what I see on the charts. It’s not financial advice—always do your own research and consult a licensed advisor before trading.
#GoldMarketAnalysis #Inflation #TradeTensions #GeopoliticalRisks #TechnicalAnalysis #GoldTrading

XAUUSD Gold Analysis | Weekly Update
Timeframes: 4H & Daily
Gold has continued its bullish momentum without significant seller pressure. Based on the geometry of the current move, new targets have been identified:
◾️ The 3670–3750 range is a key area to watch for a potential market reaction or pause.
◾️ The main bullish target for this rally is $4080 &4350
High-precision analysis, extraordinary results!

gold on sell reverse#XAUUSD price have been fully charged on bullish, its possible to continue moving up but firstly we need reverse below the third pattern.
Below 3395 on 2 times breakout sell, Target 3366, stop loss 3410.
Without 2 times breakout on the limit price can move bullish.

Gold has the strength to keep rising At the end of the week gold confirmed the formation of the trading range, support 3286, resistance 3356. I consider the continuation of realization of potential of false breakout of support as a positive scenario. If gold holds above 3313, the market may continue buying, which will lead to a rise to ATH
Scenario: the price is in a local descending channel, but in a global bullish trend. A bounce to 3313 from the channel resistance may occur, followed by a continuation growth to 3342 or to 3356.

Gold delivers new High's each weekTechnical analysis: I have essentially nothing new to add on my previous outlook. Since the #3,352.80 break-out point was compromised, the Price-action Naturally spiked to the #3,392.80 - #3,400.80 Resistance zone mentioned on the previous commentary. Based on the #5-session Higher High’s sequence, this zone is the new local High’s (very possible that Price-action is pricing a Top here, temporary or not) and as both the Hourly 4 chart and Daily chart are Bullish to a very great extent and does not look so good for Sellers, I should Naturally expect a correction within #2-session horizon as Wall Street opening Bell could offer Low Volumed candles without of a much Price-action. The Technical answer is the Hourly 1 chart’s Support near #3,352.80 benchmark once again, which has been always touched after every Higher High’s rejection. Gold is kept Higher on pure Fundamental gradient and weak DX (on a parabolic downtrend). The turmoil with the Inflation in U.S. causing Investors turn to capital from riskier assets for protection (safe-havens in High demand such as Gold), thus causing Gold to gain value along with Tariff's.
My position: I am satisfied with catching correction on Thursday, currently I do believe Gold is near local High's and correction is due. #3,352.80 benchmark is my Target.

Gold Price Analysis April 21Gold price is currently at ATH and trading strategy is difficult. Gold is facing the round port level of 3400 and the lower boundary is the Break out zone around 3386. Any pullback of gold is considered as an opportunity to buy 3420 can be considered as today's boundary.

Weekly Gold Analysis (XAU/USD)📊 Weekly Gold Analysis (XAU/USD)
🔍 Technical & Fundamental Insight by Shaker Trading
🟢 Bullish Momentum Continues:
Strong Uptrend:
Gold is clearly in a powerful bullish wave, with price action confirming the dominant upward momentum on the weekly timeframe.
Geopolitical & Economic Factors:
Current geopolitical tensions, along with economic uncertainty and global trade issues, continue to support safe-haven demand for gold.
Key Buy Zones Identified:
We have marked the strongest demand zones where buying opportunities are most favorable for the upcoming moves.
📌 Outlook:
We expect the bullish momentum to continue. Any pullback toward the marked zones may offer high-probability long entries.
🔥 Copy Trading for Free
Let us handle the analysis and execution – you just follow and earn.

GOLD - After upward movement, price can correct to support areaHi guys, this is my overview for XAUUSD, feel free to check it and write your feedback in comments👊
After a long, steady climb inside a rising channel, Gold pushed through local resistance and gained momentum.
The move extended beyond the channel's top, marking a fresh high near $3240 points, attracting strong attention.
But after this sharp push, the price began losing steam and rolled into a soft pullback phase.
Now, Gold is holding just above the $3160 area, retesting the zone that was previously broken upward.
Volume is slowing down, and the price action shows hesitation without follow-through on the upside.
I believe Gold could roll over from here and revisit the $3130 support area in the coming sessions.
If this post is useful to you, you can support me with like/boost and advice in comments❤️

Gold (XAU/USD) Multi-Timeframe Technical Outlook
Multi-Timeframe Analysis – Gold (XAU/USD)
⸻
1H Chart – Bullish Continuation Potential
On the 1-hour chart, Gold is trading within a defined channel structure after reaching an all-time high (ATH) of 3357.775. Following this peak, the price made a shallow retracement between the 38.2% and 50% Fibonacci levels, indicating underlying bullish strength.
Currently, the price has formed a Descending Broadening Wedge — a pattern typically associated with bullish continuation. A successful breakout above the wedge’s upper boundary and the key resistance levels at 3334, 3346, and 3357 could pave the way for a rally toward the 3400 level.
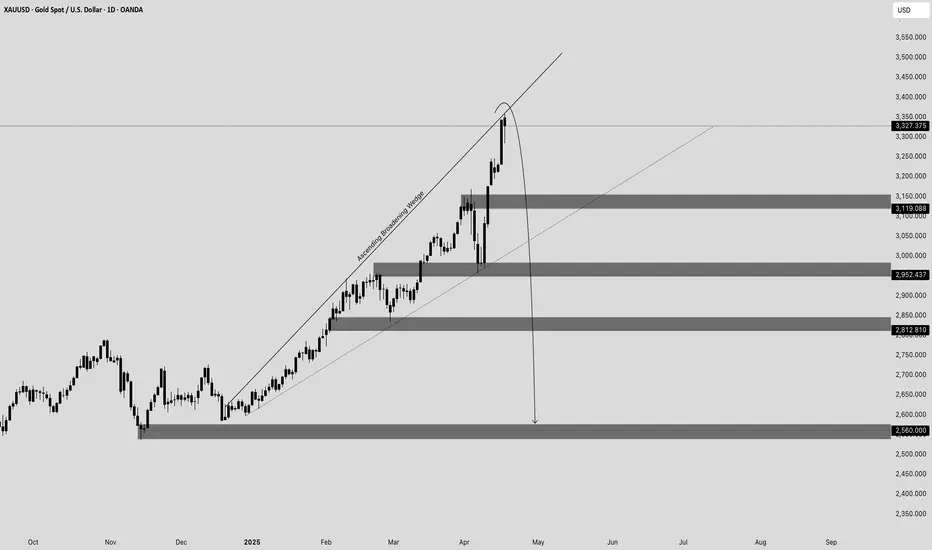
Daily Chart – Bearish Reversal Structure
In contrast, the daily chart reveals an Ascending Broadening Wedge — a known bearish reversal pattern. The price is trading near the upper region of this structure, and the measured move projection of the pattern points toward a potential decline to the 2560 area, should the bearish scenario play out.
⸻
Final Note
While short-term charts signal bullish opportunities, the daily chart reminds us of the broader reversal risks. As always, strict risk management is essential to protect capital and lock in profits in both trending and volatile conditions.
⸻
Happy Trading,
SpicyPips
Gold bull cycle continues, 3400✍️ NOVA hello everyone, Let's comment on gold price next week from 04/21/2025 - 04/25/2025
🔥 World situation:
Gold prices are poised to close the week on a strong footing, gaining over 2.79% as the precious metal surged nearly $90 amid continued US Dollar (USD) weakness driven by lingering global trade uncertainties. At the time of writing, XAU/USD is trading around $3,326.
Despite touching a fresh all-time high of $3,358, the rally has cooled slightly as traders lock in profits ahead of the extended Easter weekend, with both European and US markets closed. Meanwhile, real yields have ticked higher, offering a modest headwind. On the policy front, San Francisco Fed President Mary Daly noted that the US economy remains resilient, though some segments are showing signs of slowing. She emphasized that monetary policy is still restrictive enough to keep inflation in check, while also suggesting that neutral rates could be on the rise.
🔥 Identify:
Gold price is still in a big uptrend, short-term corrections only make gold price accumulate more and continue to reach new ATH, tariffs are tense, gold price continues to increase strongly: 3382, 3400
🔥 Technically:
Based on the resistance and support areas of the gold price according to the H4 frame, NOVA identifies the important key areas as follows:
Resistance: $3357, $3382, $3400
Support : $3284, $3236, $3155
🔥 NOTE:
Note: Nova wishes traders to manage their capital well
- take the number of lots that match your capital
- Takeprofit equal to 4-6% of capital account
- Stoplose equal to 2-3% of capital account
- The winner is the one who sticks with the market the longest

DON'T Make This MISTAKE in MULTIPLE TIME FRAME Analysis
Most of the traders apply multiple time frame analysis incorrectly . In the today's article, we will discuss how to properly use it and how to build the correct thinking process with that trading approach.
The problem is that many traders start their analysis with lower time frames first . They build the opinion and the directional bias analyzing hourly or even lower time frames and look for bullish / bearish signals there.
Once some solid setup is spotted, they start looking for confirmations , analyzing higher time frames. They are trying to find the clues that support their observations.
However, the pro traders do the opposite .
The fact is that higher is the time frame, more significant it is for the analysis. The key structures and the patterns that are spotted on an hourly time frame most of the time will be completely irrelevant on a daily time frame.
In the picture above, I underlined the key levels on USDJPY on an hourly time frame on the left.
On the right, I opened a daily time frame. You can see that on a higher time frame, the structures went completely lost.
BUT the structures that are identified on a daily, will be extremely important on any lower time frame.
In the example above, I have underlined key levels on a daily.
On an hourly time frame, we simply see in detail how important are these structures and how the market reacts to them.
The correct way to apply the top-down approach is to start with the higher time frame first: daily or weekly. Identify the market trend there, spot the important key levels. Make prediction on these time frames and let the analysis on lower time frames be your confirmation.
❤️Please, support my work with like, thank you!❤️
I am part of Trade Nation's Influencer program and receive a monthly fee for using their TradingView charts in my analysis.

BULLISH MOMENTUM IS STILL ACTIVE ON GOLD!Price continues to trade new highs in the past trading week. The bullish momentum is still growing and we’re anticipating price to trade upto a new high of $3414 in the coming week. A buy opportunity is envisaged once we see a consolidation above the $3329.84 level.
Technically, price quickly rebounded off the bullish trendline which validated more buy opportunities once we see price consolidate above the $3329.84 level

THE KOG REPORT - UpdateEnd of day update from us here at KOG:
Due to the holiday weekend we've taken it easy on the gold, only one short over for a fantastic capture and that's us done for the week.
Some levels to look for:
3224-26 resistance needs to break to go higher.
3280 needs to break to go lower.
Today's bias and red boxes, still apply:
RED BOXES:
Break above 3335 for 3340, 3347, 3350 ,3356 and 3374 in extension of the move
Break below 3320 for 3310✅, 3307✅, 3296✅, 3290✅ and 3277 in extension of the move
KOG's Bias of the day:
Bearish below 3335 with targets below 3310✅, 3306✅, 3300✅ and 3293✅
Bullish above 3335 with targets above 3340, 3349, 3353 and 3360
Wishing you all a great holiday weekend and we'll see you next week for the KOG Report.
As always, trade safe.
KOG

GOLD (XAUUSD): Trend-Following Setup ExplainedI spotted a bullish flag pattern on ⚠️Gold pair.
After reaching a new higher high, the price corrected within an expanding channel
To catch the next bullish move, I'm waiting for a bullish breakout of the flag's resistance.
We need a 4H candle close above that to confirm the breakout.
Target will be 3360

GOLD Resistance Cluster!
HI,Traders !
GOLD made a bullish
Rebound But has now hit a resistance
Cluster of the horizontal and
Falling resistance lines
Around 3335.31 area
From where we will be
Expecting a bearish move down!
Comment and subscribe to help us grow !

Gold Levels So Clean, They Might Just Slap Your Algo🔥 “Gold Levels So Clean, They Might Just Slap Your Algo 🤖💥”
📅 Daily XAUUSD Plan – April 23, 2025
🎯 Structure & Key Levels Only – Just Real Market Logic
🧭 MARKET CONTEXT
HTF Bias: Still bullish, but currently in corrective phase after blow-off at ATH
LTF Flow: Bearish (M30–H1 CHoCH + BOS confirm premium-to-discount transition)
Current Price: 3379
Macro: No major USD catalyst today – price driven by structure, liquidity, sentiment
🔻 SELL ZONES – PREMIUM
Zone Price Range Type Confluences
💣 3448–3455 Major HTF OB Zone Extension Trap Fibo 1.618 + Premium OB + Liquidity above Weak High
🧨 3415–3422 LTF OB + Trap Zone Retest Area Last mitigated OB + NY Session liquidity grab
⚠️ 3385–3395 Intraday Flip Zone Bull/Bear Pivot EMA5 Lock + Rejection Block + Mid-Structure Flip
🟢 BUY ZONES – DISCOUNT
Zone Price Range Type Confluences
🟢 3365–3372 LTF Demand Zone Current Price Demand + RSI bounce + Reaction Box
💚 3333–3340 Valid HTF OB High Confidence Unmitigated OB + HTF FVG + Historical Support
🔋 3284–3288 Sniper Reentry HTF Demand Base Previous buy zone + Structure Support + Clean OB
🧱 3220–3235 HTF Reversal Area Extreme Discount Long-term support + Weekly structure demand
🔍 STRATEGY INSIGHT
3385–3395 = the line between bull & bear → key for session reclaim or rejection
3415–3422 is the best intraday sell if price spikes fast — protect with structure
3333–3340 holds real weight → HTF bounce territory for potential reversal
If price nukes to 3284, expect serious buy interest (structure-supported reentry zone)
💬 Final words :
“Clean structure. Clean zones. Clean mind.
Gold doesn’t wait. Know your levels. React smart. 🧠✨
If this helped, drop a comment or follow – more sniper plans daily.”

Gold Target $4054 Year 2025-2026 With Reasons & 4$rules.1st Tp completed at 3341
2nd Tp 3437
3rd Tp 3622
4th Tp 3747
Final target is $ 4054 for Year 2025 to 2027
Below the Base line mentioned in chart will be the Seller profit zone which is marked as 1st Support, 2nd Support, 3rd Support & 4th Major Support.
Current Major reasons mentioned in the chart and future will be running of food, drinking water crisis and health issues will remain on high alerts (after covid 19 and pollution issues) and Insurance companies profits will be on Top of every Monthly trading results.
