XAU/USD: Bull or Bear? (READ THE CAPTION)By analyzing the gold chart in the 1-hour timeframe, we can see that the price managed to register a new high at $3245, but after that, it was followed by a correction and created a change in market structure. I expect that if the price stabilizes below $3213, it will be accompanied by further decline.
The targets are respectively $3187, $3177, $3155, and $3138.
Please support me with your likes and comments to motivate me to share more analysis with you and share your opinion about the possible trend of this chart with me !
Best Regards , Arman Shaban
GOLD trade ideas

Gold 2025: The Asset of Last Trust - Deep Research by EXCAVOThe Influences on Gold Prices in 2025
As of 2025, gold continues to assert its status as a safe-haven asset, with prices accelerating dramatically. This surge is driven by economic uncertainties, increased central bank demand, and geopolitical tensions. The analysis focuses on the multifaceted factors influencing gold prices, including inflation fears, a declining U.S. dollar, and recent debates surrounding Fort Knox's transparency.
I've delved a bit into the gold landscape and will provide ideas here aimed at helping investors and analysts navigate the complexities of the gold market.
The Current Economic Climate and Its Impact
Recent developments in global economic conditions have laid the groundwork for significant fluctuations in gold prices in 2025. Economic volatility, primarily driven by fears of inflation and weakening currencies, has led investors and central banks to increasingly view gold as a reliable hedge against financial instability. The aftermath of trade disputes, particularly between major economic powers, has further intensified these economic shifts.
Globally, economic growth forecasts for 2025 have been downgraded significantly. According to Fitch Ratings, the world economy is expected to grow by just 2.3%, down from previous estimates of 2.9%. This deceleration is attributed to extensive tariffs imposed by the United States, leading to broader global economic uncertainty. The United States itself is seeing a contraction in growth expectations, with projections cut to 1.7% amid these tensions. Inflation in the U.S., driven by increased tariff costs, is another immediate concern, marking a sustained presence at around 3%
The U.S. dollar, although currently strong, is predicted to depreciate due to ongoing inflation and economic stagnation, despite current high real trade-weighted indices—the highest since the 1980s. This depreciation trend, anticipated by analysts, could significantly impact currency markets worldwide, putting pressure on countries with high dollar exposure S&P Global.
In this environment of weakening currency strength and persistent inflation, gold serves as the optimal hedge. Although the role of gold isn't directly covered in some of the current economic reports, it remains a traditional safe haven during tumultuous times—a response to the depreciation of currency values and the pervasive fear of inflationary spirals that affect purchasing power and savings CFA Institute.
The global shift away from excessive reliance on the dollar reflects a broader strategy by some nations to safeguard their economies against the capricities of prevailing geopolitical circumstances. This shift may lead to increased gold purchases by central banks, aiming to stabilize financial reserves in light of uncertain future economic policies. As inflation fears continue to wear on investor confidence, gold’s relative safety seems set to keep its allure in the modern financial landscape.
Geopolitical Forces Shaping Gold Prices
Geopolitical tensions in 2025 remain potent catalysts driving the dynamics of gold prices. As international relations remain strained, especially between leading economies, the markets have been exceptionally responsive to developments that unsettle the economic landscape. One critical component in this scenario is the burgeoning U.S.-China trade conflict, which saw tariffs climb to an unprecedented 145% and 125% respectively, spiking gold’s appeal as a safe asset against market turmoil.
This extensive strain on trade and economic relations translates into significant instability across foreign exchange markets. A pronounced example is the substantial 8% decline in the Dollar Index, making gold an attractive alternative as its purchasing power for non-U.S. investors increases . The strategic shift by some nations away from the U.S. dollar is further evidenced by noteworthy purchases of gold by central banks as they seek to diversify their foreign exchange reserves .
Furthermore, the geopolitical climate is marked by a flight to safety among investors, reflected in the significant inflow of gold-backed exchange-traded funds (ETFs), which absorbed 227 tonnes in Q1 of 2025 alone. This highlights how geopolitical strife propels gold as both a buffer against inflation and a refuge amidst escalating equity volatilities.
Amidst these conditions, global policy adjustments also play a role. Central banks have been proactively increasing gold holdings, exemplifying a growing distrust of dollar-denominated assets. For instance, policy shifts seen with the Trump administration's enforcement of new tariffs further exacerbated market fears, as paralleled in previous periods like 2018-2020 where gold gained significant value amidst trade wars.
As geopolitical uncertainty continues to prevail, the inherent security associated with gold, coupled with mounting inflationary pressures from such tensions, suggests that gold prices may well remain heavily influenced by these forces through 2025.
Fort Knox: Transparency and Its Market Implications
Fort Knox, a symbol of American financial might, famously houses a substantial portion of the United States' gold reserves. Recent calls for transparency have surged, fueled by high-profile figures such as Elon Musk and Donald Trump. This movement seeks to address long-standing skepticism surrounding the visibility and security of these reserves. Fort Knox's vaults hold approximately 147 million ounces of gold, valued at over $459 billion at today's market rates. The last independent audit of these reserves dates back several decades, to 1953, prompting increasing demands for accountability .
Elon Musk has proposed a surprising move to audit these reserves, suggesting that the audit be livestreamed. This unprecedented proposal aims to provide public visibility into the wealth residing in the Fort Knox vaults, arguing that the American populace deserves to confirm its existence. However, despite its garnering attention, this idea encounters significant security and logistical obstacles.
While the U.S. Treasury asserts that gold audits occur annually through internal procedures, skepticism remains due to the lack of external verification. Past visits, including former Treasury Secretary Steven Mnuchin's confirmation in 2017 that the reserves appeared intact, have not fully silenced doubts.
Compounding this dialogue, another proposal involves employing blockchain technology to monitor the reserves. Proponents, like NYDIG's Greg Cipolaro, posit that blockchain could enhance audit transparency despite still necessitating trust in the overseeing government entities.
The conversation surrounding Fort Knox's transparency underscores mounting tensions over governmental accountability in financial stewardship. If a comprehensive audit were confirmed, it could significantly bolster public confidence, contributing to more stable gold market conditions. Conversely, revealing discrepancies could heighten market volatility and public distrust. This transparency debate continues amid the broader conversation about economic policy and international financial stability.
Gold Price Predictions for 2025 and Beyond
Gold price predictions for 2025 highlight a growing consensus among major financial institutions that the precious metal is poised to reach new heights. With current prices hovering around $3,223 per ounce, the perspectives of Goldman Sachs, UBS, and the Bank of America offer crucial insights into the potential trajectories of gold's value.
Goldman Sachs has led the charge in bullish projections, recently upgrading their gold price forecast to $3,700 per ounce by the end of 2025. This marks the third upward revision this year due to ongoing recession risks, central bank demand, and inflows into exchange-traded funds (ETFs). The bank envisions a potential rise to $4,500 should extreme economic scenarios unfold . Their analysis highlights a growing reliance on gold as a hedge against global macroeconomic uncertainties, including geopolitical tensions and inflationary pressures .
UBS, another major player, shares this optimistic outlook by projecting gold to reach $3,500 in 2025. UBS's forecast aligns with several macroeconomic indicators, including persistent inflation and central bank demand, which remains robust as an average purchase exceeds previous years. Furthermore, UBS sees structural shifts, with entities such as Chinese insurance funds increasing their gold allocations. This shift underscores gold's strategic role as a portfolio stabilizer in uncertain economic landscapes.
The Bank of America's approach reflects a slightly more conservative position, adjusting their gold price forecast for 2025 to $3,250 per ounce. However, they emphasize significant factors driving their projections, such as central bank accumulation and the political intricacies surrounding U.S. trade measures. The bank's analysis also anticipates gold stabilization in 2025 owing to potential profit-taking, but maintains the broader bullish trajectory through 2026 and beyond .
Overall, these insights paint a vivid picture of an evolving gold market, shaped by multifaceted economic variables and featuring gold as a resilient asset and hedge amid swirling global uncertainties.
Investment Strategies in Today's Gold Market
Amidst the dynamic landscape of 2025, gold continues to offer opportunities for portfolio diversification, driven by economic uncertainty, inflationary pressures, and record-breaking prices. With the gold price surpassing $3,250 per ounce in April 2025, several factors contribute to the increased demand and strategic considerations for gold investment. Trade tensions and proposed tariffs under new U.S. policies have amplified global economic uncertainty, while persistent inflation, hovering at 2.8%, remains above the Federal Reserve's target, delaying expected interest rate cuts. Additionally, stock market volatility has prompted investors to seek diversification amidst equity downturns .
Investment strategies in today's gold market require thoughtful portfolio allocation and diversification. Experts recommend limiting exposure to gold to 7–10% of total assets. This balance ensures investors benefit from gold's non-correlation with stocks and bonds without overexposure to risk . Exchange-traded funds (ETFs) like the SPDR Gold Trust (GLD) or Sprott Gold Miners ETF (SGDM) are favored for their liquidity and ability to provide broad exposure to the gold market .
Tactical investment options also play a critical role in maximizing returns. Fractional gold investments allow access to smaller gold amounts, such as bars or coins under one ounce, making it easier to benefit from price trends without high entry costs . Gold mining stocks present opportunities for those targeting companies with strong margins, especially as costs are significantly below current market prices .
Moreover, strategic fund selection can enhance a portfolio's potential. Funds like the WisdomTree Efficient Gold Plus Gold Miners Strategy Fund (GDMN), which combines physical gold and mining equities, offer a hybrid exposure to gold investments .
The key to navigating 2025's gold market is a disciplined approach to allocation, awareness of market shifts, and strategic use of available investment options. By doing so, investors can hedge against inflation and capitalize on market volatility for potential long-term gains.
Conclusions
The year 2025 has exposed the fragility of the global financial system. Gold isn’t just a haven anymore — it’s a barometer of panic, fear, and institutional failure. When markets shake, inflation becomes chronic, and Fort Knox becomes a meme, gold rises — quietly but relentlessly.
What we’re witnessing is an institutional drift away from the U.S. dollar. Central banks are hoarding metal like they're bracing for something big. The global economy is cracking under tariffs, geopolitical chess moves, and eroding trust in the "reserve currency." At this point, $3,250 per ounce isn’t the top — it’s just another step up the ladder.
The key: gold is no longer just a defensive asset. It has become a strategic tool of sovereignty and power. Nations diversifying into gold are building economic independence. Investors stepping in now aren’t just protecting wealth—they’re gaining leverage.
My advice: keep gold in focus. Physical bullion, ETFs, mining stocks, hybrid funds — each is a puzzle piece. Gold is not hype. It’s the anchor of reason in an era where digital noise drowns out reality.
Watch zones: $3500 — then $3700+. If the global system wobbles harder, $4200 won’t be a forecast — it will be the signal that the fiat era is capitulating.
He who controls gold, controls trust. And he who controls trust… writes the script for the future.
Best regards EXCAVO
— EXCAVO

GOLD → Correction to support. What's next?FX:XAUUSD updates a new high to 3357. A correction is forming after Powell's speech. On the background of the bullish trend it is worth looking for stronger support levels
Gold halted gains at $3,358 as traders take profits and assess the implications of Trump's tariff policy.Gold's gains on the week were driven by the escalating trade war between the US and China, fears of a US recession and a flight from risk assets. However, cautious rhetoric from Fed chief Powell and positive signals from trade talks with Japan temporarily curbed further gains in gold. But the level of risks and possible escalation of the conflict is still at a high level.
It is too early to talk about the trend change. At the moment the correction to liquidity zones is forming on the background of the bullish trend. The focus is on 3296, 0.5 fibo. The price may bounce from these levels.
Resistance levels: 3344, 3457
Support levels: 3320, 3296, 3275
The correction after Powell's speech may be quickly exhausted if the politicians from China and the US fuel the conflict. But any hints of negotiations and tariff cuts could be taken very positively by the market, which could lead to a reversal of the local trend.
Regards R. Linda!

Gold Analysis April 17Another day of half-full D candle increase but today there is a bearish wave appearing
The h4 frame has shown signs of sellers jumping into the market and H1 also formed bearish waves.
The bearish wave formed with support 3322. Breaking 3322 is very easy to form a strong bearish wave but the necessary condition is that the 3315 zone will have to be broken. If 3315 increases, 3338 is the zone that the Sellers are also waiting for. 3354-3355 ATH zone will still have a reaction from the Sellers before creating a new ATH.
Trading zone when there is confirmation
Price zones to pay attention to BUY 3315, 3293, 3275
Price zones to pay attention to SELL 3337, 3354

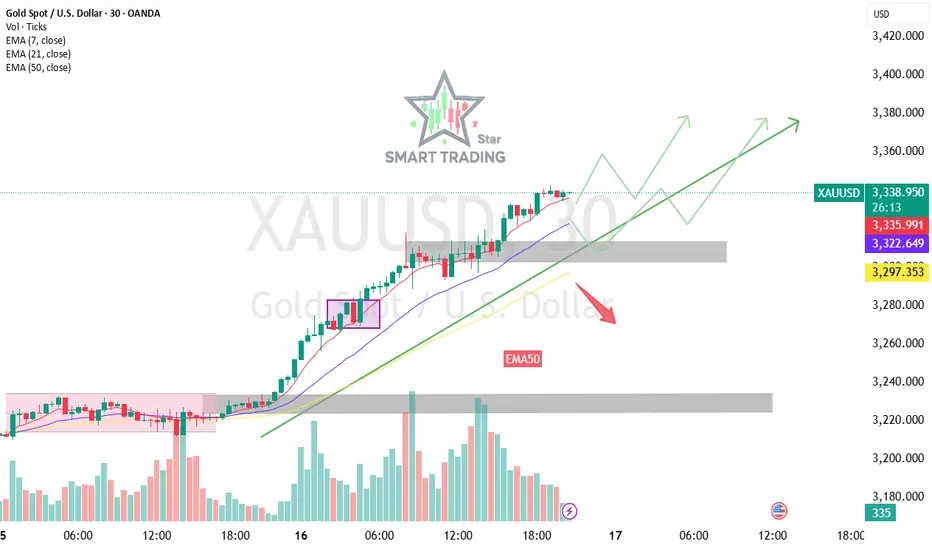
Bullish Momentum Intact (XAUUSD) LongTrend Overview: Bullish Momentum Intact
- **Current Price:** $3,336
- **Trend Direction:** Strong uptrend – higher highs and higher lows
- **Key Moving Averages:**
- EMA 7: $3,334.49 (price above – short-term momentum bullish)
- EMA 21: $3,320.83 (supportive base)
- EMA 50: $3,295.57 (strong trend support)
Bullish Scenario (Green Arrows)
- Price remains above EMAs and the rising trendline.
- Potential pullbacks may test the **support zone** near $3,320–$3,295 (gray area).
- If buyers defend the support, price could aim for **$3,360–$3,380** and beyond.
- Breakouts above local highs can signal continuation of the uptrend.
Bearish Risk (Red Arrow)
- A breakdown below **$3,295 (EMA50)** and the gray support zone could signal a trend shift.
- Downside targets could be **$3,260–$3,240** in case of heavy selling pressure.
- Watch for volume spikes on bearish candles.
Conclusion
As long as price stays above the trendline and 50 EMA, bulls remain in control. Any dips into the gray zone could present **buy-the-dip** opportunities. But a break below $3,295 flips the bias to short-term bearish.
GOLD ROUTE MAP UPDATEHey Everyone,
Once again a great day on the market today with our chart idea playing out, as analysed. This chart idea is now fully complete with our final target being completed today.
Yesterday after completing 3324 we stated that we needed ema5 lock above 3324 to open 3352. We got the cross and lock above 3324 to open 3352, which was hit perfectly completing this target and this chart idea.
We now expect a rejection on this zone and then we can continue to catch bounces from the lower Goldturns.
We will keep the above in mind when taking buys from dips. Our updated levels and weighted levels will allow us to track the movement down and then catch bounces up.
We will continue to buy dips using our support levels taking 30 to 40 pips. As stated before each of our level structures give 20 to 40 pip bounces, which is enough for a nice entry and exit. If you back test the levels we shared every week for the past 24 months, you can see how effectively they were used to trade with or against short/mid term swings and trends.
The swing range give bigger bounces then our weighted levels that's the difference between weighted levels and swing ranges.
BULLISH TARGET
3261 - DONE
EMA5 CROSS AND LOCK ABOVE 3261 WILL OPEN THE FOLLOWING BULLISH TARGET
3292 - DONE
EMA5 CROSS AND LOCK ABOVE 3292 WILL OPEN THE FOLLOWING BULLISH TARGET
3324 - DONE
EMA5 CROSS AND LOCK ABOVE 3324 WILL OPEN THE FOLLOWING BULLISH TARGET
3352 - DONE
BEARISH TARGETS
3230 - DONE
EMA5 CROSS AND LOCK BELOW 3230 WILL OPEN THE FOLLOWING BEARISH TARGET
3201 - DONE
EMA5 CROSS AND LOCK BELOW 3201 WILL OPEN THE RETRACEMENT RANGE
3179
3152
EMA5 CROSS AND LOCK BELOW 3152 WILL OPEN THE SWING RANGE
3120
3094
EMA5 CROSS AND LOCK BELOW 3094 WILL OPEN THE SECONDARY SWING RANGE
SECONDARY SWING RANGE
3069 - 3038
As always, we will keep you all updated with regular updates throughout the week and how we manage the active ideas and setups. Thank you all for your likes, comments and follows, we really appreciate it!
Mr Gold
GoldViewFX

Markets revolve around US-China, GOLD seeks new peaksAs Powell's warnings about the impact of the trade war increased market volatility, US stocks and the US dollar fell sharply and gold prices hit new highs.
Powell warned that the central bank may have less flexibility to quickly mitigate the economic impact of President Donald Trump's trade war, comments that sent stocks lower on Wednesday. Powell reiterated that the Fed is in no rush to cut interest rates and that it would be "better to wait until the situation becomes clearer before considering any adjustments to the policy stance." He also acknowledged that the Fed could face a difficult situation where its two policy goals of price stability and maximum employment conflict, as Trump's tariffs could push up U.S. inflation and slow economic growth.
OANDA:XAUUSD have risen nearly $700/ounce, or nearly 28%, this year, driven by tariff disputes, expectations of interest rate cuts and strong central bank buying, outpacing the 27% gain in 2024.
Gold prices have continued to rise as the escalating trade war raises concerns of a global recession. At the same time, the Trump administration is preparing to pressure other countries to limit trade with China in response to US tariffs in US-China trade talks.
U.S. President Donald Trump on Tuesday ordered an investigation into possible tariffs on all critical minerals imported into the United States, marking a new escalation in his dispute with global trading partners and an effort to pressure China. The latest escalation in tensions between the world’s two largest economies has hurt sentiment in financial markets overall, sending investors fleeing to safe-haven assets like gold.
However, a profit-taking or positive developments in US-China trade relations could trigger a sell-off. Therefore, readers/traders need to closely monitor developments surrounding the trade war to make timely changes in their trading plans to suit the market context.
Technical Outlook Analysis OANDA:XAUUSD
On the daily chart, gold continues to find and renew all-time highs with an absolutely supported uptrend in both the short, medium and long term. In the long term, the price channel will be set as the main trend with the main support from EMA21, while in the short term, gold is still in an uptrend with support from the 0.382% Fibonacci extension levels and the raw price point of 3,300USD right after.
In terms of momentum, the Relative Strength Index (RSI) is entering the overbought zone, a downward RSI below 80 would be considered a signal for a possible correction. Going forward, the trend and outlook for gold prices remain bullish, and declines should only be considered short-term corrections.
But this note will be important, in a market where assets (Gold) are overbought, making them a bubble, any correction will cause serious selling sentiment. As in the current context, we cannot know when the US-China war will cool down, and any positive move around this war will cause selling sentiment in the gold market, which is considered a traditional safe haven asset.
During the day, the bullish outlook for gold prices will be listed again by the following positions.
Support: 3,303 – 3,300 USD
Resistance: 3,337 – 3,371 USD
SELL XAUUSD PRICE 3396 - 3394⚡️
↠↠ Stop Loss 3400
→Take Profit 1 3388
↨
→Take Profit 2 3382
BUY XAUUSD PRICE 3309 - 3311⚡️
↠↠ Stop Loss 3305
→Take Profit 1 3317
↨
→Take Profit 2 3323

XAUUSDHello Traders! 👋
What are your thoughts on GOLD?
Gold has successfully broken above its resistance zone and the top of the ascending channel, indicating strong bullish momentum.
Two support zones have been identified below the current price. A correction toward one of these levels is expected before the next bullish leg begins.
After a pullback to one of these support areas, we expect gold to resume its uptrend and push toward higher levels and new highs.
Among the two, the second support zone is considered a safer entry point for long positions, as it may offer stronger support and a better risk-reward setup.
💡 Which support zone would you use for your buy entry? Share your thoughts below!
Don’t forget to like and share your thoughts in the comments! ❤️

Trading Smarter, Not Harder: Decoding Institutional MovesThere’s an old saying in trading: “Follow the smart money.” But how do you know where the smart money is going? The answer lies not in guesswork but in data—specifically, the kind of institutional-grade data that most retail traders overlook. If you’re serious about understanding market dynamics, it’s time to dive into the world of **COT (Commitment of Traders) reports** and **options flow data** from the **CME (Chicago Mercantile Exchange)**. These tools are like your personal radar, cutting through the noise to reveal what the big players are doing.
Step 1: Understanding the Big Picture – Why Market Sentiment Matters
Before we zoom into the specifics, let’s start with the basics. Markets are driven by sentiment—the collective mood of participants. When fear dominates, prices fall; when greed takes over, they rise. But here’s the catch: Retail traders often react to sentiment after it’s already priced in. By the time you see a headline screaming “Market Crashes!” or “Record Highs!”, the opportunity has likely passed.
This is where systematic analysis comes in. Instead of relying on emotions or lagging indicators, smart traders use raw data to anticipate shifts in sentiment. And two of the most powerful sources of this data are **COT reports** and **CME options flow**.
Step 2: The Commitment of Traders (COT) Report – Peering Into the Mind of Institutions
The **COT report**, published weekly by the Commodity Futures Trading Commission (CFTC), provides a breakdown of positions held by different types of traders: commercial hedgers, non-commercial speculators (like hedge funds), and small retail traders. Here’s why it’s invaluable:
- **Commercial Hedgers**: These are the “smart money” players—producers and consumers who use futures markets to hedge their risk. For example, a sugar producer might sell futures contracts to lock in prices. Their actions often signal future supply and demand trends.
- **Non-Commercial Speculators**: These are the momentum-driven players who bet on price movements. Tracking their positioning helps identify potential reversals.
- **Small Traders**: Often considered the “dumb money,” their positions frequently coincide with market tops or bottoms.
By systematically analyzing the COT report, you will discover your ability to identify patterns and positioning levels of participants that signal trend reversals or the onset of corrections. Seriously, this will blow your mind! The insights you gain will be so groundbreaking that they will change your trading game forever.
Step 3: Options Flow – Real-Time Insights Into Institutional Activity
While the COT report offers a macro view, **options flow** gives you real-time insights into institutional activity. Directly through CME data feeds, you can track large block trades in options markets. Here’s why this matters:
It will take some time, observation, and comparison with price charts to learn how to uncover insights that lead to trades with a risk-reward ratio of 1:10 or even higher. This isn’t about needing to make options trades; that’s not a requirement. It’s about being able to trade the Forex market much more effectively by using entry points highlighted by options and futures market reports.
For example, over the past few weeks, the USD/JPY pair has been in a downtrend. Long before this happened, major players were accumulating positions in call options on the futures for the yen (which is equivalent to a decline in the yen). We discussed this before the drop occurred (you can easily find those analyses on our page ).
What’s remarkable is that there are many such insights available. For certain instruments (like precious metals and currency pairs), these insights appear with a certain regularity and provide excellent sentiment for opening positions or reversing positions in the opposite direction.
Step 4: Connecting the Dots – From General Trends to Specific Trades
Now that we’ve covered the tools, let’s talk about how to apply them systematically. Imagine you’re analyzing the sugar futures market (a favorite among commodity traders):
1. **Check the COT Report**: In the precious metals market, commercials are often positioned short, hedging against the risk of a decline in the underlying asset's value. When their net position hovers around zero , it typically signals a bullish trend for gold prices in the vast majority of cases.
2. **Analyze Options Flow**: when filtering options by sentiment, there are several key factors to consider:
- Size and value of the option portfolio
- Distance from the central strike (Delta)
- Time to expiration
- Appearance on the rise/fall of the underlying asset
Option portfolios with names such as vertical spread, butterfly, and condor (iVERTICAL SPREAD, IRON FLY/FLY, CONDOR/IRON CONDOR) have predictive sentiment regarding the direction of the asset's price movement. While "naked" options (PUT or CALL options) with above-average volume can signal that the price is encountering a significant obstacle at that level, leading to a potential bounce off that level (support or resistance).
3 **Combine with Retail Positions Analysis**: Look for opportunities to trade against the crowd. If retail sentiment is overwhelmingly bullish, consider a bearish position, and vice versa.
This layered approach ensures you’re not just reacting to headlines but making informed decisions based on valuable data.
Step 5: Why Systematic Analysis Sets You Apart
Here’s the truth: Most traders fail because they rely on intuition rather than evidence. They chase tips, follow social media hype, or get swayed by emotional biases. But markets reward discipline and preparation. By mastering tools like COT reports and options flow, you gain a competitive edge—a deeper understanding market breath! The path of least resistance!
Remember, even seasoned professionals don’t predict every move correctly.However, having a reliable structure allows you to maximize profits from transactions, eliminate noise and unnecessary (questionable) transactions.
Final Thoughts: Your Path to Mastery
If there’s one takeaway from this article, let it be this: The best traders aren’t fortune-tellers; they’re detectives. They piece together clues from multiple sources to form a coherent picture of the market. Start with the big picture (COT reports), zoom into real-time activity (options flow), and then refine your strategy with technical analysis.
So next time you open chart, don’t just look at price. Dive into the reports/data before. Ask questions. Connect the dots. Because in the world of trading, knowledge truly is power.
What’s your experience with COT reports or options flow? Share your thoughts in the comments below—I’d love to hear how you incorporate these tools into your trading routine!
**P.S.** If you found this article helpful, consider bookmarking it for future reference.

Gold hit target at $3,337 next target? $3,443Since the last update on Gold, the price hit the target yesterday at $3,337.
Not only has it been awesome buying and investing in gold stocks, but also trading Gold upside with day trading has been a dream.
So why has gold been going up and what's next?
🏦 Central banks are buying tons of gold, especially China — big demand!
🌍 Global tension’s heating up (Middle East, Russia, Taiwan) — so gold’s the safe haven.
💵 Weak USD & interest rate cut hopes make gold more attractive.
📉 Inflation fears aren't gone, so people hedge with gold.
📈 Breakout above resistance means traders are piling in for momentum.
Technicals say that the price is going to continue up. It is going up with a slingshot formation of over 60 degrees steep.
But if the uptrend holds, we will continue to see it hit the next target at $3,443.
Not huge but it's something. Let's see.
Disclosure: I am part of Trade Nation's Influencer program and receive a monthly fee for using their TradingView charts in my analysis.

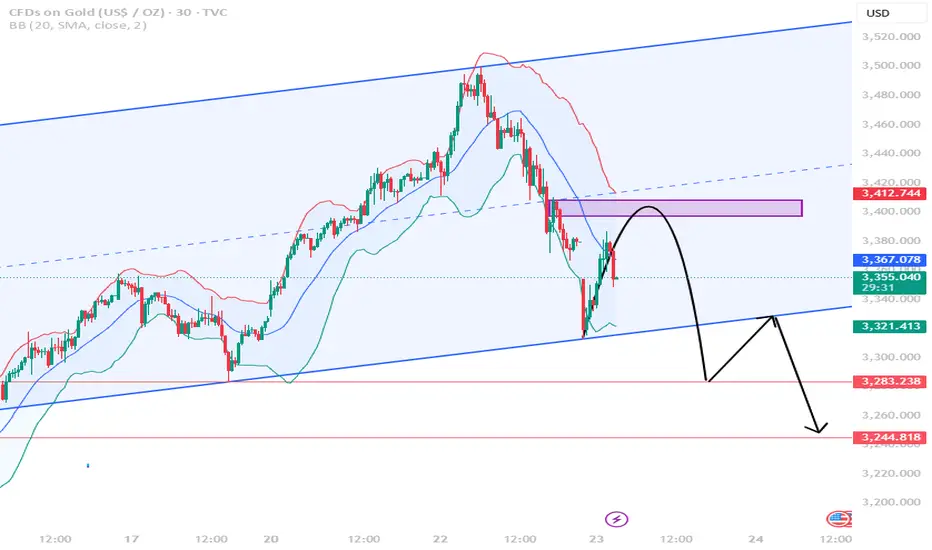
Gold shock, what will happen in the end?Previously, Trump frequently criticized Powell, saying that his interest rate cuts were not fast enough, and even considered firing Powell, causing market turmoil. But on April 22, Trump said he had no intention of firing Powell, but still emphasized that the Fed should lower interest rates and said that the stock market had risen well. This statement eased the market's concerns about the instability of the Fed chairman's position. Gold experienced ups and downs on Tuesday because of this news.
From the daily level, the yellow will show a trend of rising and falling on Tuesday, and finally close with a negative line. In the Asian market today, gold opened directly below the 5-day moving average. This sharp opening performance showed strong downward momentum and also made the short-term trend significantly weaker. In intraday trading, it is necessary to focus on the continuity of the downward trend of the market.
First of all, the support strength near the low point of 3316 formed after the low opening in the early trading should be paid attention to. If the short-selling force continues to exert force, causing the market to further weaken and fall, then the low point of 3284 that rebounded last Friday and the 10-day moving average support currently in the 3270 area will become the key support line in the future. In terms of operation, it is still mainly high-altitude
Operation strategy 1: Sell in the range: 3400-3403 SL:3410
TP: 3380--3360
Operation strategy 2: Buy in the range: 3280-3285 SL:3269
TP: 3300--3330
XAUUSD 30M CHART PATTERNThis chart shows a technical analysis for XAU/USD (Gold vs. U.S. Dollar) on the 30-minute timeframe. It highlights a potential bullish reversal setup, likely based on harmonic or price pattern trading. Here’s a quick breakdown of what’s being suggested:
Key Elements:
1. Bullish Pattern Completion:
The price has formed a potential reversal pattern (possibly a harmonic pattern like Gartley or Bat), ending around the green arrow at the bottom.
The pattern implies a potential buy zone where a

XAUUSDselling XAUUSD
sl 3575
tp 2779
100% risk
max leverage
like an follow me
short on gold
NOTE: im the best Gold trader in the world
i know when to sell
. swing sells 6,940 pips TRADE
note: if like to speak to me ,
pay me for my info nothing is free
i dont need you asking me 100 things
everything i know took me years to learn . not over night , this trading is hard
i charge 20k for my info
also looking for big investor to contact me , lets work i can make you 5% each day , only taking 1 client each year . must have a net of 1,000,000 to be accepted , im located at the trump tower in new york city , im 28 years old

Gold Price Analysis April 16Gold price is at ATH and no stopping point is seen
safe trading strategy can only be waiting for retest of strong buying zones to BUY
There is no specific strategy when gold is at the current price range. Today's strategy focuses on Buy around 3275-3273. The best zone to BUY today is 3246-3244. 3313 is a notable Fibonacci resistance zone, breaking this zone Gold will head to the next Fibonacci zone around 3350.
wish you a successful trading day.

HelenP. I Gold will start to decline, after long upward moveHi folks today I'm prepared for you Gold analytics. Recently, price has shown a powerful rally after breaking out from a prolonged consolidation phase that lasted several days. This sideways movement was confined inside the buyer zone near 2855 - 2835 points, which acted as a reliable base for bulls. After forming a solid structure in that area, the price started to move higher, eventually breaking through the resistance of the range and forming a clear uptrend supported by a well-defined trend line. After climbing steadily, the price reached the 3160 support level, which turned into a retest zone later on. A strong impulse followed, pushing Gold above the trend line and into a new higher range. The bullish momentum continued, bringing the price above the 3180 - 3160 zone, and establishing a new local high. Currently, XAUUSD is trading near 3327 points after forming a local peak. It’s showing early signs of a pullback from the top, and the structure suggests a potential correction. I expect the price to decline toward the trend line and reach the 3265 points, which coincides with the trend line. That's why it's my current goal. If you like my analytics you may support me with your like/comment ❤️

XAUUSD 4H Timeframe – Technical & Fundamental Analysis XAUUSD 4H Timeframe – Technical & Fundamental Analysis
Gold continues to shine during times of uncertainty. Whether it’s global conflict, inflation fears, recession talks, or market turbulence, investors tend to turn to gold as a hedge against risk.
However, there is still room for short-term exhaustion. On the 4-hour chart, we observed a sharp decline from $3,500 to $3,330, primarily driven by recent political developments in the United States. President Donald Trump retracted his threat to remove Federal Reserve Chair Jerome Powell and expressed optimism regarding a potential trade agreement with China. These actions eased market fears and reduced gold's appeal as a safe-haven asset, causing a temporary dip in demand and price.
📉 Technical Outlook:
On the 4H chart, gold hit an all-time high of $3,500 yesterday.
We’ve identified a Three Black Crows candlestick pattern, a strong signal of a potential reversal from a bullish to a bearish trend—suggesting that downward momentum may follow.
A minor key support level is seen at $3,340. A breakout below this level could:
Trigger pending sell orders
Initiate the accumulation phase in the liquidity zone
If the price breaks $3,290, it may confirm a Change of Character (CHOCH)—a strong sign of a bearish shift.
🧠 Trade Plan: After accumulation and liquidity grab, we wait for a clean breakout to confirm our setup.
📌 Sell Stop Entry: $3,317.20
📌 Stop Loss: $3,386.20
📌 Take Profit: $3,167.80
📌 Disclaimer:
This is not financial advice. As always, wait for proper confirmation before executing trades. Manage your risk wisely and trade what you see, not what you feel.

GOLD (XAU/USD) Breakout Watch –Bullish Continuation or Pullback?🔍 Instrument Analysis: XAU/USD (Gold vs USD)
Timeframe: Likely 1H or 4H (based on candle structure)
Indicators:
EMA 50 (Red) – Current value: 3,365.25
EMA 200 (Blue) – Current value: 3,248.04
📈 Current Market Structure
Price: Trading at 3,433.62, in a strong uptrend with higher highs and higher lows.
Trend: Bullish, supported by price trading above both the 50 EMA and 200 EMA.
Key Zones:
Immediate Resistance: ~3,430 - 3,440 zone (currently being tested).
First Support Zone: ~3,315 - 3,330
Second Support Zone: ~3,250 - 3,270
🧠 Scenario Analysis
✅ Bullish Scenario (Primary Bias)
Price is attempting a break and retest of the resistance zone.
If a successful retest confirms it as support, next upside leg could target 3,480+.
Bullish continuation is favored as long as price holds above 3,385 (recent breakout level).
⚠️ Bearish Scenario (Secondary Bias)
If price fails to hold above 3,385, we may see a pullback to:
3,315 - 3,330 support area (reaction likely due to proximity to EMA 50).
A deeper retracement toward the 3,250 zone, aligned with EMA 200, which would be a critical level for bullish continuation or breakdown.
📊 EMA Insight
EMA 50 > EMA 200: Confirms bullish momentum.
The slope of both EMAs is upward, reinforcing current upward trend.
A test of the EMA 50 may offer a buy opportunity if structure holds.
🔔 Trade Outlook
Bullish bias remains intact above 3,385.
Look for bullish price action confirmation (bullish engulfing, pin bars, etc.) on retest of resistance-turned-support.
Monitor volume/activity around 3,385-3,400 for potential rejection or continuation clues.

XAUUSD - Liquidity Grab Before Pullback? | Key Zones MarkedGold (XAU/USD) is approaching a critical liquidity zone around the $3,330 level, which aligns with a strong Fibonacci extension area and previous structural highs. Price has shown an impressive recovery after hitting support below $3,000, triggering a bullish rally that reached our TP at $3,270 following a successful SL re-entry.
The price is currently tapping into a liquidity zone, with expectations of short-term rejection signals forming on the 1H time frame.
If we start to see 1H candle rejections or bearish divergence, we can anticipate a possible pullback towards the $3,140-$3,180 zone, which is a confluence of previous resistance turned support and a Fibonacci retracement level.
📌 Patience is key—wait for proper price action confirmation before entering shorts.

XAUUSD Gold has continued its upward trend and is expected to perform bullish since there are no indications ,so far, of its reversal to downtrend.

GMoney Pre-London SpeculationTuesday April 22, 2025
Speculating the direction of gold for the Wednesday London Session
We will then resume a live market speculation for Pre-NYSE during the Trading Lounge hour of 7:30am CT.

4.22 Gold market analysis and operation suggestions📌 Market Review: Strong continuation, bulls dominate
Yesterday, gold opened high and moved higher, breaking through the 3400 mark. Although it retreated briefly, it quickly stabilized. The US market rose again, reaching above 3430. The daily line closed with a bald big positive line, showing extremely strong buying momentum.
📊 Technical analysis: The bullish trend is stable, and retracement is an opportunity
✅ Daily level:
Moving average system: MA5-MA10 bullish arrangement, prices continue to rise along the 5-day moving average
Bollinger Bands: Opening upward, no signs of closing, and there is still room for growth
K-line structure: Continuous large positive lines, no peak signal, strong trend continuity
Key support: 3400 (psychological barrier), 3380 (5-day moving average)
Upper target: 3450, 3480, 3500
✅ Short-term (4H/1H):
High-level oscillation upward, limited retracement, and rapid recovery after each adjustment
Operation idea: Go low and long with the trend, avoid going against the trend and betting on the top
🎯 Today's operation strategy: Continue to buy on retracement
1⃣ Steady long order:
Buy near 3473-3475, stop loss 3467, target 3488-3500
2⃣ Aggressive long order:
If it falls back to 3450-3455, you can add more with a light position, stop loss 3445, target 3470-3480
3⃣ Be cautious with short orders:
The current trend is extremely strong, and the risk of shorting against the trend is extremely high. Only short-term quick entry and exit (if 3500 is not broken, try shorting with a light position)
🚨 Risk warning
Market sentiment is extremely bullish, but be wary of sudden news that causes violent fluctuations
Strictly stop loss and avoid heavy positions
🔥 Conclusion: Trend is king, follow the trend and buy low!

$Gold thrives when uncertainty reigns!- Targets... 4/22/2025TVC:GOLD remains the ultimate safe haven in turbulent markets, proving its strength once again. The extended bull run shows no signs of slowing, eyeing potential targets ahead— check the chart for what’s next!
Cheers!

