Gold Trading Signals!!Looking back to last Thursday, our gold short strategy hit the mark perfectly. Prices dropped nearly $60 as expected, and we captured around $45 in profit from that move. Overall, we secured over $200 in profit space last week—an excellent performance.
Today, gold opened higher and continues to climb. Technically, bulls still have room to push higher, with 3360 as a key resistance level. However, judging by the current momentum, we may even see a test of 3400. That said, trading is about precision, not perfection. If prices approach 3380 and the upward momentum stalls, it may be time to watch for a pullback. On the other hand, if strength continues, holding some light long positions remains a relatively low-risk strategy.
Trading Strategy for Today:
📉 Sell in the 3380–3410 range
📈 Buy in the 3307–3280 range
🔁 Flexible trades between 3360–3330 / 3272–3315
GOLD trade ideas

Feeling the Gold Fomo?Feeling the Gold Fomo?
Yes, those on the sidelines are late in this cycle!
Before the longer term "good above this" line fails, you can spot the possible start of the correction with a steeper shorter line.
You can clearly see the last low risk entry was almost 2 years ago.

GOLD: Bulls Are Winning! Long!
My dear friends,
Today we will analyse GOLD together☺️
The recent price action suggests a shift in mid-term momentum. A break above the current local range around 3,430.01 will confirm the new direction upwards with the target being the next key level of 3,480.61 and a reconvened placement of a stop-loss beyond the range.
❤️Sending you lots of Love and Hugs❤️

SELL GOLD NOW!!!!!!!!!1Gold took out the sell side liquidity with a retest am looking forward to see price rejects properly from this previous lower highs which is also a fvg premium zone then am in holding till new lows is created
JOIN AND ENJOY......

Gold targets $3,475: Strong wave has not stoppedThe world gold price's uptrend continues to hold steady after a technical correction to the support zone around $3,336 - $3,369 (Fibonacci 0.5 - 0.618), coinciding with EMA34 on the H4 frame, showing that buying power is still dominant in the main trend. The price has now recovered to around $3,395/ounce and continues to maintain a strong uptrend pattern with the target of expanding to the $3,475 zone - the 100% Fibonacci level of the most recent uptrend. The convergence between the technical structure and macro news creates a solid foundation for the uptrend: safe-haven money continues to flow into gold amid geopolitical instability, a weakening USD and market sentiment worried about risks from US economic policy.
Comments from experts such as Sean Lusk and Christopher Vecchio also reinforce the bullish outlook, especially as speculative money and central bank buying have yet to show signs of cooling off. With the EMA34 and EMA89 maintaining a positive slope, the possibility of the price continuing to climb to the target area of $3,475 is very high, before a short-term correction to test the breakout zone may appear. In the short term, any correction to the $3,370–$3,390 area is seen as an opportunity to increase long positions following the trend.

GoldXAUUSD
- Completed " 12345 " Impulsive Waves
- Break of Structure
- Demand Zone
- Change of Characteristics
- Order Block

XAUUSD 15mint ForecastHello guys I hope you are all welll you can buy now because our fair value gate has been filled, so our target for now will be $3518

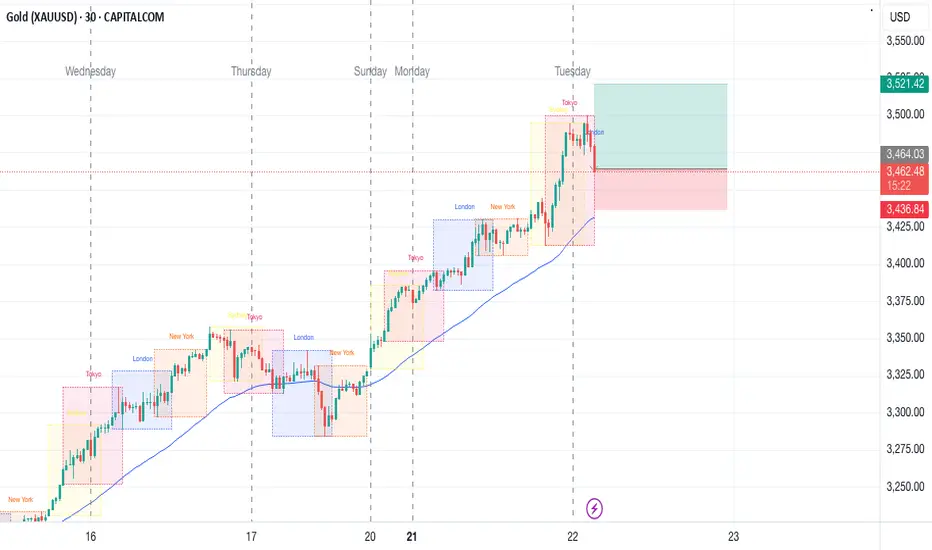
Gold price breaks through a new high of 3500 and enters the key Gold price hit a new record high of 3500. After reaching this point, it showed obvious pressure and went down to find the 3461 area. This is the largest correction since the rise of 3284 last Thursday.
Today's early trading price also continued to rise and break through the new high, but there was an episode, that is, it first broke through the high of 3444, then fell sharply to 3412, and finally confirmed the strong rise at 3418 to break through the new high, and continued to break through the sprint
Until noon, it sprinted to 3495 and suppressed the decline to find 3473 support, and then pulled up again to sprint to break the high of 3500. This time the decline was relatively strong, falling to the 3461 area
So far, the rising process can be slightly slowed down and enter a wave of adjustment
Accumulate momentum to provide power for the next round of start-up
During the adjustment process, pay attention to the golden section line
This wave from Since the rise from 2970, the largest adjustment squat is 0.382, and now this position is 3417, which is close to the Asian market acceleration starting point 3418. The two together become the stabilizer of the bullish trend: 0.382 position 3417 area
This is the first focus of today. During the adjustment process, pay attention to the position of the golden section line
0.382 position is 3417, close to the acceleration starting point
0.500 position is 3391, close to the 3384 area along the channel line
0.618 position is 3366, close to the four-hour lifeline
The current price space is large and the speed is fast. Articles and analysis are only auxiliary, and are more temporary reminders. Plans cannot keep up with changes. The three key points mentioned above can be kept in mind. If there are price variables during the process, they can also be adjusted accordingly.

Final upward push and then a possible correctionGold may likely try to touch the 3450,3470, and possibly 3500 marks as it is in a strong bullish trend. Price action persisted in going past the 3430 point, as it was the current all-time high, which may lead the price to further continue its upward trajectory. However, the bullish trend may correct after having risen for some days and weeks. A correction is bound to okay depending on where the price rising pressure stalls.

Gold (XAU/USD) – Bullish Momentum in Ascending ChannelGold is trading within a strong ascending channel on the 1H chart. Price has just bounced from the lower boundary and is holding above the buy entry level around $3,454. The structure suggests continuation toward the target zone at $3,570, supported by bullish price action and trend strength.
Buy Entry: $3,454
Target: $3,540
Bias: Bullish
Note : This is not financial advice. Trade at your own risk.
Support: Like & follow for more trade ideas!

XAUUSD Gold Bearish Setup for upcoming week.XAUUSD Sell Setup – Short from Resistance at 3350
Gold (XAUUSD) has approached a key resistance level around 3350, where previous price action suggests potential for bearish reversal. With the current momentum showing signs of exhaustion, we’re looking for a short opportunity from this zone.
Trade Idea:
Sell Entry: 3350 (resistance level)
Target 1: 3310 – Minor support / first reaction zone
Target 2: 3290 – Key support area
Target 3: 3250 – Major support & potential full TP zone
Stop Loss: Above recent swing high (suggested: 3360–3370)
Analysis:
Price has formed a potential double top / rejection wicks near 3350, signaling possible downside. A break below 3310 will likely accelerate bearish momentum.
Risk Management:
Use proper lot sizing and move SL to breakeven after TP1 for a safe ride to lower targets.

Gold Quarterly Shift Analysis - April 2025This post is based on my learnings from #ICT Quarterly Shift Analysis teachings.
----------------------------------------------
Previous Analysis:
In September 2024, I published my quarterly shift analysis for #Gold. Back then, I estimated a shift in the market structure for Gold on or around the US Presidential Election date. It happened exactly as outlined. I estimated Gold would make a bearish move or create a large range; it indeed created a large range and has been moving within the range since then. The top of the range is 2790.10, and the bottom of the range is 2536.60.
Then I posted a new Quarterly Shift Analysis on 13 Jan 2025. I specified the time window for a shift in the market structure to happen, and price indeed delivered as outlined. I said that between the 20th and 31st of January, Gold would determine its new direction. On 30 Jan 2025, Gold created a new all-time high and closed a strong daily candle above the range described before. Gold hit and exceeded all the targets outlined in my analysis.
-------------------------------------------------------
New Quarterly Shift Analysis:
As we get closer to the end of April, Gold seems to be in a rush to make new highs and hit new targets. I believe that from the end of April to the 2nd of May 2025, Gold can hit $3411 and possibly $3498 or $3500. If it's too aggressive, $3582 can also be reached.
Between 30 April and 02 May (NFP Announcement Date), Gold should make a new quarterly shift. The possible scenarios are as follows:
1. Continuation: Gold could make a retracement and then continue the current uptrend for the next 3–4 months. The retracement could go as deep as 3180, 3068 and 2982. The uptrend targets will be the targets mentioned above plus 3618 and 3738.
2. Enter a long-term range (My guess is this is the most likely scenario): Gold could enter a new long-term range for the next 3–4 months. The bottom of the range will be 2958, and the top of the range will be the highest high created by Gold by or before 30 April to 2nd of May. If this scenario happens, it is a good chance to look for sell opportunities near or within the top 25% level of the range and look for buy opportunities near or within the bottom 25% level of the range.
3. Bearish Move: If Gold closes a strong daily candle below 2958, then for the next 3–4 months, it could go lower towards 2832, 2790, 2728, and 2662. This scenario might not be highly likely, but in the event if it happens, it's a wonderful opportunity for long-term Gold investors to buy and hold Gold.
-----------------------------------------------------------
Disclaimer: This is not a signal, just an analysis for your consideration and benefit. Please combine it with your own analysis.

XAUUSD NEXT MOVE POSSIBLE XAUUSD NEXT MOVE POSSIBLE
according to H1 analysis market continuously in buying pressure now market will be falling and touch support level so we have to great opportunity to go long from support level be careful use money management TRADE AT YOUR OWN RISK
REGARD ALBERT

Breakout or Breakdown – Which Way Will the Market Move Next?Market Outlook – 2H Chart Analysis
After analysing the 2-hour chart, we can observe that the price has been consistently trading within a respected ascending channel since April 10, 2025. Following the formation of an all-time high (ATH) at 3357.775, the market experienced a shallow retracement, dipping just below the 38.20% Fibonacci level.
Currently, the price is consolidating around 3327.375 within a falling broadening wedge pattern, which is typically considered a bullish continuation pattern. The retracement zone between the 38.20% and 50.00% levels suggests that buyers remain in control of the trend.
Looking ahead to next week, as long as the price:
• Remains inside the ascending channel
• Holds above the key support level at 3288
• And eventually breaks above the falling broadening wedge and the resistance at 3332
…I anticipate a potential rally toward our first target, with the second target aligning with the 161.80% Fibonacci extension level.
However, if the price breaks below the support level of 3288, a further decline toward 3237.70 could be expected.
⚠️ Reminder:
Every trade carries risk. Strict adherence to your risk management strategy is essential to protecting both capital and profits.
Happy Trading,
SpicyPips
⸻

12 April - Still BullishMovement is still very bullish, and there is no reason price will not continue going up. I do see the need for a retracement. This is not a prediction, but technical analysis possibility.

Gold (XAU/USD) Bullish Breakout from Pennant PatternGold has broken out of a well-formed Bullish Pennant on the 2-hour chart, supported by strong momentum and a bullish Ichimoku cloud structure. The continuation pattern confirmed the trend following a steep bullish move, and price has now reached the projected target around $3,480.
Fundamentally, gold remains supported by safe-haven demand amid geopolitical tensions and persistent inflation concerns. As long as price stays above $3,400, the bullish outlook remains intact.
Bias: Bullish
Pattern: Bullish Pennant
Target: $3,480
Support: $3,400 / $3,300
Disclaimer: This is not financial advice. Trade at your own risk. Always do your own research.
If you found this analysis helpful, please support with a like and follow for more trading ideas and updates. Your support is greatly appreciated!

Gold over BTCYep, them are some fightin' words right there. But, on a monthly chart, Gold / BTC tells a potential story. It may not happen this year, but it looks to be shaping up.
A black swan event could actually be a reversion to a gold standard or something similar, causing sovereigns to scramble for physical gold, causing the price to skyrocket.
Perhaps capital controls on USD? Something else related to USD? Who knows, but a falling wedge at this scale is important.

XAUUSD H4 | Bearish Drop in the short termBased on the H4 chart analysis, we can see that the price is testing our sell entry at 3479, aligning with the 261.8% Fibo extension.
Our take profit will be at 3415.26 , a swing low support.
The stop loss will be placed at 3524.53.
High Risk Investment Warning
Trading Forex/CFDs on margin carries a high level of risk and may not be suitable for all investors. Leverage can work against you.
Stratos Markets Limited (tradu.com):
CFDs are complex instruments and come with a high risk of losing money rapidly due to leverage. 63% of retail investor accounts lose money when trading CFDs with this provider. You should consider whether you understand how CFDs work and whether you can afford to take the high risk of losing your money.
Stratos Europe Ltd (tradu.com):
CFDs are complex instruments and come with a high risk of losing money rapidly due to leverage. 63% of retail investor accounts lose money when trading CFDs with this provider. You should consider whether you understand how CFDs work and whether you can afford to take the high risk of losing your money.
Stratos Global LLC (tradu.com):
Losses can exceed deposits.
Please be advised that the information presented on TradingView is provided to Tradu (‘Company’, ‘we’) by a third-party provider (‘TFA Global Pte Ltd’). Please be reminded that you are solely responsible for the trading decisions on your account. There is a very high degree of risk involved in trading. Any information and/or content is intended entirely for research, educational and informational purposes only and does not constitute investment or consultation advice or investment strategy. The information is not tailored to the investment needs of any specific person and therefore does not involve a consideration of any of the investment objectives, financial situation or needs of any viewer that may receive it. Kindly also note that past performance is not a reliable indicator of future results. Actual results may differ materially from those anticipated in forward-looking or past performance statements. We assume no liability as to the accuracy or completeness of any of the information and/or content provided herein and the Company cannot be held responsible for any omission, mistake nor for any loss or damage including without limitation to any loss of profit which may arise from reliance on any information supplied by TFA Global Pte Ltd.
The speaker(s) is neither an employee, agent nor representative of Tradu and is therefore acting independently. The opinions given are their own, constitute general market commentary, and do not constitute the opinion or advice of Tradu or any form of personal or investment advice. Tradu neither endorses nor guarantees offerings of third-party speakers, nor is Tradu responsible for the content, veracity or opinions of third-party speakers, presenters or participants.

GOLD: The Market Is Looking Down! Short!
My dear friends,
Today we will analyse GOLD together☺️
The price is near a wide key level
and the pair is approaching a significant decision level of 3,327.25 Therefore, a strong bearish reaction here could determine the next move down.We will watch for a confirmation candle, and then target the next key level of 3,299.56.Recommend Stop-loss is beyond the current level.
❤️Sending you lots of Love and Hugs❤️

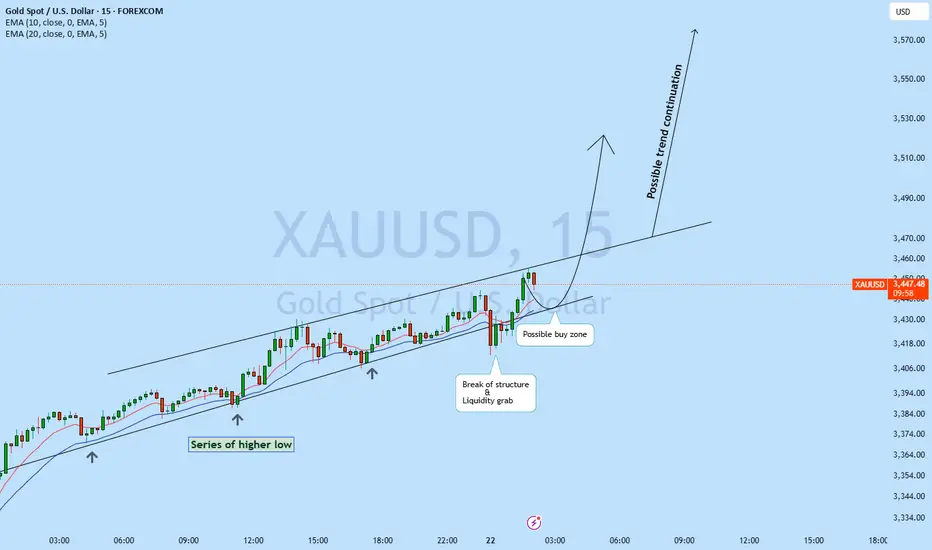
XAUUSD possible buy zone!XAUUSD is moving in the major direction of the rend with series of higher high and higher low
with multiple liquidity grab. Currently upon daily close, there has been a break of structure with strong liquidity grab giving this instrument a strong probability to move back to the upside with new moment. Upon pullback to the trend line is an area looking to buy upon price action confirmation.
XAUUSDselling XAUUSD
sl 3474
tp 3365
100% risk
max leverage
like an follow me
short on gold
NOTE: im the best Gold trader in the world
i know when to sell
. swing sells 600pips
note: if like to speak to me ,
pay me for my info nothing is free
i dont need you asking me 100 things
everything i know took me years to learn . not over night , this trading is hard
i charge 20k for my info
also looking for big investor to contact me , lets work i can make you 5% each day , only taking 1 client each year . must have a net of 1,000,000 to be accepted , im located at the trump tower in new york city , im 28 years old

