Gold (XAU/USD) Bullish Continuation Setup – Key Support Levels 📊 Chart Context & Setup
Chart Type: Candlestick
Indicators Used:
50 EMA (red): Currently at 3,199.009
200 EMA (blue): Currently at 3,123.168
Support Zone: Around 3,157.786 – 3,123.168
Current Price: Approximately 3,211.90
Focus Point (Target Zone): 3,283.810
🧠 Technical Analysis
🔹 Trend Analysis
Overall Trend: Bullish
Price is trading above both the 50 EMA and 200 EMA.
The EMAs are sloping upward, indicating strong momentum.
Golden Cross previously occurred (50 EMA crossing above 200 EMA).
🔹 Key Support & Resistance
Immediate Resistance Zone: Around 3,240
This area is acting as a potential rejection zone, with minor consolidation.
Support Zone (Highlighted): 3,157 – 3,123
This zone was previously a breakout level and now serves as a retest support.
It coincides with the 200 EMA, adding to its strength.
🔁 Scenarios Presented
Scenario A – Bullish Rejection from Immediate Support (3,199)
Price could hold above or near the 50 EMA.
Break and retest of minor resistance could lead to a push toward 3,283.81 (target).
This is a higher-risk entry as the support is not deeply tested yet.
Scenario B – Deeper Pullback to Major Support (3,157 – 3,123)
A drop below current price into the main demand zone.
Bullish engulfing or strong reaction in this zone would offer a high-probability long setup.
Ideal entry point for swing traders, especially if confirmed by volume or bullish candlestick reversal.
🎯 Trade Strategy Suggestion
✅ Long Setup
Entry Option 1: On bullish rejection above 3,199 with confirmation.
Entry Option 2 (Preferred): At strong support zone 3,157 – 3,123 with bullish reversal signal.
Target: 3,283.81
Stop Loss:
For Entry 1: Below 3,157
For Entry 2: Below 3,100 or 200 EMA, depending on aggressiveness
📌 Conclusion
This chart illustrates a classic bullish continuation setup with two potential entry scenarios:
A minor pullback and bounce from the 50 EMA.
A deeper retracement into a strong support zone aligned with the 200 EMA.
The uptrend remains intact as long as the price holds above the 200 EMA and the major demand zone. A break below 3,100 would invalidate the bullish outlook short-term
GOLD trade ideas

Today's gold analysis strategyThe gold market has experienced significant price fluctuations and corrections. From a technical perspective, the overbought correction has already arrived. The price of gold has deviated significantly from its short-term moving average, strongly suggesting that a correction is needed to complete the technical adjustment. The current correction is not a simple unilateral decline.
From a fundamental perspective, the underlying support for gold remains rock solid. Geopolitical risks, especially the continued escalation of the tariff standoff, have maintained strong demand for safe-haven assets. Therefore, this price adjustment should be regarded as a typical correction following the previous sharp rise.
Buying price: 3290 - 3295
Target price: 3320 - 3330

What if Kid Rock ran the Fed?Gold has broken above $3,400 for the first time, setting a new all-time high as investor confidence in the United States continues to decline.
Citi forecasts gold could reach $3,500 within the next three months. However, this projection might be underestimating Trump’s potential to further undermine confidence in the US.
On Monday, President Trump intensified pressure on Federal Reserve Chair Jerome Powell, calling him a “major loser” and demanding immediate interest rate cuts. Last week the President said, "Powell's termination cannot come fast enough,".
A move to dismiss Powell would likely trigger significant market volatility. Markets generally view Powell as a stabilizing figure, and history shows that a less independent central bank is less effective at keeping inflation under control.
I think it might be fair to wonder what a Federal Reserve Chairman Kid Rock would do for the price of gold.

XAUUSD - MONTHLY FIBS - A STORY TO TELL?Confluences:
-Monthly Fib Ratios have all been tested, priced has reached the -1.3618 FIB TP range. (Strong indicator of a reversal since it's a peak of the entire move since Sept 2022 (3 years)
-RSI is in overbought territory if we compare it to the left side of the historical moves which happened (Look at the blue line)
-Fundamentals maybe in favor of profit taking and tariffs issues cooling down in the weeks to come which could signify that we are at the top of the bullish move.
-Wait for confirmations and engulfing candle to paint on the chart which indicates strong selling pressure before taking any trades.
-Buying at ATH prices, will not be recommended for now since late buyers clouded in FOMO often end up losing their money if this sells off aggressively
Cheers


GOLD !!! IS IT A TIME TO CORRECT ? Predicted Movement On GOLD for next Weeks
According to CCI Divergence
According to Fibo Extension
According to Fibo Retracement
According to Uptrend channel on weekly
According to UP trend Channel On Monthly

GOLD Next Bullish ZoneA Next Gold Possible movement Traders lets we share some tips to with you Guys.
From Mr Martin Date 18 Friday April 2025
Gold will continue to rise showing no any signs to reversal on the horizon in the less 45 mint time frame, Lets would see what's next Gold will move?
in this Condition Gold will get next target will be 3342 And Also 3370 Keep eye oin target.
PS Support with like and comments for more analysis Thanks Foe support .

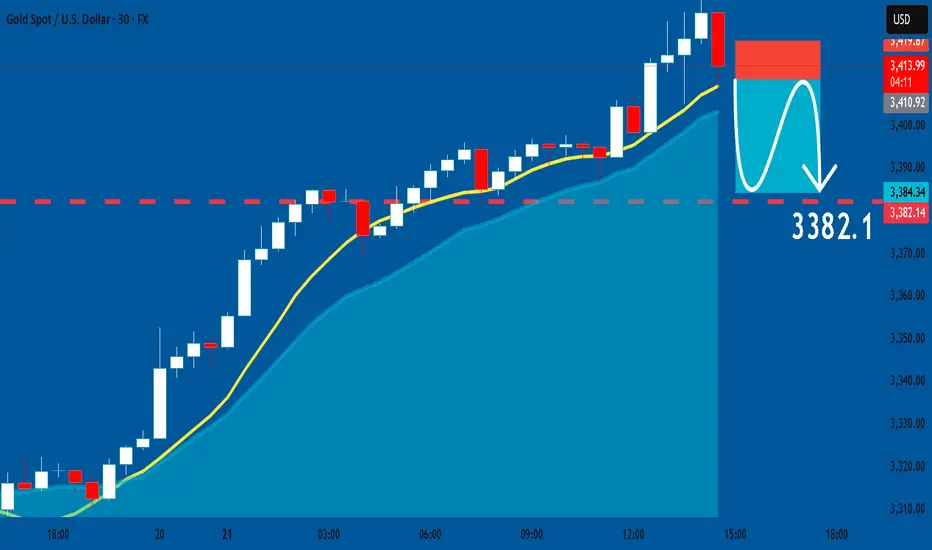
GOLD: Short Trade Explained
GOLD
- Classic bearish formation
- Our team expects fall
SUGGESTED TRADE:
Swing Trade
Sell GOLD
Entry Level - 3411.3
Sl - 3419.8
Tp - 3382.1
Our Risk - 1%
Start protection of your profits from lower levels
❤️ Please, support our work with like & comment! ❤️
XAUUSD (GOLD)The new Target Price To XAUUSD (GOLD) $5000 Its amazing Traget And The New All Time High

Gold is in a strong bullish trend. Don't be afraid of correctionThe continuation of the Russia-Ukraine conflict and the breakdown of the truce agreement have further enhanced the safe-haven appeal of gold.
On Monday, the price of gold surged to around $3,427.
Under such a market rhythm, there is no room for hesitation; it is advisable to follow the trend.
Never entertain the idea of reversing your position.
After the sharp rise and breaking of the previous high in the early morning, it was necessary to go long on gold once again during the afternoon or the European trading session. We planned to enter a long position around $3,384 - $3,383 in the intraday trading, and currently, the price has reached the target level as expected.
In the subsequent period, the key focus can be on the secondary inflection point of the day, which is around $3,370 - $3,368. This is the last inflection point of the upward movement, and the double bottom of the uptrend is a position where going long is a must.
After a strong upward movement, it is not excluded that the price of gold may face technical pullback pressure, especially considering that the current indicators are all in an overbought state. Therefore, while following the trend, we also need to be vigilant against risks. Avoid chasing the price at high levels and refrain from placing reckless orders.
If you are currently not satisfied with your gold trading performance and hope to avoid detours in your investment, you are welcome to communicate and exchange ideas with us!

Technical Analysis – Gold (XAU/USD) – Weekly Chart 3500$📉 Technical Analysis – Gold (XAU/USD) – Weekly Chart
🔹 Price Action & Structure
Current Price: ~$3,420
Gold has been on a strong bullish rally, breaking previous highs and trending upwards in a steep channel.
The chart shows a long-term ascending parallel channel, with price currently nearing the upper half.
There's a crucial breakout zone marked around $3,500 – a psychological and technical resistance level.
🔹 Key Levels
Immediate Resistance: $3,500 – if a weekly candle closes above, it opens up bullish continuation.
Next Target (TP): $4,083 – based on the breakout projection and mid-channel resistance.
Further TP: $5,031 – top of the channel (longer-term target).
Support Zone: $2,750 – highlighted in blue, a strong demand zone with past accumulation and breakout area.
🔹 Technical Indicators to Watch (not visible but implied):
Fibonacci Levels: The $3,500 zone could align with a major fib extension (likely 1.618 from previous swing).
RSI: Likely in overbought territory on the weekly, hinting at possible short-term exhaustion or retracement.
MACD: Likely showing strong momentum, but a bearish crossover on higher timeframe would confirm a pullback.
Volume Profile: (not shown) could confirm if accumulation is happening above $3,500.
🔹 Potential Scenarios
Bullish Breakout: If price closes above $3,500 and holds, a rally toward $4,083 is likely.
Fakeout & Rejection: If price gets rejected from $3,500 zone, we may see a pullback toward $2,750 for reaccumulation.
Profit Booking: After reaching $4,000+, profit booking could cause consolidation or a deeper correction.
🌐 Fundamental Analysis – Gold Outlook
🏦 Macro Drivers
Global Inflation: Persistent inflation has historically driven gold demand as a hedge.
Interest Rates: Expectations of rate cuts by the Fed or other central banks in 2025 would favor gold prices.
Geopolitical Risk: Ongoing global tensions (Middle East, Eastern Europe, etc.) tend to increase safe haven demand.
Currency Weakness: A weakening USD supports gold, as it's priced in dollars.
💹 Investor Sentiment
Central banks are increasing gold reserves (China, Russia, etc.).
Demand for physical gold is high, especially from BRICS nations as they explore de-dollarization.
📉 Risk Factors
Sudden hawkish stance by central banks could pressure gold.
If inflation cools faster than expected, gold might see reduced interest as a hedge.
Overbought technical could trigger short-term corrections.
✅ Conclusion
Gold is currently in a strong bullish trend, testing a major resistance. A weekly close above $3,500 can push it to $4,083 and potentially $5,031 in the long term. However, retracement is likely if it fails to sustain above this level, with $2,750 acting as a key support zone.
“Watch price action at $3,500 carefully — the breakout or rejection here could define the next 6–12 months of gold's direction.”

XAUUSDselling GOLD
sl 3425
tp 3340
like an follow
1% risk
short on gold
NOTE: the best gold trader in the world.
i know when to sell
i dont like you tbh
dont ask me for help
dont ask me for my info
this page is the only page i have
pay me 5k just to speak to me

GOLD: What happened?Hello friends
The trend is very bullish and given the recent events in the world, the possibility of a decline is decreasing, so we can buy in pullbacks that the price is making in steps and with capital management and risk, price targets have also been specified.
*Trade safely with us*

XAUUSD profit analysisGold has been breaking new highs recently. Don't chase the short position blindly. Gold is still strong. Although there is a need for a correction on the technical level, gold has not fallen sharply. It is still mainly long, but don't be blindly long at high levels. It is recommended to wait for a short-term correction before continuing to go long. In the short term, you can pay attention to the 3320-3325 range. You can enter long orders in this area, but you must pay attention to risk management when trading. If there is a loss, you must stop loss in time. Stop loss is also one of the trading techniques. Many people who shorted gold have been trapped or even cleared because they did not set a stop loss account. Don't insist meaninglessly!
I share my market analysis and trading strategies every day. If you are confused about trading, you can take a look. I think it will be helpful to you.

Buy OpportunityGOLD/USD Buy Setup – Breakout & Retest Confirmed
Entry: 3384
TP: 3563
SL: 3307
RR: 2.3
Analysis:
Gold has broken out of the recent consolidation range and is respecting the ascending trendline. Volume is increasing on the breakout, confirming bullish strength. Minor pullback held perfectly at the trendline and previous resistance-turned-support. Clean move expected toward 3560+ if momentum continues.
Bias: Bullish
Timeframe: 1H
Outlook: 1–2 days

The bull market is not over yet, gold is heading towards 3400Sentiment Misjudgment:
A significant number of market participants misread the price action, anticipating a technical pullback based on historical precedent. However, gold defied expectations, breaking to fresh all-time highs, indicating a departure from traditional market behavior.
Recent Price Performance:
Gold has rallied from $2970 to $3380, registering a $400+ gain, now approaching the critical psychological barrier at $3400, supported by strong momentum.
Macro Drivers:
The global economy is entering a stagflationary phase, with persistently low real interest rates increasing gold’s appeal as an inflation hedge.
Geopolitical tensions are escalating, heightening demand for safe-haven assets.
The U.S. Federal Reserve’s independence is under pressure amid political interference, reinforcing expectations for a policy pivot.
A shift away from the "cash is king" doctrine is emerging, with gold reasserting its role as a store of value in a global rebalancing of capital.
Technical Outlook:
Gold maintains a structurally bullish setup, with key intraday supports at $3365 and $3355. Sustained trading above this zone increases the probability of a breakout toward $3390–$3395, with further upside potential in the U.S. session.
Strategic Recommendations:
Avoid holding long-term short positions against the prevailing trend.
Treat any corrective pullbacks as opportunities for accumulation within a broader bullish cycle.
Use $3360 as the key pivot level, maintaining a buy-on-dip strategy as long as it holds.
Stay disciplined with risk management and be a "friend of the trend"—let time compound the value of correct positioning.


Similar Bull Runs GOLD Gold is going parabolic on this run with a massive move
This can be compared to a run in previous history of gold
The price of gold moving up could be due to uncertainty in other markets, hence movement into metals and other stores of value
Weekly timeframe

XAUUSD TRADE IDEAhi all
this my trade plan until end of this month
good luck
**My trading strategy is not intended to be a signal. It's a process of learning about market structure and sharpening my trading my skills also for my trade journal**
Thanks a lot for your support

HelenP. I Gold will make correction movement to support zoneHi folks today I'm prepared for you Gold analytics. After a strong breakout from the ascending structure, price continued its bullish momentum and reached a fresh local high near 3340 points. This impulsive rally was preceded by a steady upward trend inside a rising channel, where the price showed multiple rejections from the lower boundary and the trend line, particularly near the 2970 level, which also matched with the key support zone at 2950 - 2970 points. The upward movement accelerated once Gold broke through the previous resistance zone around 3160 points, which is now acting as support. That level also coincides with the upper edge of the earlier consolidation area, making it a key zone for potential future reactions. At the moment, the Gold is trading far above the trend line and is extended from its last confirmed support structure. Given the sharp vertical impulse and the lack of significant pullbacks, I expect a downward correction toward the 3175 - 3160 support zone, which is my current goal. This area remains critical for evaluating the next buyer reaction and further trend continuation. If you like my analytics you may support me with your like/comment ❤️

XAUUSD Volatility in Focus: Caution Advised for PullbackCurrently, I estimate that XAUUSD is nearing the end of wave iii of wave (v). I present two potential scenarios:
In the black label scenario, XAUUSD may continue its upward movement to complete wave iii, with a projected target in the 3,372–3,410 range.
However, under the red label scenario, there is a possibility of a short-term correction toward the 3,284–3,301 area before resuming the uptrend toward the same target zone.
Traders should closely monitor price action, as increased volatility is likely in the near term.

4/21 Gold Trading StrategyGood morning, everyone! A brand new week begins—wishing us smooth trades and great success ahead.
Looking back to last Thursday, our gold short strategy hit the mark perfectly. Prices dropped nearly $60 as expected, and we captured around $45 in profit from that move. Overall, we secured over $200 in profit space last week—an excellent performance.
Today, gold opened higher and continues to climb. Technically, bulls still have room to push higher, with 3360 as a key resistance level. However, judging by the current momentum, we may even see a test of 3400. That said, trading is about precision, not perfection. If prices approach 3380 and the upward momentum stalls, it may be time to watch for a pullback. On the other hand, if strength continues, holding some light long positions remains a relatively low-risk strategy.
Trading Strategy for Today:
📉 Sell in the 3380–3410 range
📈 Buy in the 3307–3280 range
🔁 Flexible trades between 3360–3330 / 3272–3315

Daily Analysis- XAUUSD (Monday, 21st April 2024)Bias: Bullish
USD News(Red Folder):
-None
Analysis:
-Strong bullish momentum on market open
-Looking for pullback for BUY
-Potential BUY if there's confirmation on lower timeframe
-Pivot point: 3300
Disclaimer:
This analysis is from a personal point of view, always conduct on your own research before making any trading decisions as the analysis do not guarantee complete accuracy.
