GoldGold has some more correction before any upside further.
Disclosure: We are part of Trade Nation's Influencer program and receive a monthly fee for using their TradingView charts in our analysis.
GOLD trade ideas

Analysis of gold price trend next week!Market news:
April 14 to April 18, 2025, due to the Good Friday holiday, the market was closed on April 18. There were only four trading days this week, and the spot gold market performed strongly, with a weekly increase of 2.76%. Prior to this, some investors chose to take profits after the international gold price hit a new high of more than $3,357 on Thursday. Although the current technical side shows that gold is overbought, the overall market is still in a steady upward trend.The rise in London gold prices was driven by the safe-haven demand caused by the weakening of the US dollar, trade policy uncertainty, and hawkish remarks by Federal Reserve Chairman Jerome Powell on the risk of stagflation. The economic data released this week showed differentiation, with a solid labor market but weak housing data, coupled with geopolitical risks such as the European Central Bank's interest rate cut and the Russia-Ukraine conflict, further enhancing the attractiveness of gold.Looking ahead, the bullish trend of gold remains solid, and investors should pay close attention to the Fed's subsequent policy statements and trade policy dynamics, which will have an important impact on market sentiment and gold price trends in the coming weeks.
Technical Review:
Gold daily level still maintains a strong unilateral bullish trend in the short term. There is no highest, only higher. Before the top pressure K appears, it will continue to step back and be bullish. The support position confirmed by the step back is about 3300-3290. As long as this position is stabilized, there is hope for further efforts in the future to set a new historical high.The 4-hour level is now in high-level fluctuations. The key MA10-day support moves up to 3313. As long as this moving average can be held, this cycle will still maintain a strong squeeze and pull up. At the hourly level, there will be a certain decline and correction in the short-term Asian session on Thursday, and it will be trapped in a shock consolidation. The next step is to wait patiently for the consolidation to end. The short-term pressure point middle track is also the 10-day moving average 3332-33 line. There may be multiple attempts here, but before breaking through, don't chase the rise! Pay attention to the lower track support 3313 below, and the upper track of the previous channel step back to confirm the range of 3300-3290, because the upward channel is uncertain whether there will be a false piercing. Therefore, it is recommended to wait for 3313, 3300-3290 to stabilize and rise next week, or break through 3332-33 and then step back to confirm stability, which is also bullish. After a sharp rise, it is just a small adjustment at a high level or sideways, which is to prepare for the next round of rise.
Next week's analysis:
Gold fell all the way in the US market on Friday, falling to 3283 at the lowest, but gold rose again in the second half of the night for risk aversion. Will gold return to a large range of fluctuations or end the adjustment? Then the trend of gold after the opening next week is very critical. If gold continues to rise strongly at the opening next week, then gold may be adjusted to the end, and gold bulls may continue to exert their strength. This will be seen after the opening of Monday.The gold 1-hour moving average is now continuing to diverge upward with a golden cross. If the gold 1-hour moving average turns in the short term, then the gold 1-hour will begin to adjust. So if the short-term opening is weak next week, then the gold 1-hour moving average may begin to turn, and if it is strong, it will continue to extend upward. Gold is suppressed by the downward trend line in the 1-hour short term. The short-term pressure of gold moves down to the 3332 line. If gold is still under pressure at 3332 after opening next week, then gold may continue to fluctuate downward in the short term, thereby driving the moving average to turn around. If it directly breaks through 3332 after opening, then gold will start to fluctuate in a large range.
Operation ideas:
Buy short-term gold at 3300-3303, stop loss at 3292, target at 3340-3350;
Sell short-term gold at 3350-3353, stop loss at 3362, target at 3310-3300;
Key points:
First support level: 3313, second support level: 3300, third support level: 3285
First resistance level: 3332, second resistance level: 3357, third resistance level: 3373

GOLD 4H ANALYZEHello dear traders,
I’ve been away for a while, but I’m back now to share fresh market analysis and trading signals.
As you can see on the gold (XAUUSD) chart, we’re continuously seeing the formation of new price highs. Every price correction in key zones can offer a great buying opportunity.
The price range between 3190 and 3195 is a high-potential buying area.
Make sure to pay attention to the note highlighted in the image.
Wishing you all success and happiness!

XAUUSD: Trading Strategy for Next Week
The upward trend of gold has not ended yet. Pay attention to the support level near 3,280. When the price reaches the support area, you can continue to go long.
All trading signals are accurate. I will keep sending signals. Don't miss them.
Trading Strategy for Gold Next Week:
xauusd buy@3280-3290
tp:3330-3350

When to Sell GOLD?? When will Gold STOP RISING? When will gold stop rising - When to sell gold and start investing in other assets
Hey everyone, Tradevietstock is back again! Today, I’m diving into gold investing after a hot streak in gold prices, with everyone in the media talking about it. There’s even some unofficial info and rumors claiming gold could reach 6,000USD per ounce. But what data shows that gold prices will continue to rise dramatically, maybe even double? And, more importantly, when will gold stop rising? And what is the exact time to sell it and take profit? Let’s break down the data below.
Our view at Tradevietstock is that gold won’t keep climbing like that. Instead, this is the time to look for opportunities to sell at the best price. FOMO (fear of missing out) at this point, chasing gold at its peak, can lead to significant losses, especially if you’re a short-term speculator.
Looking at recent movements, XAUUSD has surged for three consecutive sessions, each by around 3%. To me, this signals strong FOMO in the gold market—not a good sign for new buyers.
i. Gold Price History
1. Historical Data from 1970
Gold has seen significant spikes in the past, similar to the recent surge. Below is a summary of gold price history from 1987 to present, highlighting periods of strong consecutive increases and other key benchmarks.
2. The historical context at key moments
=> As we can see from the events above, gold tends to rise during periods of financial instability and geopolitical tension. However, from 2022 to now, gold prices have almost doubled, and all macroeconomic negative news has been priced in. So, when will gold stop rising and when to sell it?
ii. Probability Data
1. Quantitative Statistics
Below is a statistical comparison of XAUUSD gold prices with similar strong price movements observed in April 2025:
Looking at the data, we can see that gold prices generally decrease from the 30th session onward, after experiencing a 3% increase each session. The 30th session begins on April 9, 2025. Additionally, since 2024, gold has increased by more than 60%.
2. Probability Results
Based on probability calculations from April 9, 2025, the opportunity to buy new positions in XAUUSD is virtually gone. After the 10th and 30th sessions, it's no longer advisable to enter new positions. Instead, it's time to look for sell positions or lock in profits.
=> Since the cycle began, gold has accumulated for 213 consecutive sessions, while the average accumulation period for XAUUSD is about 290 sessions. This is quite close. The longer the accumulation phase, the stronger the price increase afterward. However, we’ve already seen a significant rise in gold prices, meaning most of the potential gains have already been priced in.
3. What Signals Confirm That Gold Prices Will Drop Sharply?
When will gold stop rising and when should we sell it? The answer is simple: we need clear confirmation signals from XAUUSD. In this case, the signal would be a sharp 5% decline in a single session. Based on statistical probability and historical data, such 5% declines have historically confirmed the start of a bear market for gold, meaning prices will either decrease or remain stagnant for an extended period.
A notable 5% drop occurred on May 15, 2006, when gold had previously surged by approximately 55% over a period of about 246 sessions. The outcome was that gold prices dropped by around 14% in the next 30 sessions.
Another example of when to sell occurred on December 4, 2009, when gold experienced a 4% decline after a previous gain of 24% over 144 consecutive sessions. Since the prior gain wasn’t exceptionally strong, XAUUSD only dropped around 6% in the following 50 sessions.
From these examples, we can conclude that gold tends to rise sharply after an accumulation cycle of about 200 sessions or more, with subsequent price increases of 50% or higher. The stronger the previous rise, the larger the drop afterward, typically around 14-15%.
4. Data from Gold Sentiment
When will gold stop rising? When should you sell gold? Based on the Gold Sentiment data from MacroMicro, it’s clear that as the Survey Diffusion Index increases, gold prices tend to rise. Conversely, when this index decreases, gold prices enter a correction phase, leading to a period of stagnation.
Currently, the Survey Diffusion Index has been declining since around March 2025. So when will gold stop rising? This suggests that the gold price may soon reach the end of its upward cycle. However, since this is a lagging indicator, selling or locking in profits requires considering additional factors.
iii. Conclusion
So, when will gold stop rising and when should you sell it? Will the price reach 6,000USD per ounce? According to our analysis, the right time to sell or lock in profits is when a 5% drop occurs in a single session. This conclusion is based on data, not speculation. Gold prices are unlikely to hit 6,000USD per ounce in the near future and will likely need to go through another cycle with an average accumulation period of 200 sessions. The price target to take profit could be around 3,600USD
I hope that the information in this When will gold stop rising article will help you begin your investment journey smoothly and with more confidence. Wishing everyone successful investments and profits!

Gold skyrocketing as expectedAs discussed throughout my yesterday's session commentary: "My position: Gold is soaring as it represents safe-haven asset, I'd prefer to stay with the trend (Bullish). I have attempted to Buy Gold on #3,208.80 and since Price-action tested #3,214.80 I moved my Stop on breakeven and it got triggered moments ahead which left me without order and Gold delivered #3,225.80 extension. However I have managed to re-Sell #3,225.80. I will keep Buying every dip on Gold for maximum Profit optimisation from my calculated re-Buy zones. #3,192.80 is Support for current Bullish motion."
Technical analysis: I have announced that Gold might skyrocket as next Resistance zone is priced at #3,322.80 / break of it might extend the uptrend towards #3,352.80 benchmark configuration. Gold has invalidated solid Neutral Rectangle on Hourly 4 chart and if you recall, delivered #2 additional Higher High’s extension (my chart’s explanation that Gold always delivers #3 Higher High's extensions ahead of full scale reversal, so practically I have one more Higher High’s to expect according to the cycle). DX (# -0.63% almost) is again turning the market sentiment to Bullish on Intra-day basis, and according to my estimations, current Buying sequence was due to the Trump's tariff's talks, which is being aggressively Bought due to the remarks.
My position: Congratulations for those who Bought Gold from #3,220's as per my advice.

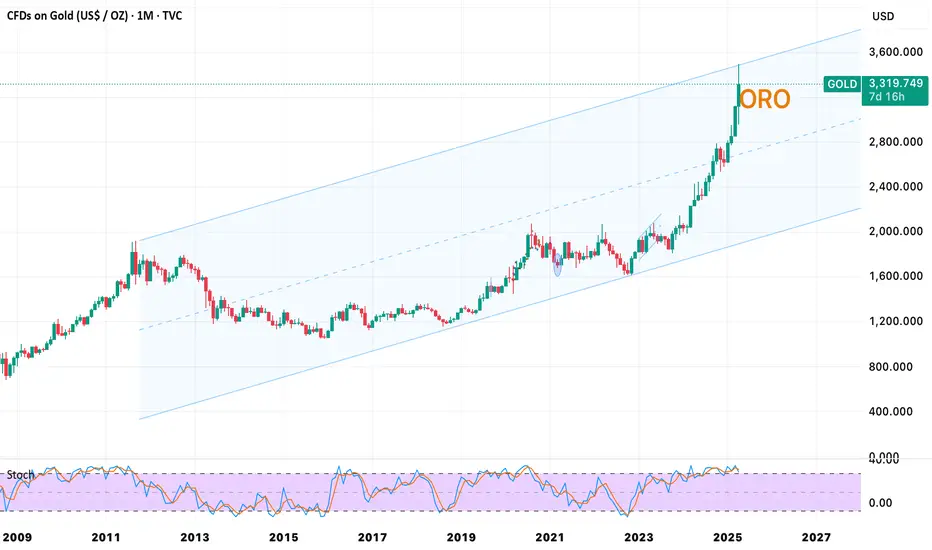
GOLD doing pullback after reaching top channelAdditionally of Trump news, the technical analysis create a great opportunity to have a pullback in gold, by joining the top of the channel plus RSI and Stochastic in overbought areas in Weekly, Monthly and Daily bases.
Potential Reversal in Gold After Completing Widening Formationhello guys!
The 4H Gold/USD chart exhibits a classic Broadening Formation (also known as a Megaphone Pattern), marked by higher highs and lower lows, reflecting increased volatility and market indecision. This pattern is identified with three key swing points on both the upper and lower trendlines:
Point 1 and Point 2 formed the initial boundaries of the pattern.
Point 3, recently touched, completes the structure by testing the upper boundary of the formation near $3,238, suggesting a potential bull trap, as illustrated in the schematic overlay.
just look at:
The price has sharply rallied to the top of the widening pattern, aligning with the third high, often a strong signal for reversal in this setup.
A rejection from this level is anticipated, supported by the bearish projection arrows targeting multiple demand zones.
Bearish Target Zones:
$3,180 – $3,160: Previous consolidation zone.
$3,140 – $3,120: Mid-pattern volume area with past price sensitivity.
$3,060 – $3,040: Major support zone with a strong volume node and previous reaction area.
Volume Profile Insight:
The volume profile shows significant activity in the $3,040 zone, reinforcing it as a major demand area where buyers might step in again.
__________________________
Summary:
This setup suggests a potential bearish correction after a strong upward move. If price action respects the pattern, traders may look for short opportunities from current levels with the outlined targets. Watch for confirmations such as reversal candlesticks or breakdowns of minor support levels.

XAU/ USD) bullish trend analysis Read The ChaptianSMC Trading point update
analysis for XAUUSD (Gold vs. USD) on the 2-hour timeframe appears to suggest a bullish continuation setup after a correction. Here's a breakdown of the idea:
Key Points from the Chart:
1. Rising Channel:
The price is moving within an ascending channel.
After a breakout and strong rally, it is currently in a flag or wedge-like correction pattern.
2. Correction Zone:
The price is consolidating downward inside a small descending wedge (a bullish pattern), potentially forming a bull flag.
This is typically a sign of continuation after a strong upward impulse.
3. Support Zone:
A 4H support level is marked around 3,301.416, which aligns with the lower boundary of the flag pattern.
This is a potential buy zone for price to react and bounce.
4. Target Point:
The target is projected at 3,404.254, implying a breakout to the upside if the support holds.
5. RSI Indicator:
RSI is currently around 65, with previous values near 80, suggesting a slight cooldown but still in bullish territory.
A slight drop in RSI might occur before the next bounce.
6. EMA 200:
The EMA 200 is well below current price (around 3,137), indicating a strong bullish trend.
Mr SMC Trading point
Possible Trade Idea:
Entry: Around the 3,301–3,305 support area.
Confirmation: Wait for a bullish reversal pattern (engulfing candle or strong bounce).
Target: Around 3,404 (as per the marked target zone).
Stop Loss: Below the support zone (e.g., below 3,295), depending on risk tolerance.
Pales support boost 🚀 analysis follow)

Will Gold pullback at 2.618 % ?On the way up, Gold is respecting Fibonacci ratios. Will it pullback at 2.618 %, especially since it is very extended on weekly timeframe?

Gold Dips From PRZ – Will Supports Hold for New ATH?Gold ( OANDA:XAUUSD ) started to correct again from the Potential Reversal Zone(PRZ) and near the Resistance lines . The question is, can Gold create a new All-Time High(ATH) again?
In terms of Elliott waves , Gold appears to be completing a main wave 4 . This main wave 4 is likely to complete near the Support lines and Support zone($3,168-$3,133) .
I expect Gold to either rise again after breaking the Resistance zone($3,220-$3,211) or near the Support zone($3,168-$3,133) and Support lines .
Do you think Gold can create a new All-Time High(ATH) again?
Note: If Gold breaks the Support zone($3,168-$3,133), we should expect a further correction from Gold.
Gold Analyze ( XAUUSD ), 1-hour time frame.
Be sure to follow the updated ideas.
Do not forget to put a Stop loss for your positions (For every position you want to open).
Please follow your strategy; this is just my idea, and I will gladly see your ideas in this post.
Please do not forget the ✅' like '✅ button 🙏😊 & Share it with your friends; thanks, and Trade safe.

Gold at it's Peak Now???Gold has pushed right though the HTF 0:1.618.
Now catching resistance at the 1:2.414 ratio band. If it pushes through this ratio, there is not much stopping it from hitting the upper 2.272 level.
If a correction were to start here (and it's about that time) this may be a clue that a rally up for crypto will begin soon, as this was this case for the last Gold correction that started in November 2024.
-Not Financial Advice-

Little more up for goldHi traders,
This is what I've said last week in my outlook: next week we could see a correction and more upside for this pair.
And I drew an arrow for the target. Now check the chart.
This is the power of wave analysis in combination with liquidity sweeps and FVG's!
For next week we could see a little more upside (finish grey wave 3) and after that a bigger correction for (grey) wave 4.
Let's see what price does and react.
Trade idea: Wait for a change in orderflow to bullish. After an impulse wave and a small correction down on a lower time frame you could trade (short term) longs.
If you want to learn more about trading FVG's & liquidity sweeps with wave analysis, please make sure to follow me.
This shared post is only my point of view on what could be the next move in this pair based on my technical analysis.
Don't be emotional, just trade your plan!
Eduwave

Gold rose by 100 points to a new highAs the former US Treasury Secretary pointed out, the Trump administration's erratic rhetoric and ever-changing tariff policy measures are gradually eroding the global market's trust in the US dollar. Investors are therefore seeking asset allocations with safe-haven properties. Gold, as a traditional safe-haven tool, naturally becomes the first choice. From the perspective of technical analysis, the bullish trend of gold prices is strong. After the opening, it has shown a unilateral upward trend, with significant intraday gains. In this market situation, it is particularly important to follow the price trend, and counter-trend operations often face greater risks. Based on the current market trend, the gold bull market is still expected to continue, and may even further hit higher points. In terms of trading operations, it is recommended to take a dip and buy more after a pullback to the key support level as the main strategy.
Today, gold rose to a new high, reaching 3317, and the increase was close to 100 points. The strength is beyond words. After the previous sideways accumulation, it continued to rise by inertia. It continued to be bullish and long. In the 4H cycle, it broke through the upper track of Bollinger, driving the moving average to turn upward, but the indicators diverged. It is prudent to buy more on the decline. The support below is maintained at 3288 and 3270. Buy more according to the strength of the decline. The upper side will gradually look to 3300 and 3320. Don't blindly guess the top!
Operation strategy:
1. It is recommended to buy more gold near 3270-72, stop loss at 3264, and target at 3300 and 3320! If it is very strong, rely on the support of 3288-90!


Place long orders after the adjustment is over!After gold accelerated its rise in the Asian session, it fell back in the European session and temporarily entered an adjustment cycle, accumulating strength to provide power for the next round of launch. The short-term support in the US session is 3430 and 3412. In terms of operation, go long according to the strength of the decline. There is still no guess on the top, and gradually look to 3480 and 3500! Short-term volatility has increased, and the notice has been issued before the market!
Operation suggestion: Gold is long near 3410-15, and look at 3445 and 3455!
