XAUUSD H1 Many Pattern
Rising wedge,
Inverse head and shoulders,
Double Top,
Expanding triangle
maybe Expanding triangle is active
price will go to close fair value gap @ 3409
to make QML
good luck
GOLD trade ideas

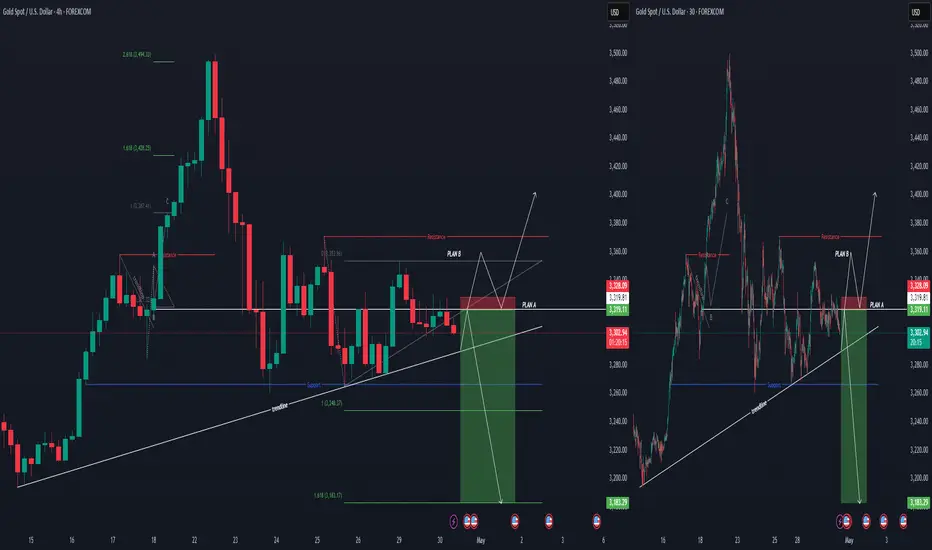
XAUUSD - Support & ResistancePrice is currently respecting the 4-hour ascending/descending channel (depending on trend direction).
We've seen a clear support and resistance structure forming within the channel.
The next key support level is at 3228 — watch for price action around this zone.
Also lining up with the 50% Fibonacci retracement level from the recent move.

Gold is set to experience another significant decline!Hello, traders
After analyzing the 2-hour chart, we can see that price has been bouncing around like a pinball between 3374 and 3264 — rejected twice at the top, supported twice at the bottom.
Currently, price is chilling at 3309, smack in the middle of the range, probably wondering what to do with its life.
Now, 3345 is standing tall as a strong resistance. If price finds the courage to break above 3345, it might speed its way up to 3419 like it’s late for a meeting.
But if it gets shy and turns back down, don’t be surprised to see it sliding toward 3148 instead — much easier, much faster, and with way less drama.

XAUUSDI think it will make an equal or lower peak that will not exceed its previous peak and will fall again to take power from its rising trend. While I expect a decline in the short term, I continue to expect a rise in the medium term.
If you have gold in your hand, of course do not sell. If you are interested in short-term trading, this analysis will help you.
My opinion is in favor of being patient and waiting in precious metals. I prefer to look long and medium term.
Gold has appreciated well, you are likely to see corrections in this period, but there is nothing to fear. It is a precious metal with increasing demand. If you have it, you can add to your position. If you want to buy gold, you can wait for the right levels and chase the buying opportunity.
GoldTVC:GOLD price overall is bullish indicating that bulls are in control of the market. However price is on consolidation at the moment but soon as price breaks the structure it well be heading for the previous highs 3,480.000 level before dropping to the downside forming a possible H&S pattern.

Daily Analysis- XAUUSD (Tuesday, 29th April 2024)Bias: Bullish
USD News(Red Folder):
-JOLTS Jobs Opening
Analysis:
-Strong pullback on asian session
-Looking retest to 0.236 fib level
-Potential BUY if there's confirmation on lower timeframe
-Pivot point: 3300
Disclaimer:
This analysis is from a personal point of view, always conduct on your own research before making any trading decisions as the analysis do not guarantee complete accuracy.

XAUUSD is moving within the 3,195.00 -3,495.00 range 👀 Possible scenario:
Gold prices fell 2.74% on April 23 after hitting a record high of $3,261, as President Trump softened his stance on trade tariffs, reducing demand for safe-haven assets. Markets also reacted to U.S. Finance Minister Bessent’s call for reciprocal tariff cuts with China to resume trade talks.
Looking ahead, traders await the U.S. Existing Home Sales report on April 24, which could impact gold—strong data may lift the dollar and pressure gold, while weak figures may boost it.
✅Support and Resistance Levels
Support level is now located at 3,195.00 .
Now, the resistance level is located at 3,495,00

XAU/USD: Trend Remains Strong as Price Holds Above Key SupportThe XAU/USD market continues its impressive rally, recently reaching a new all-time high at 3500 before pulling back toward support and the previous day's high. The price action completed an ABC structure prior to this retracement.
Currently, the market may be forming a triangle or flag pattern, similar to past consolidation setups. As long as the price remains above the upward trendline and the critical 3400 support level, the probability of a trend continuation remains high. A retest of the ATH level followed by a move higher is likely, with the next target at the resistance zone around 3520

Gold price decreased at the beginning of the week⭐️GOLDEN INFORMATION:
Gold prices (XAU/USD) edged lower toward $3,310 during the early Asian session on Monday, retreating from last week's record highs amid growing signs of easing global trade tensions.
US Agriculture Secretary Brooke Rollins revealed on Sunday that the Trump administration is engaged in daily discussions with China regarding tariffs, according to Reuters. Rollins also emphasized that agreements with several other countries were “very close” to being finalized.
"Headlines hinting at possible partial exemptions from retaliatory tariffs further lifted market sentiment and contributed to gold slipping below the $3,300 mark," noted Yuxuan Tang, strategist at JPMorgan Private Bank.
⭐️Personal comments NOVA:
At the beginning of the week, gold prices were mainly sideways, without much news impact, trading around 3300 and gradually decreasing.
⭐️SET UP GOLD PRICE:
🔥SELL GOLD zone : 3368- 3370 SL 3375
TP1: $3360
TP2: $3350
TP3: $3340
🔥BUY GOLD zone: $3212 - $3214 SL $3207
TP1: $3225
TP2: $3240
TP3: $3255
⭐️Technical analysis:
Based on technical indicators EMA 34, EMA89 and support resistance areas to set up a reasonable SELL order.
⭐️NOTE:
Note: Nova wishes traders to manage their capital well
- take the number of lots that match your capital
- Takeprofit equal to 4-6% of capital account
- Stoplose equal to 2-3% of capital account

Sell Limit GOLD SCALP Trade IdeaAccording to My Stratg and My Plan I am they Need to Move Down From This Limit. Let's See
DYOR,
Focus On Risk TO Reward And Think About 100 Trades.. Thanks

Next Move PossibleAs of April 29, 2025, the XAU/USD (gold) market remains highly volatile, influenced by geopolitical tensions, economic uncertainty, and central bank policies. Here’s an overview of the current outlook and potential next moves for gold prices:
📈 Current Market Overview
• Record Highs: Gold prices recently reached a record high of nearly $3,500 per ounce, driven by concerns over U.S.-China trade tensions, inflation, and geopolitical instability. 
• Recent Pullback: Following the peak, gold experienced a slight retreat, trading around $3,350 per ounce. This pullback is attributed to easing trade tensions and reassurances from U.S. President Trump regarding Federal Reserve Chair Jerome Powell. 
🔮 Forecast and Key Levels
• Short-Term Support Levels: Analysts have identified key support levels at $3,145, $2,955, and $2,790, based on historical highs and Fibonacci retracement levels. 
• Resistance and Profit-Taking: The $3,500 region is seen as a potential profit-taking point if gold mounts a recovery. 
• Long-Term Outlook: JP Morgan forecasts that gold prices will surpass $4,000 per ounce by Q2 2026, driven by heightened recession risks amid escalating U.S. tariffs and a prolonged U.S.-China trade conflict. Goldman Sachs also revised its 2025 year-end gold price forecast to $3,700/oz, noting that in extreme scenarios, gold could approach $4,500/oz. 
⚠️ Risks and Considerations
• Potential Decline: Morningstar analyst Jon Mills predicts a 38% decline in gold prices over the next five years, potentially falling to $1,820 per ounce, due to increased gold production and waning interest from central banks and investors. 
• Market Volatility: Gold’s status as a safe-haven asset makes it susceptible to sharp price swings in response to economic data releases, central bank decisions, and geopolitical developments.
For more updates follow my profile and share your thoughts.

Gold - 7000 USD by 2027 (must see, sell here!)Gold is extremely bullish, but nothing lasts forever. To trade gold profitably, you need to always trade with a trend. Clearly the trend is bullish, so we want to open only long positions and avoid short positions to increase the probability of success, and it doesn't matter if you are an intraday or swing trader. When can this huge uptrend end?
The price of gold is inside this huge ascending parallel channel on the monthly chart. This channel has a total of 5 touches, and we are waiting for the 6th touch to take action. I made a calculation, and gold will hit the top of the channel at around 7000 USD in around 2027. This channel is on the LOG scale, so to draw it, you need to switch from linear to LOG. This ascending channel started in 1993 and currently has 32 years!
From the Elliott Wave perspective, we are in wave 3, so expect a wave 4 pullback, probably this or next year. This upcoming pullback will drop the price by 20% to 30% based on historical data. But right now I am very bullish and expect much higher prices!
Please let me know in the comment section what your ultimate profit target for gold is. Are you also bullish? Trading is not hard if you have a good coach! This is not a trade setup, as there is no stop-loss or profit target. I share my trades privately. Thank you, and I wish you successful trades!

breakdown of chart analysis for XAU/USD (Gold Chart Analysis Summary
Pair: XAU/USD
Timeframe: 2H (2-Hour)
Trend: Recently broken bullish trendline (trendline break to the downside)
---
Entry Point:
Sell Entry: Around 3,336.235
---
Support & Resistance Levels:
Resistance Levels:
1. 3,336.235 – Previous structure, acting as immediate resistance after the trendline break
2. 3,354.275 – Recent high before the drop
Support Levels:
1. 3,280.059 – First major support zone (TP1)
2. 3,240.000 – Intermediate structure level
3. 3,201.285 – Final target (strong support zone)
---
Take Profit Targets:
TP1: 3,280.059
Final TP: 3,201.285
---
Trendline Break:
The ascending trendline was broken strongly, signaling potential shift to bearish momentum.
---
Trading Plan to Share:
> Gold (XAU/USD) 2H Bearish Setup
Sell Entry: 3,336.235
TP1: 3,280.059
Final Target (TP2): 3,201.285
Resistance: 3,336.235 / 3,354.275
Support: 3,280.059 / 3,240.000 / 3,201.285
Price broke below the ascending trendline indicating potential bearish continuation. I’m targeting support zones below for a short-term and mid-term drop

XAUUSD TRADE IDEA
Hi everyone,
here is my gold price movement forecast. My forecast tends to lean towards temporary strength for gold. Therefore, if there is a rejection at the trendline on the H4, I will wait for the price to come back to 3320 before shorting gold... If the price successfully breaks the entry price and makes a new high, I will look for opportunities to long towards 3402.
good luck all
**My trading strategy is not intended to be a signal. It's a process of learning about market structure and sharpening my trading my skills also for my trade journal**
Thanks a lot for your support
Can non-agricultural data break the deadlock of shocks!Let's sort out the news that have affected the trend of gold in the past two days:
On Tuesday (April 29), gold suddenly began to fall sharply in the Asian market, and the current gold price is around $3,316. Gold prices weakened during the Asian trading session on Tuesday, replicating the trend of the Asian market on Monday. Amid optimistic market sentiment, the recovery of US dollar demand seems to put downward pressure on gold prices. New optimism about the possible progress in trade negotiations between the United States and its major trading partners supports risk appetite and boosts the performance of the US dollar against major currency competitors. Gold sellers are trying to regain control.
On Monday, US Treasury Secretary Scott Bessent said that several major trading partners have made "very good" suggestions to avoid US tariffs, and India may be one of the first countries to complete the agreement. At the same time, US President Donald Trump softened his stance on China. In addition, there was new news about Trump's tariffs, which triggered a rebound in market risk appetite. At present, the conflict between India and Pakistan has intensified, the geopolitical situation has become tense, and the market's risk aversion has heated up. In addition, this week is a "super week" and US employment data has become the focus. The specific arrangements are: JOLTS job vacancies will be released on Tuesday, ADP employment report will be released on Wednesday, initial jobless claims will be disclosed on Thursday, and the April non-farm employment report will be released on Friday.
Now the gold price has fallen from a high level, reaching a minimum of 3305 for a rebound. If there are traders waiting for the operation ideas during the European trading session, my suggestion is to wait until the rebound near 3329 to intervene in short orders and bearish (aggressive ones can directly enter the short order at 3325 and wait for the rebound to 3329 to increase positions). See if today's low of 3305 will fall below, followed by around 3285. Overall, today's short-term operation ideas for gold are mainly rebound shorting and callback longing. The short-term focus on the upper side is 3329-3339 resistance, and the short-term focus on the lower side is 3300-3290 support.
At the same time, please pay attention to the information and data releases that affect the trend. These will affect the price of gold at the last closing time of this week and the trend of the opening next week!

XAUUSD BEARISH Major bearish sentiment detected by my quantitative analysis mechanisms. Price should drop to 1800. This outcome is extremely likely.

Gold and Chart Patterns I’m dropping this XAU/USD M30 insight because my system’s a damn executioner, and you need to see how I hunt the market. This chart is a textbook of bearish patterns—first a bearish three drives showing smart money exhausting buyers with three weakening upward pushes, then a head and shoulders with the neckline break confirming the reversal, and now a bearish shark forming to seal the deal, all playing out within my descending trendlines. Smart money’s been in control from the start, distributing at the peaks, grabbing liquidity, and dumping price to hunt stop-losses below key levels. Supply and demand zones are my edge—supply at the right shoulder of the head and shoulders where sellers stacked orders before the break, demand near the lower trendline where buyers might step in, my target for this bearish move. My checklist operations are a predator’s playbook. I start with harmonic patterns, hunting XABCD structures like the bearish shark I’m seeing now, signaling smart money’s reversal zones. I confirm market structure, looking for breaks of structure to show trend shifts—here, the neckline break confirms bearish continuation. I identify order blocks, those consolidation zones where smart money stacks orders, like the bearish order block at the right shoulder where sellers distributed. Volume profile is key—I check for high volume nodes where price stalls, like the neckline where sellers defended, and low volume nodes that act as magnets, like gaps below the neckline. Top-down analysis keeps me sharp—four-hour timeframe sets the bearish trend, one-hour confirms the break, thirty-minute narrows the setup, fifteen-minute is my strike zone, waiting for a neckline retest. I use Heikin Ashi for confirmation—red candles mean sell, waiting for red on the fifteen-minute at the retest. Fibonacci levels mark my targets—I focus on key extensions to set exits, like targeting the lower trendline of the channel. Gann theory adds confluence—I look for angles or retracements to align with my setups, like a Gann angle pointing to the lower trendline. MACD and RSI measure momentum—MACD’s bearish crossover and negative histogram confirm the downtrend, RSI below fifty with bearish divergence at the right shoulder seals it. Risk management is my law—I risk small to win big, stop-loss above the right shoulder, take-profit at the lower trendline, aiming for a high reward ratio. I monitor news and liquidity traps—fake spikes above the neckline are smart money’s tricks, so I stay sharp. I wait for confirmation—every piece aligns, or I walk, then I document to keep my edge razor-sharp. I’m rating this system a ten out of ten—harmonic patterns, Smart Money Concepts, volume profile, top-down analysis, and now MACD and RSI for momentum make it untouchable. I’ve fine-tuned this over six months, backtesting until it’s a weapon. I need two of you to join me at Academia—let’s hunt together.DYOR
Shieldsmine Diaries

GOLD BUY NOW!!!!Gold took out the buyside liquidity with a retest am looking forward to see price maintain stability and clear all the liquidity above 3,363 is my measure target........

GOLD SMASHES THROUGH $3,450🚨 GOLD SMASHES THROUGH $3,450 – IS THIS THE START OF A GLOBAL FINANCIAL RESET? 🚨
🔥 Unstoppable Surge in Motion 🔥
Gold has soared past $3,450 as Asian markets opened, climbing over $100 a day!
In just two weeks, gold is up by over $500 — this isn’t just a rally, it’s a major structural breakout.
A surge in demand from Chinese funds appears to be fuelling the rise, with increasing evidence that Asia is leading a strategic shift away from fiat risk.
💷 Is the Dollar in Decline? Investors Flee the Old System 💷
The US Dollar Index (DXY) has taken a sharp downturn — confidence in USD is clearly under pressure.
Capital is flowing out of the United States, signalling a move away from the traditional financial order dominated by the dollar.
This gold rally isn't just about price — it's a global vote of no confidence in the status quo.
📉 Implications for the UK
With the pound holding relatively stable against the dollar, this gold spike presents a unique hedge opportunity.
For UK investors, rising gold prices could help offset currency risk and inflation concerns — especially in the face of persistent market uncertainty and geopolitical tensions.
📊 Technical Overview 📊
Gold is currently testing critical resistance around $3,519.
A pullback may see it retest support at $3,416 or as low as $3,210.
Fibonacci levels indicate a likely consolidation zone around $3,416.
The momentum is strong — we could be in the early phase of a global asset rotation.
📈 2-Hour Gold Chart Insight
Recent charts show a parabolic move with significant volume, primarily from Asia-based buyers.
This is not a short-term speculative move — it's likely a long-term strategic repositioning.
🌍 What Comes Next? 🌍
Should gold maintain levels above $3,450, a move towards $3,600 and beyond looks increasingly likely.
Talk of a financial "reset" is no longer just fringe theory — it’s entering the mainstream conversation.
From a UK perspective, now could be the time to:
Re-evaluate gold as a portfolio stabiliser
Reconsider exposure to US-denominated assets
Anticipate further volatility across fiat currencies
📌 Key Price Levels to Watch:
Resistance: $3,519 / $3,601
Support: $3,416 / $3,210
Upside Target: $3,600+
📈 Suggested Trading Zones:
Buy Zone
Entry: $3,424 – $3,422
Stop Loss: $3,418
Take Profit Targets: $3,428 / $3,432 / $3,436 / $3,440 / $3,450
Sell Zone
Entry: $3,604 – $3,606
Stop Loss: $3,610
Take Profit Targets: $3,600 / $3,596 / $3,592 / $3,588 / $3,584 / $3,580
💬 What’s your take? Is gold signalling the end of USD dominance?
Is the UK prepared for a global monetary shake-up? Let’s discuss. 🪙

GOLD Support Ahead! Buy!
Hello,Traders!
GOLD is making a local
Bearish correction but
It is trading in a long
Term uptrend so we
Are bullish biased and
We will be expecting
A local bullish rebound
Buy!
Comment and subscribe to help us grow!
Check out other forecasts below too!
Disclosure: I am part of Trade Nation's Influencer program and receive a monthly fee for using their TradingView charts in my analysis.

XAUUSD Profit signalLast Friday, gold hit the bottom again, with a big negative line all the way to around 3270. Of course, this position is also an obvious double bottom pattern, and it is also an obvious temperature. At present, the bullish form is still there, and the support level is still strong.
The gold four-hour line continues to maintain the bottom signal. The two big positive lines at the bottom support it, and it is also an obvious double bottom rhythm. The two big positive lines start to exert force directly from below the moving average, directly breaking through the rhythm of the sky, and the positive line crushes the moving average, stepping on the moving average to pull up. This is an obvious bullish strength. The K line just falls back, and it is definitely not a U-turn. Therefore, continue to go long in the 3270 area

TP hit TP hit for today. As previously predicted, price was able to fall to my target. Now I will leave it alone and monitor it's move by the end of the day

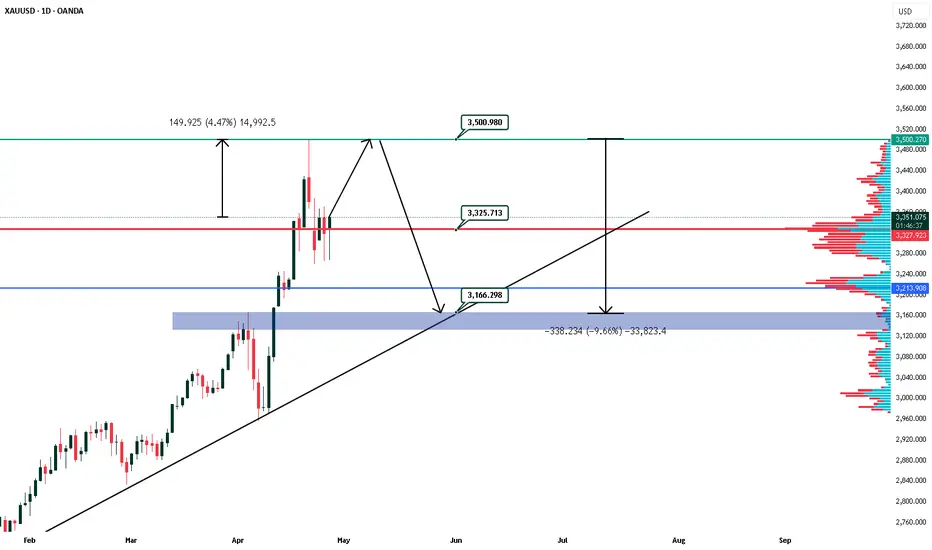
Fading Gold’s All‑Time HighGold has just posted a euphoric all‑time high at 3 499.6 after an almost parabolic climb along a single ascending trend‑line, and the wick that pierced that level sits in a thin, low‑volume pocket on the profile—classic bull‑trap territory—so once we see a four‑hour close beneath the trend‑line we expect momentum algos to flip, dragging price swiftly toward the 3 160‑3 130 demand block that marks the prior high‑volume consolidation; the short thesis is to scale into shorts between 3 480‑3 510, place invalidation above 3 525, and ride a potential vacuum move to that target zone (with room to extend toward 3 100) as crowded longs unwind, especially if a hawkish Fed headline or uptick in real yields provides the spark.
