Gold price has stopped falling, can we buy higher?The short-term 4-hour middle track 3380 has been lost and has become a key counter-pressure point. As long as it does not stand above it again, it will maintain a downward correction. After breaking 3292 below, it will be the 66-day moving average of 3260. The 1-hour K-line is under pressure, After last night's consolidation and pull-up,plus MACD has a golden cross below the zero axis. This wave of $200 rapid decline has almost corrected most of it. If it continues downward for another wave, or with the help of bottom divergence, it will slowly brew a short-term bottom; today's gold rebound focuses on the resistance below 3340, below the extreme middle track 3356, it is still bearish if it cannot withstand the pressure, and it will start to consider bottom-fishing if the strong support 3260 or 3245 is stable;
GOLD trade ideas
Gold Knocked Out at the Top – Bears Said ‘Not TodayPrice tapped into a key supply zone around 3,330–3,335 and showed immediate rejection. Entry was taken at the retest with a tight stop above the zone. Targeting the previous demand area near 3,293, and the bearish momentum followed through perfectly. Patience paid off — textbook supply zone reaction on the 45m chart!

Long Position After failing to break the current support, price is likely to reversed to the upside and retest the previous resistance which was a resistance and if enough momentum it should break this resistance and swip the upside liquidity

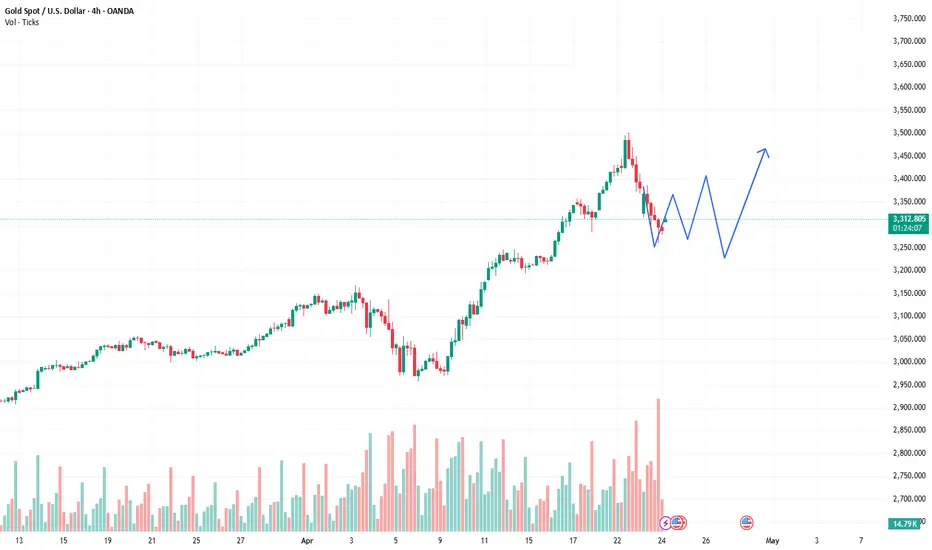
Gold Madness –5k Pips in 10 Days,drop almost 2k after. Now What?The last 10 trading days in Gold can be summed up in just one word: madness.
Back on April 9, the price was still under 3000 – yesterday it kissed 3500, marking an explosive 5000-pip rally in less than two weeks. That’s over 15% gain in no time!
🔙 As I mentioned in yesterday’s educational post , even though I expected a major correction, the lack of a clear stop loss setup made me choose the safest option: staying out.
Well, Gold did what it does best – surprise. Just before reaching a new all-time high, price reversed and at the time of writing, it has already dropped over 1600 pips from the peak.
📉 From a technical perspective, there are some important developments:
- Price has broken below the rising trendline, signaling a potential shift on short term
- Now, it's heading towards the 3250 support zone, which is aligned with the 50% Fibonacci retracement of the recent rally.
- This area could become a battleground – if bulls step in, we might see another bounce.
💡 Trading Plan:
From the selling side, the only potential setup I see is around 3450, but with a huge stop loss, making it less attractive.
On the buy side, I’ll be watching the 3250 level closely. If price action shows strength there, I may consider entering long – but only if the market conditions align properly.
Until then, I’m observing from the sidelines. No FOMO – just disciplined strategy. 🚀
Disclosure: I am part of Trade Nation's Influencer program and receive a monthly fee for using their TradingView charts in my analyses and educational articles.

Gold trading brief: 23-APRIL-2025Your daily Gold trading briefing: Zones, insights, and opportunities.

DeGRAM | GOLD Held Support Level📊 Technical Analysis
Gold’s slide paused at $3 315; holding here keeps $3 500 – 3 520 in play.
💡 Fundamental Analysis
• PBoC has been buying for 5 months in a row.
• WGC expects strong demand from central banks in 2025.
• Trade wars, tensions in the Middle East and South Asia are causing risks that are increasing demand for gold.
• IMF warns new tariffs could slow growth, boosting safe-haven bids.
• Western ETFs had bought ≈240 t by mid-April.
• DXY is at 3-year lows and yields are down.
✨ Summary
Strong central-bank buying, renewed ETF inflows, softer USD yields and rising geopolitical risk align with chart support, favouring a rebound toward $3 500 – 3 520 while $3 315 holds.
-------------------
Share your opinion in the comments and support the idea with a like. Thanks for your support!

(XAU/USD) Bullish Setup: Demand Zone Bounce with 5.89% Trgt Ptnl🔵 Current Price: $3,451.03
🟡 EMA (9): $3,457.20
🔻 Price is just below EMA — short-term pressure.
Zones & Key Levels:
🟦 Demand Zone:
🔽 Price bounced here before — strong buyer interest!
📍 Zone Range:
* Top: $3,442.38
* Bottom (Stop Loss): $3,395.87
* 🔴 Stop Loss set here to limit risk.
🟨 Entry Point:
* Entry suggested at $3,457.20
* Just above the current price and EMA — needs confirmation
* ⚠️ Wait for bullish candle or price action signal above EMA
🟩 Target Point:
🎯 Target: $3,645
* 📈 Potential gain: +202.78 pts (5.89% upside)
* 🚀 Aiming to break previous ATH (All-Time High)
Visual Trade Plan Summary:
* ✅ Buy Entry: $3,457.20
* ❌ Stop Loss: $3,395.87
* 🎯 Target: $3,645.00
* ⚖️ Risk-to-Reward: Solid, over 3:1
Sentiment:
* If price respects demand zone and reclaims EMA — bullish setup
* 🕵️♂️ Watch for volume or confirmation candle near entry

Gold - 7000 USD by 2027 (must see, sell here!)Gold is extremely bullish, but nothing lasts forever. To trade gold profitably, you need to always trade with a trend. Clearly the trend is bullish, so we want to open only long positions and avoid short positions to increase the probability of success, and it doesn't matter if you are an intraday or swing trader. When can this huge uptrend end?
The price of gold is inside this huge ascending parallel channel on the monthly chart. This channel has a total of 5 touches, and we are waiting for the 6th touch to take action. I made a calculation, and gold will hit the top of the channel at around 7000 USD in around 2027. This channel is on the LOG scale, so to draw it, you need to switch from linear to LOG. This ascending channel started in 1993 and currently has 32 years!
From the Elliott Wave perspective, we are in wave 3, so expect a wave 4 pullback, probably this or next year. This upcoming pullback will drop the price by 20% to 30% based on historical data. But right now I am very bullish and expect much higher prices!
Please let me know in the comment section what your ultimate profit target for gold is. Are you also bullish? Trading is not hard if you have a good coach! This is not a trade setup, as there is no stop-loss or profit target. I share my trades privately. Thank you, and I wish you successful trades!

Gold’s Next Trap? Don't Blink“Gold’s Next Trap? Don't Blink. 👀💣”
📅 Daily XAUUSD Sniper Plan – April 25, 2025
Clean structure. No noise. Just logic.
🧭 MARKET CONTEXT
• Macro: No major USD catalyst. Yesterday's Unemployment Claims were neutral → price action driven by structure & liquidity.
• Sentiment: Gold remains in premium territory but failed to hold above 3355 in NY → suggesting smart money profit-taking.
• HTF Bias: Bullish (D1 trend intact, HLs hold)
• LTF Flow: Bearish intraday – CHoCH & BOS on M30-H1
• Key Event Backdrop: Powell not speaking today, but market still reflects uncertainty from recent Trump vs. Powell tensions.
📐 STRUCTURE & SMC FLOW
• M30–H1: Internal CHoCH formed after price failed to break above 3355
• Liquidity: Sweeps above 3353 and below 3312 → now hovering around internal equilibrium
• SMC Confluence: OBs, FVGs, and EMA alignment used for all entries
• FIB Zones: Discount for buys (3280–3310), Premium for sells (3385+)
🔻 SELL SCENARIOS
Sell #1 – 3385–3392
🧨 Premium retest zone + H1 OB + Gap mitigation
• SL: 3401
• TP1: 3355
• TP2: 3333
• TP3: 3306
🎯 Confluence: H1 OB, NY liquidity above, internal CHoCH
Sell #2 – 3411–3422
💣 Extended premium fill – final imbalance trap
• SL: 3432
• TP1: 3372
• TP2: 3333
• TP3: 3306
🎯 Confluence: Unmitigated FVG + fib extension 1.272 + clean wick rejection zone
🟢 BUY SCENARIOS
Buy #1 – 3333–3338
🔋 HTF OB + H4 structure demand
• SL: 3322
• TP1: 3360
• TP2: 3385
• TP3: 3410
🎯 Confluence: HTF FVG, historical bounce zone, EMA100 support
Buy #2 – 3284–3288
🧱 Sniper reentry zone from structure base
• SL: 3270
• TP1: 3312
• TP2: 3340
• TP3: 3372
🎯 Confluence: Previous sniper entry, structure HL, strong OB zone
📊 TREND RECAP
• HTF Trend: Bullish
• LTF Structure: Currently in retracement mode
• Bias: Neutral to bearish for early London, bullish only on clean 3333 reaction or deeper dip to 3284
🫂 COMMUNITY CALL
"Gold’s Next Trap? Don't Blink. 👀💣"
Will 3450 Hold? Or is Gold Just Getting Started? 🔄🧠
Which setup are you watching tomorrow? Let’s catch these sniper entries together – drop your bias in the comments 💬👇
TradingView's been too quiet lately – if this helped, hit that ❤️ and show some love.
Let’s grow this smart gold tribe together!
Smart plans, no hype. If you’re riding gold with logic, drop a 💡 below and let's connect!

Gold Stuck in Limbo- Sell Rallies, Ride the DropAfter the explosive rally that pushed Gold up to the 3500 area, the market quickly reversed with a sharp sell-off on April 22–23, dropping almost 2500 pips.
Since then, price has entered a consolidation phase.
Initially, the range was between 3270 and 3370, but since yesterday, the range has started to tighten — a classic sign that a breakout is approaching.
Looking at the structure, we’re dealing with a blow-off top followed by a range with clear support and resistance levels. In this context, I lean toward a downside breakout.
The key support is now at 3300 — and a break below it would likely expose 3270 again.
However, I don’t expect the move to stop there. If 3300 is broken, a continuation toward the 3200 zone becomes very likely.
🔹 Trading Plan:
As long as price stays below the 3360–3370 resistance zone, the strategy is to sell rallies, especially when price approaches the upper boundary of the range. Entries can be taken on rejection candles or confirmation patterns near resistance, with stops just above 3370. If 3300 breaks, watch for continuation setups toward 3200.
Only a sustained breakout above 3370 with strong bullish momentum would invalidate the bearish scenario and call for a reassessment.
Disclosure: I am part of Trade Nation's Influencer program and receive a monthly fee for using their TradingView charts in my analyses and educational articles.

Fading Gold’s All‑Time HighGold has just posted a euphoric all‑time high at 3 499.6 after an almost parabolic climb along a single ascending trend‑line, and the wick that pierced that level sits in a thin, low‑volume pocket on the profile—classic bull‑trap territory—so once we see a four‑hour close beneath the trend‑line we expect momentum algos to flip, dragging price swiftly toward the 3 160‑3 130 demand block that marks the prior high‑volume consolidation; the short thesis is to scale into shorts between 3 480‑3 510, place invalidation above 3 525, and ride a potential vacuum move to that target zone (with room to extend toward 3 100) as crowded longs unwind, especially if a hawkish Fed headline or uptick in real yields provides the spark.

GOLD → The rally continues. Waiting for correction to tradeFX:XAUUSD supported by the weakness of the dollar and increased trade tensions between the U.S. and China continues to renew highs. At the moment the market is testing 3400...
After Friday's pullback caused by profit taking, the demand for gold rose again - investors are looking for protection amid the threat of recession in the U.S. and instability in the markets. Additional pressure on the dollar is exerted by the threat to the independence of the Fed, after statements about the possible resignation of Jerome Powell.
It is not worth buying at the highs. Technically, against the background of the uptrend, the market can take a break in the form of a pullback. A bounce from support or a false breakdown of the liquidity zone may provide a good opportunity to enter the market
Resistance levels: 3400, 3410, 3430
Support levels: 3369, 3357, 3344
Undoubtedly, based on the overall fundamental situation, gold is absorbing capital as a safe haven and can continue its growth for a long time. But we should keep an eye on the situation between the US and China, as well as in Eastern Europe. Any de-escalation of the conflict may lead to a correction.
For trading now it is worth waiting for a correction to the above mentioned support levels to find a trading opportunity.
Regards R. Linda!

Gold Hits New ATH Again: Is the Bull Run Unstoppable?After printing a new All-Time High on April 17, Gold entered a brief correction that ended on April 18 at 3285. However, the daily candle closed strong at 3327, right before the long Easter weekend.
Fast forward to Monday's ASIA session open, Gold showed no hesitation and pushed into yet another ATH at 3384.
The bullish momentum is so aggressive that it feels like nothing can stop this trend. While I do expect heavy volatility going forward, the core strategy remains clear:
👉 Buy the dips.
Key Level to Watch:
📍 First support zone = 3350
At this level, I will actively look for long entries, targeting a potential new ATH later this week.
Disclosure: I am part of Trade Nation's Influencer program and receive a monthly fee for using their TradingView charts in my analyses and educational articles.

Gold Daily Outlook Short-Term Pullback Before Trend Continuation📌 Gold Daily Outlook – Short-Term Pullback Before Trend Continuation? 💡📉
📊 Technical Overview
Gold (XAU/USD) is currently testing a key resistance zone around 3412 – 3414, where we could see short-term selling pressure emerge after recent bullish momentum. Following a strong rally, the market may be preparing for a healthy retracement to collect liquidity before resuming the trend.
The chart shows signs of a potential intraday distribution pattern forming near highs, especially as price struggles to break above resistance during the early Asian session. Today’s outlook leans toward a short-term dip into support zones before buyers potentially step back in.
🔴 SELL ZONE (Short-term Reversal Opportunity)
Entry: 3412 – 3414
Stop Loss: 3420
Take Profit: 3409 → 3400 → 3390 → 3380 → 3370
This is a high-probability reversal zone. If price prints bearish confirmation (e.g., pin bar or engulfing candle), short entries may offer favourable risk-reward setups.
🟢 BUY ZONE 1 – Minor Pullback Area
Entry: 3355 – 3353
Stop Loss: 3348
Take Profit: 3358 → 3370 → 3380 → 3390 → 3400
Ideal for quick buy setups if price reacts cleanly to this mid-structure level.
🟢 BUY ZONE 2 – Deeper Support for Trend Re-entry
Entry: 3335 – 3333
Stop Loss: 3328
Take Profit: 3338 → 3350 → 3360 → 3370 → 3380
If a deeper pullback occurs, this zone may act as a key demand area and offer clean trend continuation opportunities.
🌍 Fundamental Insight
No major economic events are scheduled today, so market direction will likely follow technical structure.
USD is showing mild intraday strength, adding some pressure on gold in the short term.
Overall sentiment still supports gold as a safe-haven, but short-term profit-taking near highs is expected after recent aggressive buying.
⚠️ Strategy Notes
Focus on trading within defined structure: Sell from resistance with confirmation; buy dips at clean support zones.
Avoid FOMO entries – let the market give you confirmation.
Always use clear TP/SL levels – especially in a sensitive market environment like this.
💬 How are you approaching gold today? Looking to fade highs or waiting for dip-buy setups? Drop your thoughts below! 👇👇👇

"Gold on Fire: Eyeing $3500 After RBR Zone Rebound! "1️⃣ Trend Overview
📈 Strong bullish rally from April 11 to the peak.
📉 Pullback after reaching the recent ATH (All-Time High) zone.
2️⃣ Key Zones
🔵 RBR Zone (Rally-Base-Rally):
Marked support area between $3,271.41 and $3,307.04.
Acts as a buy zone / entry point.
🟣 ATH Zone:
Minor resistance from the recent high.
Price pulled back from here before potentially continuing up.
3️⃣ Entry & Target
✅ Entry Point: Around $3,307.04 (top of RBR zone).
🎯 Target Point: Clearly defined at $3,500.71.
Potential Gain: +188.59 points
ROI: +5.70%
4️⃣ Indicator
📊 EMA (7, close):
Currently at $3,329.09
Price is slightly below EMA = short-term correction or pause.
Strategy Summary
🟢 Buy Setup:
Wait for price to return to RBR zone
Enter long position ✅
Target $3,500 🚀
⚠️ Risk Consideration:
Place stop-loss below RBR zone for safety.

Gold H4 | Falling toward a pullback supportGold (XAU/USD) is falling towards a pullback support and could potentially bounce off this level to climb higher.
Buy entry is at 3,239.50 which is a pullback support that aligns close to the 50.0% Fibonacci retracement.
Stop loss is at 3,190.00 which is a level that lies underneath a swing-low support and the 61.8% Fibonacci retracement.
Take profit is at 3,348.70 which is a multi-swing-high resistance.
High Risk Investment Warning
Trading Forex/CFDs on margin carries a high level of risk and may not be suitable for all investors. Leverage can work against you.
Stratos Markets Limited (tradu.com):
CFDs are complex instruments and come with a high risk of losing money rapidly due to leverage. 63% of retail investor accounts lose money when trading CFDs with this provider. You should consider whether you understand how CFDs work and whether you can afford to take the high risk of losing your money.
Stratos Europe Ltd (tradu.com):
CFDs are complex instruments and come with a high risk of losing money rapidly due to leverage. 63% of retail investor accounts lose money when trading CFDs with this provider. You should consider whether you understand how CFDs work and whether you can afford to take the high risk of losing your money.
Stratos Global LLC (tradu.com):
Losses can exceed deposits.
Please be advised that the information presented on TradingView is provided to Tradu (‘Company’, ‘we’) by a third-party provider (‘TFA Global Pte Ltd’). Please be reminded that you are solely responsible for the trading decisions on your account. There is a very high degree of risk involved in trading. Any information and/or content is intended entirely for research, educational and informational purposes only and does not constitute investment or consultation advice or investment strategy. The information is not tailored to the investment needs of any specific person and therefore does not involve a consideration of any of the investment objectives, financial situation or needs of any viewer that may receive it. Kindly also note that past performance is not a reliable indicator of future results. Actual results may differ materially from those anticipated in forward-looking or past performance statements. We assume no liability as to the accuracy or completeness of any of the information and/or content provided herein and the Company cannot be held responsible for any omission, mistake nor for any loss or damage including without limitation to any loss of profit which may arise from reliance on any information supplied by TFA Global Pte Ltd.
The speaker(s) is neither an employee, agent nor representative of Tradu and is therefore acting independently. The opinions given are their own, constitute general market commentary, and do not constitute the opinion or advice of Tradu or any form of personal or investment advice. Tradu neither endorses nor guarantees offerings of third-party speakers, nor is Tradu responsible for the content, veracity or opinions of third-party speakers, presenters or participants.

How to break through the heavy pressure from above?From the analysis of the 4-hour line, today's support is around 3300-3310. If it falls back during the day, you can buy more once before rebounding. The upper short-term resistance is around 3340-3356, and the focus is on the suppression of 3380-90. The overall support is to maintain a wide range of long and short fluctuations in this range. In the middle position, watch more and move less, and follow orders cautiously, and wait patiently for key points to enter the market.
Gold operation strategy:
Gold rebounds at 3340 and goes short, rebounds at 3360 and covers short positions, stops at 3367, targets 3300-3310, and continues to hold if the position is broken;

Gold prices fall under double top pressureGold closed above 3313 yesterday, and reached 3353 at the end of the trading day. Today, the gold price fell back. Currently, the gold price is under the double top pressure of 3370 above and under the multi-bottom support of 3260 below. The market outlook mainly focuses on the shock adjustment in this range. The middle track of the Bollinger band at the hourly level is around 3322, which can be used as a watershed of strength and weakness. After the gold price falls below the middle track of the Bollinger band today, it is likely to go to the lower track of the Bollinger band, and it is more likely to test the shock bottom of 3260.

XAUUSD 1HGold Analysis
Continuing the previous analysis
The market faces a critical test at 3340.
A confirmed break and stabilization above this level would invalidate today's analysis and shift the trend bullish.
However, based on precise mathematical modeling, the expectation is clear:
The market is likely to fail in breaking above 3340, opening the way for a strong bearish move toward:
3235
3170
3130
Stay disciplined, trust the math, and move with confidence.
In a world full of uncertainty, we follow certainty.
Stay with me!

GoldXAUUSD
- Symmetrical Triangle as an corrective pattern in Short Time Frame
- Impulse correction
- Completed " 12345 " Impulsive Waves and " ABC " Corrective Waves
- Break of Structure
- Change of Characteristics

Gold will form a double top next week and then fall toward 2600.Gold will form a double top next week and then fall toward 2600.Of course, everything is hypothetical. If the correction trades time for space, it may not fall as much. It could consolidate sideways for a long time. In short, I think the uptrend has paused for now. If a double top forms next week, it’s a good opportunity. Let’s wait and see.

XAUUSD – Daily Trading Plan – April 28, 2025🎯 Market Outlook:
Gold remains trapped in a corrective range between 3260 and 3380, after an aggressive rally to new all-time highs.
Currently, price is consolidating just below a major supply/flip zone (3380–3395) and above a key support pocket (3260–3280).
HTF (High Timeframe) bias: Still bullish as long as the 3220–3235 pivot holds.
LTF (Lower Timeframe) flow: Sideways, with minor bullish attempts inside the range.
🔥 Key Zones to Watch:
Resistance Zones:
3380–3395 → Major flip and strong resistance zone.
3350–3360 → Minor local resistance inside premium.
Support Zones:
3260–3280 → Major intraday support + liquidity pocket.
3220–3235 → Last pivot to maintain bullish HTF bias (critical for any continuation).
👀 Eyes On:
Price reaction inside 3380–3395 → Will it reject again or break through to unlock 3410–3430?
Weakness signs near 3350–3360 → Watch for potential bull traps if momentum fades.
Respect for 3260–3280 → A bounce from here would confirm buyers still protecting liquidity pockets.
HTF invalidation below 3220 → Would flip the entire structure bearish short-term.
📢 Final Words:
Goldie's playing chess, not checkers — patience and sniper precision will make the difference this week. ♟️✨
Stay sharp, stay smart — we trade real flow, not hopes or dreams.
🔔 Follow the flow, adapt the plan, and let's continue hunting clean moves together!
#Gold #XAUUSD #SmartMoney #MindsetMatters #GoldMindsFX

Falling into range oscillation, just get the rhythm pointAnalysis of gold market trend
On Thursday, the gold price remained in the 4H channel, and the middle and lower tracks were in the range of 3370-3260, with overall resistance to decline and correction; this trend is also normal;
1: In the early stage, the market fluctuated rapidly with a hundred points rise and fall, and the kinetic energy consumption was large, so the short-term trend returned to the consolidation trend later;
2: The fundamentals stopped, the technical demand was corrected, and the two resonated, and the gold price could only fluctuate and consolidate in the range; the analysis framework given yesterday was treated according to two intervals; they were 3370-3260 and 3370-3480; the strong and weak dividing point was 3370 above and below;
We can also see that at the position of 3370, the gold price has been under pressure for 2 consecutive times and fell for 2 consecutive times; it can be seen that the strong and weak dividing point of the position above and below 3370!
At present, the market:
1: Trend: There is no trend for the time being, and the range is high, the large range is 3480-3260; the bull trend is stagnant, and the bear trend stops falling. The trend cannot be judged for the time being;
2: Fundamentals, the future fundamentals will focus on the US debt crisis, trade war tariffs, and subsequent war issues, two core things; and uncertain fundamentals
Today's market:
1: 4 hours, the stochastic indicator golden cross, the main long signal; in terms of form, slow bull rise; the current pressure position of the central axis is near 3370, and the probability of breaking upward is relatively high; therefore, the 4-hour can be treated as a shock rise; but the overall situation remains in the large range of 3480-3260!
2: In the daily K-line, the stochastic indicator diverges periodically, and the death cross is downward, which is a bearish signal; however, the high-level sell-off forms a sideways resistance to the decline, and the sideways support is in the range of 3280-3260; the MACD double-line golden cross is glued, and there is no death cross; the indicators in the daily K-line are contradictory, so the long and short trends are difficult to continue, and more range oscillations and high-level consolidation signals are given;
To sum up: Today's short message is still processed according to the 4-hour range; 3370-3260 range and 3370-3480 range; if it stabilizes at 3370, the range processing will be changed; you can take a pullback to do more, and bet on the 4-hour range oscillation upward, and gradually break through the position of 3370;
