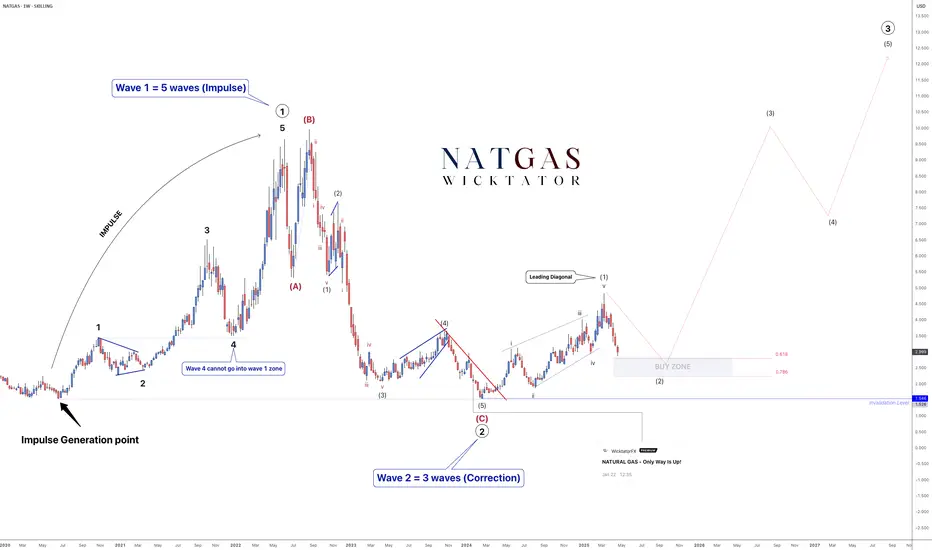
NATGAS Elliott Waves – Preparing for a Multi-Year Rally!Following our last post on Natural Gas, we have now seen a breakout, suggesting the start of a larger bullish wave — a move that could last multiple years.
From a technical perspective:
- Wave 1 (5-wave impulse) is complete.
- Wave 2 (ABC correction) is also complete.
- We are now in Wave 3, which
DON'T MISS! NATGAS Long Opportunity (1:7 RR)Monthly structure breakout & retest. Wait for the price to pullback to the key level area (taking out the low wick of the monthly inside bar) to get in. Trade safe.

Nat Gas Continued ShortFirst target at 2.880.
Headwinds in my main focus are chinas restart. Alot of rumor priced in but facts will send it lower. Sunshine ahead.

Short term bounce for big short Trading between 4&2. Momentum is down but expect a 10% increase in the following week(s). Short after the pullback.

XNGUSD Bullish Crab Pattern.Attention investors and energy enthusiasts!
The natural gas market is heating up with exciting developments.
We anticipate a significant surge in natural gas prices, projected to rise from $3.65 to $4.35 in three strategic phases based on Crab Harmonic Pattern .
This forecast reflects a robu

Natural Gas: Right Shoulder Formation Before Next Sell Order.Our previous analysis accurately predicted the gas market sell-off, allowing us to align with sellers and identify the neckline of a significant head and shoulders pattern.
Now, we're tracking a potential buying opportunity, anticipating the completion of the pattern's right shoulder.
Join us as w

Natural Gas: Consolidating and Preparing for a Move UpNatural gas is consolidating near a major support level and is beginning to slowly move higher.
I believe this is a good opportunity to enter a long position , with an initial target around the 3.50–3.60 area.
Important:
❗️Natural gas is an extremely volatile asset and often opens with large gap

Short term bounce to further short Expecting a bounce to 3200ish to continue to trend further downwards

NATGAS - Sell Trade IdeaHere we are looking to sell, short term Bias area now Bearish.
Im looking to sell into the previous market gap that hasnt been tested.
ENTRY @3.430
TP @2.396
SL @3.743
This is a free signal, good luck to anyone that follows

Natural gas buy trade Natural gas can be brought when the price takes rejection from demand zone . Sl below the zone target supply zone .

See all ideas
Displays a symbol's price movements over previous years to identify recurring trends.