WTI Oil H4 | Heading into resistanceWTI oil (USOIL) is rising towards a pullback resistance and could potentially reverse off this level to drop lower.
Sell entry is at 60.44 which is a pullback resistance that aligns close to the 50.0% Fibonacci retracement.
Stop loss is at 63.80 which is a level that sits above the 78.6% Fibonacci retracement and a swing-high resistance.
Take profit is at 56.05 which is a multi-swing-low support.
High Risk Investment Warning
Trading Forex/CFDs on margin carries a high level of risk and may not be suitable for all investors. Leverage can work against you.
Stratos Markets Limited (tradu.com):
CFDs are complex instruments and come with a high risk of losing money rapidly due to leverage. 63% of retail investor accounts lose money when trading CFDs with this provider. You should consider whether you understand how CFDs work and whether you can afford to take the high risk of losing your money.
Stratos Europe Ltd (tradu.com):
CFDs are complex instruments and come with a high risk of losing money rapidly due to leverage. 63% of retail investor accounts lose money when trading CFDs with this provider. You should consider whether you understand how CFDs work and whether you can afford to take the high risk of losing your money.
Stratos Global LLC (tradu.com):
Losses can exceed deposits.
Please be advised that the information presented on TradingView is provided to Tradu (‘Company’, ‘we’) by a third-party provider (‘TFA Global Pte Ltd’). Please be reminded that you are solely responsible for the trading decisions on your account. There is a very high degree of risk involved in trading. Any information and/or content is intended entirely for research, educational and informational purposes only and does not constitute investment or consultation advice or investment strategy. The information is not tailored to the investment needs of any specific person and therefore does not involve a consideration of any of the investment objectives, financial situation or needs of any viewer that may receive it. Kindly also note that past performance is not a reliable indicator of future results. Actual results may differ materially from those anticipated in forward-looking or past performance statements. We assume no liability as to the accuracy or completeness of any of the information and/or content provided herein and the Company cannot be held responsible for any omission, mistake nor for any loss or damage including without limitation to any loss of profit which may arise from reliance on any information supplied by TFA Global Pte Ltd.
The speaker(s) is neither an employee, agent nor representative of Tradu and is therefore acting independently. The opinions given are their own, constitute general market commentary, and do not constitute the opinion or advice of Tradu or any form of personal or investment advice. Tradu neither endorses nor guarantees offerings of third-party speakers, nor is Tradu responsible for the content, veracity or opinions of third-party speakers, presenters or participants.
OIL_CRUDE trade ideas

USOIL UPDATEHello friends
Given the recent growth in oil prices, it is natural for the price to correct. Now we have obtained the most important price support areas for you and we have also specified the target. If you are willing to enter the transaction, be sure to observe capital management.
*Trade safely with us*

Oil Drop Short Position
Greetings Traders this is my idea on Oil and it is a Long shot for a Short.
This is my explanation:
On the 4H chart of WTI crude oil, we can observe a well-defined downtrend that began near the $72.50 level. After a sharp sell-off, price entered a brief accumulation phase and has now pulled back into a previous support zone — now acting as resistance — offering a prime opportunity for trend continuation.
🔑 Key Technical Zones:
🟥 Beginning of a Downtrend: Around $72.50 – local top and start of bearish momentum.
🟧 Breakdown Zone: Around $59.00 – key support turned resistance after a strong breakdown.
🟦 Accumulation Zone: Around $62.00–64.00 – consolidation phase before continuing lower.
✅ Retracement Area (Green Box): Around $60.00–60.25 – previous support now acting as resistance; ideal zone to re-enter short.
🔵 Target Zone: $53.30 – projected next support level and target for the short position.
🎯 Active Short Position:
Entry: $60.00
Stop Loss: $61.20 (above retracement zone)
Take Profit: $53.30
Risk/Reward Ratio: ~1:4.5
After a confirmed bearish structure, price pulled back into the retracement area, which previously acted as support. This area is now likely to serve as resistance, and price rejection here aligns with a high-probability trend continuation trade.
The target for the short is set at $53.30, which corresponds with the previous swing low, while the stop loss is positioned safely above the rejection zone to avoid false breakouts.
📈 Conclusion:
This setup reflects a textbook lower high formation within a strong downtrend, offering a clean structure and favorable risk-to-reward ratio. Watching closely for bearish confirmations within the retracement zone to validate momentum continuation.
Dear Traders like,comment let me know what do you think?

USOIL:Sharing of the Trading Strategy for Next Week This week’s trading wrapped up successfully. Our exclusive VIP trading signals achieved a 90% accuracy rate!
Currently, the crude oil market is affected by factors such as the economic data of the United States and the expectations of production increases by OPEC+ and is generally showing weakness, with prices fluctuating. Pay attention to the resistance level at 60 above. If the price fails to effectively break through this resistance level, considering taking a short position with a light position can be an option.
Trading Strategy:
sell@60-59
TP:57-55
The signals in the Signature have brought about continuous profits, and accurate signals are shared every day. Hurry up and click to get them!
👇 👇 👇 Obtain signals👉👉👉

USOIL:Fluctuate upwardsThe trend of USOIL continues to rebound upwards and retests the level of $60 again. The moving average system shows a bullish arrangement, relying on the oil price, and the short-term objective trend direction is upwards. The overall rebound and upward movement follows the law of primary and secondary alternation and has good continuity. In terms of momentum, the fast and slow lines of the MACD indicator are above the zero axis, indicating that the bullish momentum is dominant, but the momentum strength is not strong. It is expected that the crude oil is more likely to continue to move in a volatile upward trend today.
USOIL
buy@59-59.5
tp:60.5-61
I am committed to sharing trading signals every day. Among them, real-time signals will be flexibly pushed according to market dynamics. All the signals sent out last week accurately matched the market trends, helping numerous traders achieve substantial profits. Regardless of your previous investment performance, I believe that with the support of my professional strategies and timely signals, I will surely be able to assist you in breaking through investment bottlenecks and achieving new breakthroughs in the trading field.

USOIL Is Going Up! Buy!
Please, check our technical outlook for USOIL.
Time Frame: 9h
Current Trend: Bullish
Sentiment: Oversold (based on 7-period RSI)
Forecast: Bullish
The price is testing a key support 57.535.
Current market trend & oversold RSI makes me think that buyers will push the price. I will anticipate a bullish movement at least to 61.620 level.
P.S
The term oversold refers to a condition where an asset has traded lower in price and has the potential for a price bounce.
Overbought refers to market scenarios where the instrument is traded considerably higher than its fair value. Overvaluation is caused by market sentiments when there is positive news.
Disclosure: I am part of Trade Nation's Influencer program and receive a monthly fee for using their TradingView charts in my analysis.
Like and subscribe and comment my ideas if you enjoy them!

USOIL SELL OPPORTUNITY Price is on a shorterm downtrend in M15. We recently had a pullback which is a good opportunity for shorting. A sell opportunity is envisaged from the current market price

Today's Layout Strategy for Crude OilOn Tuesday, due to the increase in demand from Asia and Europe, the decline in U.S. production, and the further escalation of the situation in Israel, international oil prices soared. After today's opening, oil prices have remained volatile at a high level, demonstrating strong resilience. The key dividing line between bulls and bears is at the crucial price level of $58.4. As long as this price level is not effectively broken, it will be difficult for the bullish trend of oil prices to change. Currently, oil prices are still within the bullish channel.
In terms of today's trading strategy, it is recommended to mainly place long orders on pullbacks, supplemented by a small number of short positions. Pay close attention to the resistance range of $60.8 - $61.6 above, and closely monitor the support area of $58.9 - $58.0 below.
USOIL
buy@58.80-59.30
tp:60.00-61.00
Investment itself is not risky; it is only when investment is out of control that risks occur. When trading, always remember not to act on impulse. I will share trading signals every day. All the signals have been accurate without any mistakes for a whole month. No matter what gains or losses you've had in the past, with my help, you have the hope of achieving a breakthrough in your investment.

WTI on high time frame , price reach 53$?
"Hello traders, focusing on WTI on high time frames, the price is approaching the $60.50 level, which holds significant importance. There is a high probability of price rejection at this level due to fundamental analysis.
When the price reaches the $60.50 zone, it is advisable to observe candle formations, momentum, and other indicators. This could present a favorable opportunity for a short position targeting the $53 level."
If you have any further questions or need additional assistance, feel free to let me know!

What do silver and oil have in common? Price.Since 1861, silver and crude oil charts have trended together rather well.
So, if you think there is a "cartel" which manipulates the silver, there must also be manipulating crude oil.
Or, the more logical explanation is that capital flows are carving out these price charts.

WTIThis is WTI, and if we look at previous analyses, I predicted that when the price reached the first zone, it would rise to the major upper zone. The price then dropped and broke through Zone 1.
This time, although the price has breached the first zone, it doesn’t mean it won’t reach the upper zone. So, I now predict the price will make a very strong upward move and break through the first zone again and hit the take profit (TP).

A Preliminary Double Bottom Support Pattern May Be FormingCurrently, factors such as geopolitics, OPEC+ policies, and the trend of the US dollar all have a two-sided impact on USOIL. Only the technical aspect reveals directional signals.
This week, the crude oil price rebounded rapidly after hitting a low of $56. It has formed the embryonic form of a double bottom with the previous low point, and this pattern may become a turning point in the market trend. According to the theory we proposed earlier, "A deep correction breeds a strong rebound," the price of $56 has become a key support level. If the oil price stabilizes at this level next week, the double bottom pattern is expected to be confirmed, which will in turn trigger a technical rebound. Conversely, once this key level is effectively broken, it is likely to trigger a concentrated sell-off of stop-loss orders, intensifying the downward pressure on the price.
I am committed to sharing trading signals every day. Among them, real-time signals will be flexibly pushed according to market dynamics. All the signals sent out last week accurately matched the market trends, helping numerous traders achieve substantial profits. Regardless of your previous investment performance, I believe that with the support of my professional strategies and timely signals, I will surely be able to assist you in breaking through investment bottlenecks and achieving new breakthroughs in the trading field.

A CLEAR SELL SET UP ON USOILUSOIL is currently on down trend , it break a structure and retested it the first time , it is about to retest it the second time for a potential sell(distribution)

"US Oil Spot/WTI" Energy Market Bullish Heist (Swing Trade Plan)🌟Hi! Hola! Ola! Bonjour! Hallo! Marhaba!🌟
Dear Money Makers & Robbers, 🤑 💰💸✈️
Based on 🔥Thief Trading style technical and fundamental analysis🔥, here is our master plan to heist the "US Oil Spot/WTI" Energy Market. Please adhere to the strategy I've outlined in the chart, which emphasizes long entry. Our aim is to escape near the high-risk Red Zone Level. Risky level, overbought market, consolidation, trend reversal, trap at the level where traders and bearish robbers are stronger. 🏆💸"Take profit and treat yourself, traders. You deserve it!💪🏆🎉
Entry 📈 : "The heist is on! Wait for the MA breakout (59.700) then make your move - Bullish profits await!"
however I advise to Place Buy stop orders above the Moving average (or) Place buy limit orders within a 15 or 30 minute timeframe most recent or swing, low or high level for Pullback entries.
📌I strongly advise you to set an "alert (Alarm)" on your chart so you can see when the breakout entry occurs.
Stop Loss 🛑: "🔊 Yo, listen up! 🗣️ If you're lookin' to get in on a buy stop order, don't even think about settin' that stop loss till after the breakout 🚀. You feel me? Now, if you're smart, you'll place that stop loss where I told you to 📍, but if you're a rebel, you can put it wherever you like 🤪 - just don't say I didn't warn you ⚠️. You're playin' with fire 🔥, and it's your risk, not mine 👊."
📍 Thief SL placed at the recent/swing low level Using the 3H timeframe (57.400) Swing trade basis.
📍 SL is based on your risk of the trade, lot size and how many multiple orders you have to take.
🏴☠️Target 🎯: 63.000 (or) Escape Before the Target.
🧲Scalpers, take note 👀 : only scalp on the Long side. If you have a lot of money, you can go straight away; if not, you can join swing traders and carry out the robbery plan. Use trailing SL to safeguard your money 💰.
💰💵💴💸"US Oil Spot / WTI" Energy Market Heist Plan (Swing Trade) is currently experiencing a bullishness🐂.., driven by several key factors.☝☝☝
⚠️Trading Alert : News Releases and Position Management 📰 🗞️ 🚫🚏
As a reminder, news releases can have a significant impact on market prices and volatility. To minimize potential losses and protect your running positions,
we recommend the following:
Avoid taking new trades during news releases
Use trailing stop-loss orders to protect your running positions and lock in profits
💖Supporting our robbery plan 💥Hit the Boost Button💥 will enable us to effortlessly make and steal money 💰💵. Boost the strength of our robbery team. Every day in this market make money with ease by using the Thief Trading Style.🏆💪🤝❤️🎉🚀
I'll see you soon with another heist plan, so stay tuned 🤑🐱👤🤗🤩

WTI Oil H4 | Rising into a swing-high resistanceWTI oil (USOIL) is rising towards a swing-high resistance and could potentially reverse off this level to drop lower.
Sell entry is at 59.71 which is a swing-high resistance that aligns close to the 50.0% Fibonacci retracement.
Stop loss is at 62.30 which is a level that sits above an overlap resistance.
Take profit is at 55.10 which is a swing-low support.
High Risk Investment Warning
Trading Forex/CFDs on margin carries a high level of risk and may not be suitable for all investors. Leverage can work against you.
Stratos Markets Limited (tradu.com):
CFDs are complex instruments and come with a high risk of losing money rapidly due to leverage. 63% of retail investor accounts lose money when trading CFDs with this provider. You should consider whether you understand how CFDs work and whether you can afford to take the high risk of losing your money.
Stratos Europe Ltd (tradu.com):
CFDs are complex instruments and come with a high risk of losing money rapidly due to leverage. 63% of retail investor accounts lose money when trading CFDs with this provider. You should consider whether you understand how CFDs work and whether you can afford to take the high risk of losing your money.
Stratos Global LLC (tradu.com):
Losses can exceed deposits.
Please be advised that the information presented on TradingView is provided to Tradu (‘Company’, ‘we’) by a third-party provider (‘TFA Global Pte Ltd’). Please be reminded that you are solely responsible for the trading decisions on your account. There is a very high degree of risk involved in trading. Any information and/or content is intended entirely for research, educational and informational purposes only and does not constitute investment or consultation advice or investment strategy. The information is not tailored to the investment needs of any specific person and therefore does not involve a consideration of any of the investment objectives, financial situation or needs of any viewer that may receive it. Kindly also note that past performance is not a reliable indicator of future results. Actual results may differ materially from those anticipated in forward-looking or past performance statements. We assume no liability as to the accuracy or completeness of any of the information and/or content provided herein and the Company cannot be held responsible for any omission, mistake nor for any loss or damage including without limitation to any loss of profit which may arise from reliance on any information supplied by TFA Global Pte Ltd.
The speaker(s) is neither an employee, agent nor representative of Tradu and is therefore acting independently. The opinions given are their own, constitute general market commentary, and do not constitute the opinion or advice of Tradu or any form of personal or investment advice. Tradu neither endorses nor guarantees offerings of third-party speakers, nor is Tradu responsible for the content, veracity or opinions of third-party speakers, presenters or participants.

WTI Oil H4 | Pullback resistance at 50% Fibonacci retracementWTI oil (USOIL) is rising towards a pullback resistance and could potentially reverse off this level to drop lower.
Sell entry is at 60.49 which is a pullback resistance that aligns with the 50.0% Fibonacci retracement.
Stop loss is at 62.30 which is a level that sits above the 61.8% Fibonacci retracement and an overlap resistance.
Take profit is at 56.68 which is a multi-swing-low support.
High Risk Investment Warning
Trading Forex/CFDs on margin carries a high level of risk and may not be suitable for all investors. Leverage can work against you.
Stratos Markets Limited (tradu.com):
CFDs are complex instruments and come with a high risk of losing money rapidly due to leverage. 63% of retail investor accounts lose money when trading CFDs with this provider. You should consider whether you understand how CFDs work and whether you can afford to take the high risk of losing your money.
Stratos Europe Ltd (tradu.com):
CFDs are complex instruments and come with a high risk of losing money rapidly due to leverage. 63% of retail investor accounts lose money when trading CFDs with this provider. You should consider whether you understand how CFDs work and whether you can afford to take the high risk of losing your money.
Stratos Global LLC (tradu.com):
Losses can exceed deposits.
Please be advised that the information presented on TradingView is provided to Tradu (‘Company’, ‘we’) by a third-party provider (‘TFA Global Pte Ltd’). Please be reminded that you are solely responsible for the trading decisions on your account. There is a very high degree of risk involved in trading. Any information and/or content is intended entirely for research, educational and informational purposes only and does not constitute investment or consultation advice or investment strategy. The information is not tailored to the investment needs of any specific person and therefore does not involve a consideration of any of the investment objectives, financial situation or needs of any viewer that may receive it. Kindly also note that past performance is not a reliable indicator of future results. Actual results may differ materially from those anticipated in forward-looking or past performance statements. We assume no liability as to the accuracy or completeness of any of the information and/or content provided herein and the Company cannot be held responsible for any omission, mistake nor for any loss or damage including without limitation to any loss of profit which may arise from reliance on any information supplied by TFA Global Pte Ltd.
The speaker(s) is neither an employee, agent nor representative of Tradu and is therefore acting independently. The opinions given are their own, constitute general market commentary, and do not constitute the opinion or advice of Tradu or any form of personal or investment advice. Tradu neither endorses nor guarantees offerings of third-party speakers, nor is Tradu responsible for the content, veracity or opinions of third-party speakers, presenters or participants.

Can it hit the bottom and rebound?Fundamental Analysis: Driven by the trade concerns sparked by Trump and the risk aversion sentiment arising from the global economic slowdown, the trajectory of oil prices has been shaped. Additionally, OPEC+ convened an early meeting on Saturday and confirmed an increase in production of 411,000 barrels per day in June. This decision has indubitably intensified the market's apprehensions regarding the oversupply of crude oil 📉.
Technical Analysis: Technically speaking, the price of crude oil has persistently lingered below the midline of the Bollinger Bands, distinctly indicating that the bearish trend is in the ascendancy 📉. Last week, on the weekly chart, it closed with a substantial bearish candlestick, exhibiting a downward tail pattern, and in the short term, the price has been fluctuating within a trading range 📊. As for the upcoming week's trend, whether the support level established by the previous double doji bottoming formation will be broken through effectively will be the focal point of market attention 👀. Nevertheless, once the price reaches the crucial support level, there exists the potential for a technical rebound. Investors should closely monitor the variations in trading volume and the response of the moving average system 📈.
Market Situation: It is crucial to note that due to the holiday factor in the Asian market next Monday, market liquidity is anticipated to decline significantly. Under such circumstances, the oil price is likely to encounter a higher risk of more pronounced volatility, further escalating the uncertainty of the market situation ⚠️.
⚡⚡⚡ USOIL ⚡⚡⚡
🚀 Buy@56.0 - 57.0
🚀 TP 59.0 - 60.0
Accurate signals are updated every day 📈 If you encounter any problems during trading, these signals can serve as your reliable guide 🧭 Feel free to refer to them! I sincerely hope they'll be of great help to you 🌟

USOIL:Sharing of the Latest Trading StrategyAll the trading signals today have resulted in profits!!! Check it!!!👉👉👉
The increase in crude oil production has, in the context of an uncertain demand outlook, sparked concerns about a rise in global supply. After breaking below the 60 mark last week, crude oil continued its downward trend and reached as low as around 55.3. Currently, there is a slight rebound. One can simply find an appropriate position to go short again. Go short on crude oil when it rebounds to around 59.8, and target the price levels of 58 to 57.
Trading Strategy:
sell@59.8-58.5
TP:58-57
The signals in the Signature have brought about continuous profits, and accurate signals are shared every day. Hurry up and click to get them!
👇 👇 👇 Obtain signals👉👉👉

USOIL H4 I Bearish reversal Based on the H4 chart, the price is approaching our sell entry level at 60.44, a pullback resistance that aligns with the 61.8% Fibo retracement.
Our take profit is set at 57.63, a pullback support.
The stop loss is set at 62.67, a pullback resistance.
High Risk Investment Warning
Trading Forex/CFDs on margin carries a high level of risk and may not be suitable for all investors. Leverage can work against you.
Stratos Markets Limited (tradu.com):
CFDs are complex instruments and come with a high risk of losing money rapidly due to leverage. 63% of retail investor accounts lose money when trading CFDs with this provider. You should consider whether you understand how CFDs work and whether you can afford to take the high risk of losing your money.
Stratos Europe Ltd (tradu.com):
CFDs are complex instruments and come with a high risk of losing money rapidly due to leverage. 63% of retail investor accounts lose money when trading CFDs with this provider. You should consider whether you understand how CFDs work and whether you can afford to take the high risk of losing your money.
Stratos Global LLC (tradu.com):
Losses can exceed deposits.
Please be advised that the information presented on TradingView is provided to Tradu (‘Company’, ‘we’) by a third-party provider (‘TFA Global Pte Ltd’). Please be reminded that you are solely responsible for the trading decisions on your account. There is a very high degree of risk involved in trading. Any information and/or content is intended entirely for research, educational and informational purposes only and does not constitute investment or consultation advice or investment strategy. The information is not tailored to the investment needs of any specific person and therefore does not involve a consideration of any of the investment objectives, financial situation or needs of any viewer that may receive it. Kindly also note that past performance is not a reliable indicator of future results. Actual results may differ materially from those anticipated in forward-looking or past performance statements. We assume no liability as to the accuracy or completeness of any of the information and/or content provided herein and the Company cannot be held responsible for any omission, mistake nor for any loss or damage including without limitation to any loss of profit which may arise from reliance on any information supplied by TFA Global Pte Ltd.
The speaker(s) is neither an employee, agent nor representative of Tradu and is therefore acting independently. The opinions given are their own, constitute general market commentary, and do not constitute the opinion or advice of Tradu or any form of personal or investment advice. Tradu neither endorses nor guarantees offerings of third-party speakers, nor is Tradu responsible for the content, veracity or opinions of third-party speakers, presenters or participants.

WTI Oil H4 | Swing-high resistance at 50% Fibonacci retracementWTI oil (USOIL) is rising towards a swing-high resistance and could potentially reverse off this level to drop lower.
Sell entry is at 59.68 which is a swing-high resistance that aligns close to the 50.0% Fibonacci retracement.
Stop loss is at 62.30 which is a level that sits above an overlap resistance.
Take profit is at 56.05 which is a multi-swing-low support.
High Risk Investment Warning
Trading Forex/CFDs on margin carries a high level of risk and may not be suitable for all investors. Leverage can work against you.
Stratos Markets Limited (tradu.com):
CFDs are complex instruments and come with a high risk of losing money rapidly due to leverage. 63% of retail investor accounts lose money when trading CFDs with this provider. You should consider whether you understand how CFDs work and whether you can afford to take the high risk of losing your money.
Stratos Europe Ltd (tradu.com):
CFDs are complex instruments and come with a high risk of losing money rapidly due to leverage. 63% of retail investor accounts lose money when trading CFDs with this provider. You should consider whether you understand how CFDs work and whether you can afford to take the high risk of losing your money.
Stratos Global LLC (tradu.com):
Losses can exceed deposits.
Please be advised that the information presented on TradingView is provided to Tradu (‘Company’, ‘we’) by a third-party provider (‘TFA Global Pte Ltd’). Please be reminded that you are solely responsible for the trading decisions on your account. There is a very high degree of risk involved in trading. Any information and/or content is intended entirely for research, educational and informational purposes only and does not constitute investment or consultation advice or investment strategy. The information is not tailored to the investment needs of any specific person and therefore does not involve a consideration of any of the investment objectives, financial situation or needs of any viewer that may receive it. Kindly also note that past performance is not a reliable indicator of future results. Actual results may differ materially from those anticipated in forward-looking or past performance statements. We assume no liability as to the accuracy or completeness of any of the information and/or content provided herein and the Company cannot be held responsible for any omission, mistake nor for any loss or damage including without limitation to any loss of profit which may arise from reliance on any information supplied by TFA Global Pte Ltd.
The speaker(s) is neither an employee, agent nor representative of Tradu and is therefore acting independently. The opinions given are their own, constitute general market commentary, and do not constitute the opinion or advice of Tradu or any form of personal or investment advice. Tradu neither endorses nor guarantees offerings of third-party speakers, nor is Tradu responsible for the content, veracity or opinions of third-party speakers, presenters or participants.

USOIL: Oscillating and Declining within the RangeFor USOIL, its short-term trend has rebounded after hitting the bottom again. The oil price has repeatedly crossed the moving average system, and its objective short-term trend is in a sideways oscillation. Overall, it has formed a wide fluctuating range in its rhythm. In the early trading session, the oil price oscillated above the range, showing signs of insufficient upward momentum. It is expected that the intraday trend of crude oil will mainly fluctuate within the range.
USOIL
sell:60.5-61.5
tp:59.5-58.5
I am committed to sharing trading signals every day. Among them, real-time signals will be flexibly pushed according to market dynamics. All the signals sent out last week accurately matched the market trends, helping numerous traders achieve substantial profits. Regardless of your previous investment performance, I believe that with the support of my professional strategies and timely signals, I will surely be able to assist you in breaking through investment bottlenecks and achieving new breakthroughs in the trading field.

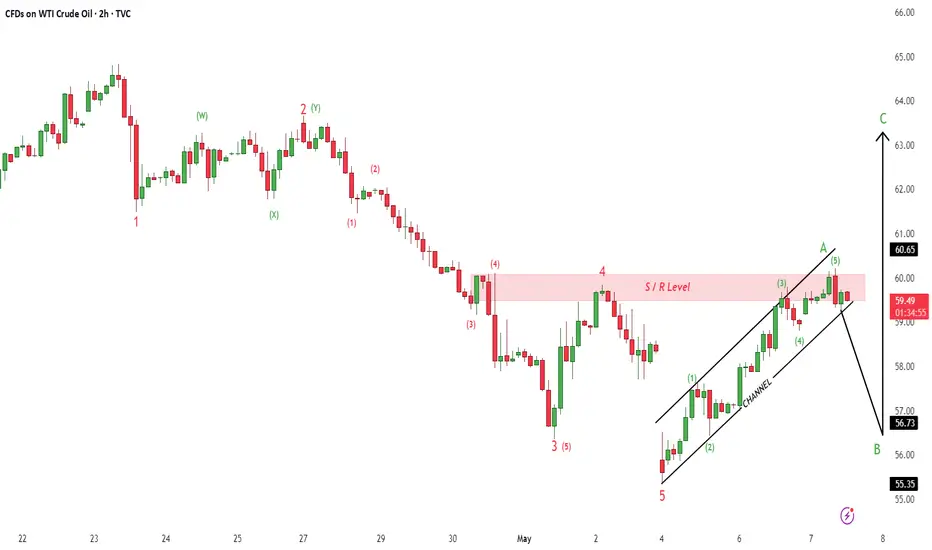
Crude OilU.S Oil Index
- Completed " 12345 " Impulsive Waves and " A " Corrective Wave
- Break of Structure
- Order Block
- Bullish Channel as an corrective pattern in Short Time Frame
- S / R Level
USOILOPEC+ decisions have a significant and multifaceted impact on oil prices in the near future:
Short-Term Impact
Supply Increases Lead to Price Drops:
Recently, OPEC+ agreed to increase oil production by about 411,000 barrels per day in May 2025, with plans to accelerate output hikes further in June and beyond, potentially adding up to 2.2 million barrels per day by November. This surge in supply amid weakening global demand, especially due to escalating U.S.-China trade tensions, has already caused oil prices to plunge to multi-year lows
Market Surplus Pressure:
The increased production is expected to exacerbate an existing surplus, putting downward pressure on prices in the near term unless demand recovers.
Medium to Long-Term Impact
Market Stability Through Gradual Adjustments:
OPEC+’s cautious, phased approach to increasing production aims to reduce volatility and stabilize the market over time. By managing supply carefully, OPEC+ attempts to balance between preventing sharp price drops and avoiding excessive shortages.
Dependence on Global Demand Trajectory:
The effectiveness of OPEC+’s strategy heavily depends on global demand, which faces headwinds from the energy transition toward renewables and climate policies like the Paris Accord. If demand declines faster than expected, OPEC+ may need to adjust production cuts or increases accordingly.
Geopolitical and Strategic Considerations:
OPEC+ decisions also have geopolitical implications, influencing relations between member states and global powers. For example, Saudi Arabia’s recent moves to discipline overproducing members like Iraq and Kazakhstan reflect internal dynamics that affect production policies. Additionally, OPEC+ output decisions are intertwined with U.S.-Saudi relations and broader energy security considerations.
Market Reaction Dynamics
Volatility Around Announcements:
OPEC+ meetings typically trigger immediate price volatility, with oil prices moving 3-7% depending on the size of production adjustments and market expectations.
Trading Algorithms and Futures Positioning:
Automated trading and futures market positioning amplify price swings around OPEC+ announcements.
Hedging and Seasonal Effects:
Consumer industries adjust hedging strategies based on OPEC+ signals, and seasonal demand (e.g., summer driving season) also influences price sensitivity
In essence:
OPEC+’s near-future decisions to accelerate oil output hikes are currently driving prices lower by increasing supply amid fragile demand. However, their gradual and flexible approach aims to stabilize the market over time. The ultimate impact on prices will depend on how global demand evolves, geopolitical dynamics within OPEC+, and the broader energy transition.
