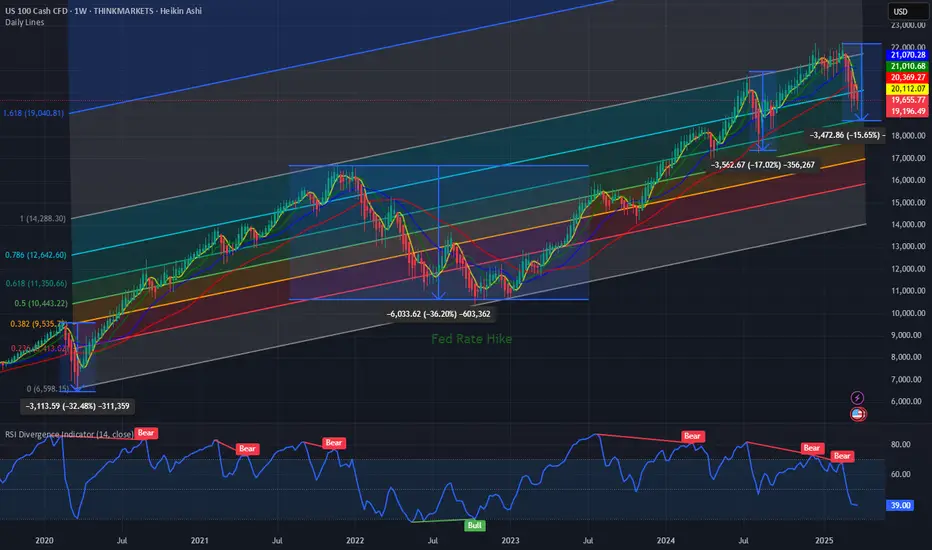
Not looking good for TradFi.First (38.2%) and second (61.8%) support level as shown.
Ichimoku cloud also turning bearish again.
Will the crypto market be pulled along, or will it finally decouple (less likely)?
US100 trade ideas

NASDAQ INDEX (US100): Bullish Reversal Confirmed?!
I see 2 very strong bullish reversal confirmation on US100 on a daily.
First the market violated a resistance line of a falling channel.
Then, a neckline of a cup & handle pattern was broken.
Both breakouts indicate the strength of the buyers.
We can expect a growth at least to 20300 resistance.
❤️Please, support my work with like, thank you!❤️

NAS100USD Buy Idea: Bullish Momentum Targets 20705🚀 OANDA:NAS100USD Buy Idea: Bullish Momentum Targets 20705 💹 - 24h expiry
OANDA:NAS100USD - We look to Buy at 20025
Stop Loss: 19825
Target 1: 20705
Target 2: 20730
Resistance: 20234, 20705, 20730
Support: 20025, 19423, 19125
Technical Setup:
📈 Continued upward momentum from 19424 resulted in the pair posting net daily gains yesterday .
⚠️ Overbought extremes indicate scope for mild selling at the open, but losses should remain limited .
🔑 Medium-term bias remains bullish .
🏁 Key resistance level at 20705 .
📰 News Sentiment
📊 Recent sessions show a bullish uptick in News Sentiment (Red Line), aligning with the price movement (Blue Line).
🌟 Positive sentiment (Red Line) is extending higher, suggesting further upside potential in the short term.
Risk Disclaimer
The trade ideas beyond this page are for informational purposes only and do not constitute investment advice or a solicitation to trade. This information is provided by Signal Centre, a third-party unaffiliated with OANDA, and is intended for general circulation only. OANDA does not guarantee the accuracy of this information and assumes no responsibilities for the information provided by the third party. The information does not take into account the specific investment objectives, financial situation, or particular needs of any particular person. You should take into account your specific investment objectives, financial situation, and particular needs before making a commitment to trade, including seeking advice from an independent financial adviser regarding the suitability of the investment, under a separate engagement, as you deem fit.
You accept that you assume all risks in independently viewing the contents and selecting a chosen strategy.
Where the research is distributed in Singapore to a person who is not an Accredited Investor, Expert Investor or an Institutional Investor, Oanda Asia Pacific Pte Ltd (“OAP“) accepts legal responsibility for the contents of the report to such persons only to the extent required by law. Singapore customers should contact OAP at 6579 8289 for matters arising from, or in connection with, the information/research distributed.

POWER OF MAJOR INDICES...TAKE EMOTIONS OUTHello hello TradingView community! JosePips here just wanted to create a video for you guys on the power of the major indices and how we can use them as a compass and gauge for our trading overall and use it as a compass to tell us the direction of the market and be able to help us digest which opportunities are in the markets for us!
They are a very powerful tool to use as confluence whether you are trading stocks, currencies, futures etc. so be able to use to gauge where the market is at and help us decide which market opportunities are best for us to take and where the probability is highest for us to trade. Which as traders...probability is the name of the game!
Hope you guys get some nuggets from this and as always have a blessed rest of your week!
Cheers!

NASDAQ 100 INDEX BREAKDOWN FROM A 100% TECHNICAL VIEWPOINTHello everybody JosePips here hope you are all having an amazing week so far! I wanted to come on here and make a post for the Nasdaq 100 index from a 100% technical analysis perspective. There has been SO MUCH talk around the stock market and the indices lately (frankly mostly emotional) & I wanted to come on here and share my outlook and the technical outlook for you guys so you can actually gain some insight not from an emotional perspective but from a technical/subjective viewpoint.
Hope you guys enjoy this video and find some value in it and can use it in your trading & investing. Please boost this post and comment if you enjoy and see you in the next one!
Cheers!

NAS100NAS100, also known as the Nasdaq-100 Index, is a stock market index that includes 100 of the largest non-financial companies listed on the Nasdaq Stock Market. It is heavily weighted toward technology stocks, making it a popular choice for traders and investors who focus on the tech sector.
Key Features of NAS100:
• Composition: Includes major companies like Apple, Microsoft, Amazon, Nvidia, and Tesla.
• Volatility: Tends to be more volatile than other indices, offering high-risk, high-reward opportunities.
• Tech Dominance: Heavily influenced by the technology sector, making it sensitive to innovation trends and economic conditions.
• Trading Hours: The Nasdaq market operates from 9:30 AM to 4:00 PM (ET), but NAS100 futures trade nearly 24/7.
Why Traders Like NAS100?
• Strong Growth Potential: Tech companies often outperform the broader market.
• Liquidity: High trading volume ensures tight spreads and smooth execution.
• Good for Day Trading & Swing Trading: Due to frequent price movements.

NASDAQ The recovery has officially started.Nasdaq (NDX) has been trading within a 2-year Channel Up and with today's opening, it broke above the Lower Highs trend-line of February's Bearish Leg. Even though the confirmed bullish reversal signal technically comes above the 1D MA50 (blue trend-line), we already have the early bottom signals.
First and foremost, the 1D RSI rebounding from the same oversold (<30.00) level where all major Higher Lows of the Channel Up did (August 05 2024, April 19 2024, October 26 2023). Every time the price reached its -0.5 Fibonacci extensions following such bottoms. Also each Bullish Leg tends so far to be smaller than the previous.
As a result, targeting a +24% rise (-3% less than the previous Bullish Leg) at 23500 is a very realistic Target technically, as it is considerably below the -0.5 Fibonacci extension.
-------------------------------------------------------------------------------
** Please LIKE 👍, FOLLOW ✅, SHARE 🙌 and COMMENT ✍ if you enjoy this idea! Also share your ideas and charts in the comments section below! This is best way to keep it relevant, support us, keep the content here free and allow the idea to reach as many people as possible. **
-------------------------------------------------------------------------------
💸💸💸💸💸💸
👇 👇 👇 👇 👇 👇

20323.3-20647.3 The key is whether it can rise above this level
Hello, traders.
If you "Follow", you can always get new information quickly.
Please also click "Boost".
Have a nice day today.
-------------------------------------
The April TradingView competition is sponsored by PEPPERSTONE.
Accordingly, we will look at the coins (tokens) and items that can be traded in the competition.
Let's talk about the NAS100 chart.
--------------------------------------
(NAS100 1M chart)
I think the stock market is fluctuating due to the rapidly changing situation and various economic issues.
Therefore, I think it is not easy to analyze index charts such as NAS100 and US30.
However, since the HA-High indicator of the current 1M chart is newly generated and is showing a downward trend, if it does not rise above 20647.3 when the competition starts, it is likely to eventually fall.
If it falls below the M-Signal indicator of the 1M chart, it is necessary to check for support near the Fibonacci ratio range of 0.5 (15898.2) ~ 0.618 (17130.8).
-
(1D chart)
The key is whether it can receive support near 19598.6, the HA-Low indicator point of the 1D chart, and rise above the M-Signal indicator of the 1W chart.
If not, it is expected that it will eventually meet the M-Signal indicator of the 1M chart and determine the trend again.
Currently, the price is being maintained above the M-Signal indicator of the 1M chart, so it is maintaining an upward trend in the medium to long term.
Therefore, when the competition starts, you should respond depending on whether the price is being maintained above or below the M-Signal indicator of the 1D chart.
Currently, the short-term support zone is 19269.9-19598.6, and the medium to long-term resistance zone is 20323.3-20647.3.
Even if it is supported and rises in the short-term support zone, if it fails to break through the medium to long-term resistance zone, it will eventually fall.
-
Thank you for reading to the end.
I hope you have a successful transaction.
--------------------------------------------------

Good times still to roll on after correction.Bear flag forming at the edge of the channel. The flag pole came down with good volume and flag itself (consolidation) on decrease volume therefore good probability of more downside. If that happens that could create a Wycoff spring and resume the current trend.

US100+ Fresh US data (PCE and infl.exp. Up, Consumer exp. Down)
~+ Tariffs uncertainty (retaliation?)
~+ COT
~+ Timing (end of the week, month)
~- Seasonals

Realtime markups: Indices tailspin to the weekly range lowsAfter rejecting the weekly highs aggressively on Wednesday, we had a clear run toward the low of the same weekly range candle's low. I believe this low will be hit before anything else.
We will see what the Monday open sequence looks like. See you then 🫡

NAS100 Technical Analysis🔹 Trend Overview:
Nas100 initially showed signs of recovery with some bullish momentum. However, in the last three days of the week, the market sentiment shifted, breaking key support zones at 19,880.00, 19,400.00, and 19,151.00. This drop was driven by growing uncertainty surrounding U.S. trade policy and a more pessimistic inflation outlook.
🔹 Key Levels:
📈 Resistance: 19,400.00
📉 Support: 19,151.00 – If broken, price may drop further.
🔹 Market Structure:
🚀 Bullish scenario: Rejection of 19,151.00 & break of 19,400.00 → Retest → Target higher levels.
⚠️ Bearish scenario: Break of 19,151.00 → Drop to 18,796.10 → Further decline if broken.
📌 Risk Management: Wait for confirmation of breakout or rejection before entering trades.

Tarrif shock about to hitI believe markets will go down ~10% coming days into 2nd of April. The market will not stay complacent and take profit just in case to see what will happen. Some believe Trump will cancel or postpone the tarrifs again, but he can't do that each time or people will not believe him anymore. Perhaps the big move down will be because the EU will announce their counter tarrifs against the USA.

Hanzo | Nas100 15 min Breaks – Confirm the Next Move🆚 Nas100 – The Way of the Silent Blade
⭐️ We do not predict—we calculate.
We do not react—we execute.
Patience is our shield. Precision is our sword.
🩸 market is a battlefield where hesitation means death. The untrained fall into traps, chasing shadows, believing in illusions. But we are not the crowd. We follow no signal but the one left behind by Smart Money. Their footprints are our way forward.
🩸 Bullish Structure Shatters -
Key Break Confirms the Path – 19980
reasons
Liquidity Swwep
liquidity / choch
key level / multi retest before
weekly / monthly zone
🩸 Bearish Structure Shatters
Key Break Confirms the Path – 19840 Zone
our reversal always at key level
even a reversal area is well studded
reasons
Liquidity Swwep
liquidity / choch
key level / multi retest before
weekly / monthly zone
🔻 This is the threshold where the tides shift. If price pierces this level with authority, it is no accident—it is designed. The liquidity pool above has been set, and the institutions will claim their prize. Volume must confirm the strike. A clean break, a strong push, and the path is set.
Watch the volume. Watch the momentum. Strike without doubt

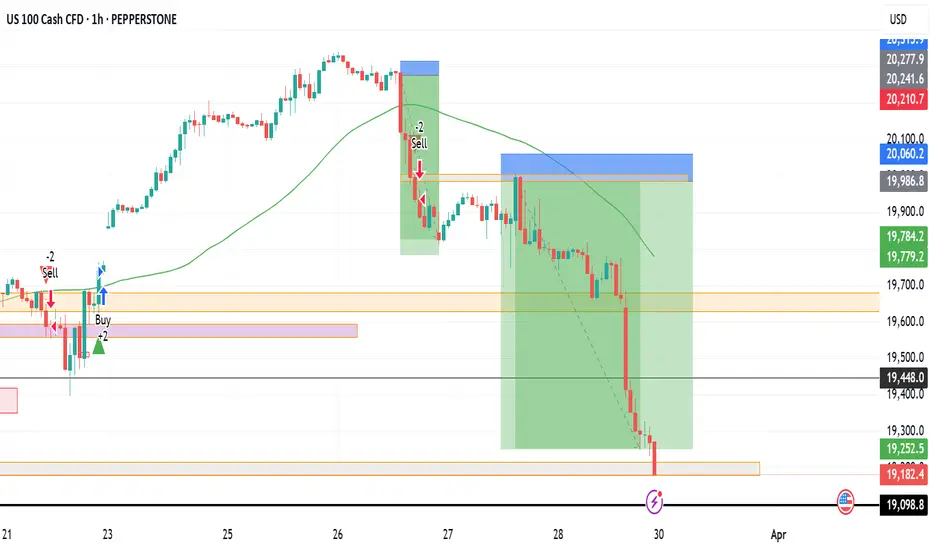
US100 Downtrend Analysis & Key LevelsAfter analysing the US100 chart, the index has been trading within a downtrend channel since Friday, February 21, 2025. After dropping to 19,131, it attempted a recovery but faced strong resistance at 19,957, leading to a decline. As the saying goes, “ Follow the trend—the trend is your friend. ” Given the ongoing downtrend, US100 may continue to decline toward the next strong support level at 18,489.
Ensure you adhere to proper risk management for long-term success.
Happy Trading

NAS100/US100/NQ/NASDAQ Long-Bet Me, Others Sell=I BuyNAS100, US100, NQ, NASDAQ Long for 2 Weeks, it could drop a little forsure because I didn't get bullish confirmation but with my back testing of this strategy, it hits multiple possible take profits atleast TP-1, manage your position accordingly.
Use proper risk management
Looks like good trade.
Lets monitor.
Use proper risk management.
Disclaimer: only idea, not advice

nas updateThis Analysis Can Change At Anytime Without Notice And It Is Only For educational Purpose to Traders To Make Independent Investments Decisions.
Disclaimer
The information and publications are not meant to be, and do not constitute, financial, investment, trading, or other types of advice or recommendations supplied or endorsed by TradingView
$NAS100 in correction mode. Is a bounce coming?Market experts will say 10% is a correction 20% is a bear market. In the last 5 years NASDAQ100 has been in the bear market 2 times. Once during COVID19 and another time during the FED Rate hike cycle. And it has been in correction mode in Aug 2024 when the Yen carry trade unwound.
Since Aug 2024 PEPPERSTONE:NAS100 has shown great strength with higher highs and higher lows and perfectly within the upward slopping Fib Retracement channel as shown in the chart below respecting the major fib levels and bouncing off from the 0.618 Fib retracement level every time it had a drawdown. The current correction in PEPPERSTONE:NAS100 is very close to the 0.618 Fib retracement level which is currently at 18700. This will indicate another potential downside of 2-3 % and if the Fib levels are supposed to holds then we will see a bottom @ 18700 and a bounce back from those levels. This will also bring down the RSI to low 30s which will indicate an oversold position.
Verdict: Start DCA into $ NAS100 and go long 18700.
"NAS100/US100" Indices Market Heist Plan (Scalping / Day Trade)🌟Hi! Hola! Ola! Bonjour! Hallo! Marhaba!🌟
Dear Money Makers & Robbers, 🤑 💰💸✈️
Based on 🔥Thief Trading style technical and fundamental analysis🔥, here is our master plan to heist the "NAS100/US100" Indices Market. Please adhere to the strategy I've outlined in the chart, which emphasizes long entry. Our aim is the high-risk Red Zone. Risky level, overbought market, consolidation, trend reversal, trap at the level where traders and bearish robbers are stronger. 🏆💸"Take profit and treat yourself, traders. You deserve it!💪🏆🎉
Entry 📈 : "The vault is wide open! Swipe the Bullish loot at any price - the heist is on!
however I advise to Place buy limit orders within a 15 or 30 minute timeframe most recent or swing, low or high level. I Highly recommended you to put alert in your chart.
Stop Loss 🛑:
Thief SL placed at the recent/swing low level Using the 30m timeframe (19700) swing trade basis.
SL is based on your risk of the trade, lot size and how many multiple orders you have to take.
🏴☠️Target 🎯: 20350 (or) Escape Before the Target
🧲Scalpers, take note 👀 : only scalp on the Long side. If you have a lot of money, you can go straight away; if not, you can join swing traders and carry out the robbery plan. Use trailing SL to safeguard your money 💰.
"NAS100/US100" Indices Market Heist Plan (Scalping / Day Trade) is currently experiencing a bullishness,., driven by several key factors.
📰🗞️Get & Read the Fundamental, Macro, COT Report, Geopolitical and News Analysis, Sentimental Outlook, Intermarket Analysis, Index-Specific Analysis, Positioning and future trend targets.. go ahead to check 👉👉👉
📌Keep in mind that these factors can change rapidly, and it's essential to stay up-to-date with market developments and adjust your analysis accordingly.
⚠️Trading Alert : News Releases and Position Management 📰 🗞️ 🚫🚏
As a reminder, news releases can have a significant impact on market prices and volatility. To minimize potential losses and protect your running positions,
we recommend the following:
Avoid taking new trades during news releases
Use trailing stop-loss orders to protect your running positions and lock in profits
💖Supporting our robbery plan 💥Hit the Boost Button💥 will enable us to effortlessly make and steal money 💰💵. Boost the strength of our robbery team. Every day in this market make money with ease by using the Thief Trading Style.🏆💪🤝❤️🎉🚀
I'll see you soon with another heist plan, so stay tuned 🤑🐱👤🤗🤩

NASDAQ 100 IndexThe price has already dropped to the support line of the inner channel (in light blue), which is at one standard deviation.
If this support line is also broken, the next support level is the outer channel (in yellow), which is at two standard deviations.
(Logarithmic price axis, channel starting from 2008)

Nasdaq - Long Strategy I want to be onest.. this is not an easy trade.
This trade can have a final loss but in any case we have many poit to our side with a high propability for e long correction.
We arrive on 0.61 of Long Wave
RSI is in oversold
Attention to put correctly at BE the trade

Price is at a Buy Zone - Bulls to push prices higher...Price is currently at support levels of a consolidation channel
Waiting for price to breakout and retest my trendline
before riding along with the bulls...

Nasdaq100 Update: Another Leg Down Likely After Recent Reversal?For quite some time, I have been highlighting the possibility of a strong correction in the Nasdaq 100 ( TRADENATION:USTEC ), with the 17,500 level remaining a realistic downside target.
In my more recent analyses, I argued that while a reversal from the 19,100 support zone was likely, it was merely a dead cat bounce , and the index could decline further from the 20,300-20,500 resistance zone. The lower boundary of this range was tested, and as expected, the index has started to fall again.
Although a temporary rally above 20,000 cannot be ruled out, my overall outlook remains unchanged—I still anticipate another leg down.
In conclusion, selling into rallies continues to be my preferred strategy, with 17,500 as the medium-term target.
Disclosure: I am part of Trade Nation's Influencer program and receive a monthly fee for using their TradingView charts in my analyses and educational articles.
