time to BUY DOW index in long term period...i think dow index correction wave has almost ended here...so its the time to buy it for long term period and wait for a new ATH soon....so buy it wid sl which has been demonstrated in the chart i have shown in my analysis...cheers guys and trade safe wid SL and TP
US30 trade ideas

Dow Just crossed the infamous 200MA - Should we worry?The Dow Jones, continues to underperform international markets in 2025.
The Trump Administration is an unstable one which is causing such fear and uncertainty.
It seems like the very essence of policies, procedures and compliance are falling out with the ad hoc and sudden decisions being made by a small group of plutocrats.
Here is why the Dow Jones might remain to stay in trouble and for further downside to come.
Tariff Tensions:
Trump's ramping up tariffs on Canadian metals, and it's freaking out investors 😱📉
Recession Fears:
Mixed signals about a possible recession have everyone on edge 😬🔻
Tech Trouble:
Tech giants like Tesla are tanking, dragging the whole market down 🤖📉
Global Trade Chaos:
Uncertain trade policies are stirring global chaos and confusion 🌍🤯
Market Volatility:
Investor nerves are sky-high with volatility spiking, making everyone super cautious 😟📈
And the technicals speak for themselves.
The Price has broken below the M FOrmation and wait for it... The Infamous 200MA.
So the signs of downside are strong. WIll the US markets allow such downside to come, we'll have to see but as things stand - we have a bearish outlook with a target of 36,296.
What do you think?
Disclosure: I am part of Trade Nation's Influencer program and receive a monthly fee for using their TradingView charts in my analysis.

2025 US30 Beautiful Golden BATThe harmonic Bat pattern has swooped into the Dow Jones, flapping its wings and signaling a potential price lift-off from the tip of its batty little tail at the 39k mark.
Looks like this market Will be ready to take flight—just don’t forget to buckle up, because even bats have a tendency to pull off some unexpected acrobatics mid-air!


Weekly Forex Outlook Sun.March.2.2025 - Fri.March.7.2025Like and Comments would be appreciated :D Not Financial Advice, Just my outlook/opinion

a Recession is coming we have a long way to go before going back up , it could get ugly , we have been on a bullish trend since 2020 before covid years
Dow Jones Weekly AnalysisBased on the weekly Double top Pattern. we may notice a %7 decline in Dow J. which coincides with about the long term weekly trend line support.

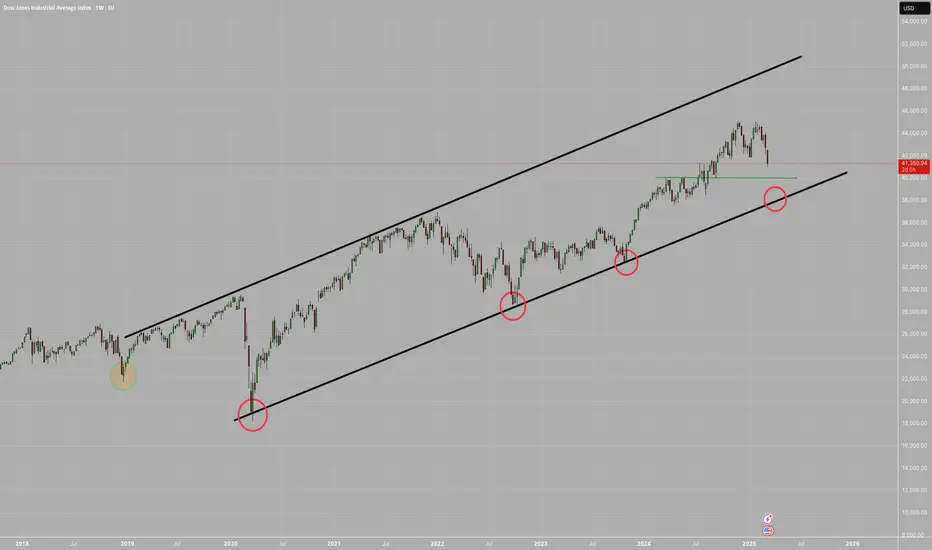
DOW JONES: Starting the final stage of 3year Bull Cycle.Dow Jones got oversold on its 1D technical outlook (RSI = 29.297, MACD = -550.130, ADX = 76.606) as it is currently testing its 1W MA50. This is a level that has been intact since November 2023 and is of high importance to the trend as it has a key cyclical attribute. The driving growth pattern of Dow since the 2009 bottom is a Channel Up and every time a Bull Cycle starts, the 1W MA50 is the first level of support, with every touch of it being the strongest buy opportunity. When the 3 year Bull Cycle is coming to an end, the 1W MA50 breaks and the index approaches the 1M MA50 during its Bear Cycle correction, which becomes the ultimate buy entry for the new long term 3 year Bull Cycle.
The current Cycle should starts getting completed technically after September 2025, so there is a high chance that the 1W MA50 holds here. The three Bull Cycles we've had so far had a fairly similar growth percentage, rising by +70.38% to +76.64%. If the +70.38% minimum range is followed on the current (4th) Bull Cycle, then we're aiming at 48,000 (TP) towards the end of the year. The 1M CCI seems to be printing the exact same build up to the Bear Cycle as in the past.
## If you like our free content follow our profile to get more daily ideas. ##
## Comments and likes are greatly appreciated. ##

DOW-JONES INDEX BEARISH BREAKOUT|SHORT|
✅DOWJONES/US30 index is
Going down now and the price
Made a bearish breakout which
Is confirmed so we are bearish
Biased and we will be expecting
A further bearish continuation
SHORT🔥
✅Like and subscribe to never miss a new idea!✅


US30 BUYOANDA:US30USD
We caught a massive sell on US30. At this moment, price is retesting a Key-Level on the Daily time frame. The break beneath the 41,736.5 area seems to be a huge liquidity grab while also retesting this structural level. If price fails to break this zone, there is a big chance that we will see a retest of the highs over the month. We enter this trade at the lows, and we're already in profit. Let's see how it holds up.

Dow Jones - Bearish Double TOPHello Traders !
The US30 failed to create a new higher high.
The price ormed a double top pattern.
Currently, The neckline is broken !
So, I expect a bearish move📉
____________
TARGET: 40320🎯

US30 Trade Outlook – 12/03/2025📊 Market Structure & Key Levels
US30 is still in a downtrend, but we are seeing a bullish reaction from recent lows. Price is testing resistance around 41,718 - 41,800, a key zone for potential rejection or breakout.
🔍 Key Observations:
✅ Bearish Trend – Price remains below major EMAs, but attempting a recovery.
✅ Key Resistance – 41,800 level is a crucial decision point.
✅ Bullish Breakout? – If price holds above 41,800, we could see a push toward 42,200+.
🎯 Trade Plan:
🔹 Short if rejection at 41,800, targeting 41,628 & 41,400.
🔹 Long if clean breakout & retest above 41,800, targeting 42,200 - 42,400.
💡 Patience. Confirmation. Risk Management.🔥

DowJones INTRADAY Key Trading Levels post CPI dataThe softer-than-expected inflation data has fueled optimism among equity investors, as cooling inflation could alleviate pressure on the Federal Reserve to maintain an aggressive tightening stance. The positive market reaction suggests that participants are increasingly pricing in the possibility of a more gradual approach to interest rate adjustments.
With inflation appearing to moderate, the Federal Reserve may be more inclined to pause or slow the pace of rate hikes in the coming months. The data supports the case for a more dovish stance, as policymakers assess the effectiveness of prior rate increases and the risk of economic slowdown. Markets will continue to monitor upcoming economic releases and Federal Reserve statements to gauge the likelihood of a shift toward a less aggressive monetary policy.
Key Support and Resistance Levels
Resistance Level 1: 42256
Resistance Level 2: 42600
Resistance Level 3: 43000
Support Level 1: 41150
Support Level 2: 40576
Support Level 3: 40073
This communication is for informational purposes only and should not be viewed as any form of recommendation as to a particular course of action or as investment advice. It is not intended as an offer or solicitation for the purchase or sale of any financial instrument or as an official confirmation of any transaction. Opinions, estimates and assumptions expressed herein are made as of the date of this communication and are subject to change without notice. This communication has been prepared based upon information, including market prices, data and other information, believed to be reliable; however, Trade Nation does not warrant its completeness or accuracy. All market prices and market data contained in or attached to this communication are indicative and subject to change without notice.

US30 | 15M | SCALPING TIME | BUYHey There My Friend ; 🫡
SIGNAL ALERT
BUY US30 / 41,355,94 > 41,456,00
🟢TP1: 41,612,00
🟢TP2: 41,839,99
🟢TP3: 42,654,00
🔴SL: 41,029,00
RISK REWARD - 4,00
Thanks to everyone who supports my analysis with likes.💙💙💙

STOCK MARKETS FALLING APART PRICED IN GOLD !!!STOCK MARKETS FALLING APART PRICED IN GOLD !!!
Where the Dow Jones Industrial Average goes, so will the S&P500 and the Nasdaq.
It's a questions of time.

head and shoulders patternbuy
entry 41323
Sl 41153
tp 42000
If the price touches 41800 before reaching the entry price range, the position is canceled.

change the trendIt is expected that the downtrend will continue after some fluctuations and corrections. As long as the price does not stabilize above the green resistance area, the downtrend will continue.


US30 (Dow Jones) Buy Analysis: GTEUS30 has successfully pushed through an Inverse Fair Value Gap (IFVG) on the 1-hour timeframe, confirming bullish momentum. Price action suggests a continuation upward, with the next target being the top trendline around 41,950 - 42,000.
With CPI news scheduled for tomorrow morning, we can anticipate further volatility, but until then, US30 is likely to maintain its bullish structure. As long as price holds above the recent support zone around 41,500, the bias remains bullish towards the higher resistance levels.

Potential longUS30 may find bullish pressure from the 41,500, as it was a previous resistance turning into support.
As long as price action is below 41,500 - 41,000 region, the indice will likely continue it's downward trajectory.
Remaining above the 41,500 may lead to a rise aiming for the above resistance barriers.

Dow Jones Potential DownsidesHey Traders, in today's trading session we are monitoring US30 for a selling opportunity around 41900 zone, Dow Jones is trading in a downtrend and currently is in a correction phase in which it is approaching the trend at 41900 support and resistance area.
Trade safe, Joe.

Bearish Cypher on the Daily DJI?Ruh oh. It's probably not a given considering the flip floppy nature of the Trumpian markets, where every move hinges on his every word, but my whiskers are twitchin'. That's usually not good.
What do you think?
Owhooooo!
