US30 Outlook – 08/04/25The Dow Jones (US30) has shown a strong recovery from the recent low at 36,743, bouncing nearly 1,900 points after a steep selloff. Price is now consolidating just under the 38,800 level — a key short-term resistance zone.
🔍 Technical Breakdown:
✅ EMA crossover on the 1H suggests a shift in short-term momentum to the upside
❗️38,800–39,200 is the immediate resistance zone to clear
📉 Macro trend remains bearish unless bulls reclaim 40,000+
🔻 Below 38,000, bears may regain control and retest 37,300 → 36,743
🧭 Bias:
Neutral-Bearish in the macro view
Bullish short-term if price holds above 38,400 and breaks 38,800 cleanly
📌 Levels to Watch:
Support: 38,400 / 37,300 / 36,743
Resistance: 38,800 / 39,200 / 40,000
🧠 Summary:
This bounce looks strong, but it's still a relief rally within a bearish structure. Bulls need a confirmed breakout above 39,200 to flip the narrative. Until then, treat rallies with caution and keep an eye on momentum shifts at resistance.
US30 trade ideas

UPDATE: The Great Depression 2025–2036 for DJIUPDATE: The Great Depression 2025–2036 for DJI
Here is a revised analysis compared to the one from January this year. In that earlier analysis, I was still anticipating a sharp drop to 6,500 points. However, it now seems that the 6,500 level will not be reached. I do expect the DJI to decline to 17,000 points through an ABCDE structure. This structure could potentially take 15 to 20 years to unfold.

Long US30 !!After a long slip the pair manage to find its feet yesterday at 36... It has now pushed to break 38... Could this be a change of trend or just pull back for more bearish movement, I'm riding a bull

Weekly Forex Outlook Sun.April.6.2025 - Fri.April.11.2025Like and Comments would be appreciated :D Not Financial Advice, Just my outlook/opinion

Falling towards pullback support?Dow Jones (US30) is falling towards the pivot and could bounce to the 50% Fibonacci resistance.
Pivot: 37,575.10
1st Support: 36,424.90
1st Resistance: 39,614.90
Risk Warning:
Trading Forex and CFDs carries a high level of risk to your capital and you should only trade with money you can afford to lose. Trading Forex and CFDs may not be suitable for all investors, so please ensure that you fully understand the risks involved and seek independent advice if necessary.
Disclaimer:
The above opinions given constitute general market commentary, and do not constitute the opinion or advice of IC Markets or any form of personal or investment advice.
Any opinions, news, research, analyses, prices, other information, or links to third-party sites contained on this website are provided on an "as-is" basis, are intended only to be informative, is not an advice nor a recommendation, nor research, or a record of our trading prices, or an offer of, or solicitation for a transaction in any financial instrument and thus should not be treated as such. The information provided does not involve any specific investment objectives, financial situation and needs of any specific person who may receive it. Please be aware, that past performance is not a reliable indicator of future performance and/or results. Past Performance or Forward-looking scenarios based upon the reasonable beliefs of the third-party provider are not a guarantee of future performance. Actual results may differ materially from those anticipated in forward-looking or past performance statements. IC Markets makes no representation or warranty and assumes no liability as to the accuracy or completeness of the information provided, nor any loss arising from any investment based on a recommendation, forecast or any information supplied by any third-party.

DOW JONES Will the 1week MA200 save the day?Dow Jones / US30 almost reached its 1week MA200 today and immediately rebounded.
Last time it approached it so closely was on October 23rd 2023 and last it crossed under it was September 19th 2022.
The most recent was the first higher low of the 3 year Channel Up and the latter was the bottom of the last bear market.
The 1week RSI hasn't been this low since June 13th 2022, which was again a near 1week MA200 test that caused an immediate rebound to the 1week MA50 before the rejection to the eventual bear market bottom.
As long as the 1week MA200 holds and closes the candles over it, we expect the Channel Up to start a near bullish wave like post October 2023.
Target 45200 (same as the March 2024 rally) which is around the All Time High.
Follow us, like the idea and leave a comment below!!

Basic market concept EX1Basic Market Concepts are essentially market examples of the Market Cycle.
Putting it into simple context can help traders know when the market will be ranging (horizontally), where the support and resistance zones are and see how market behavior looks like.

DOW testing long term trend lineTrendline is a support...Dow is testing it as I type,,If it holds well and good..But I dont think it will hold..There is more pain...trendline break will be confirmation.

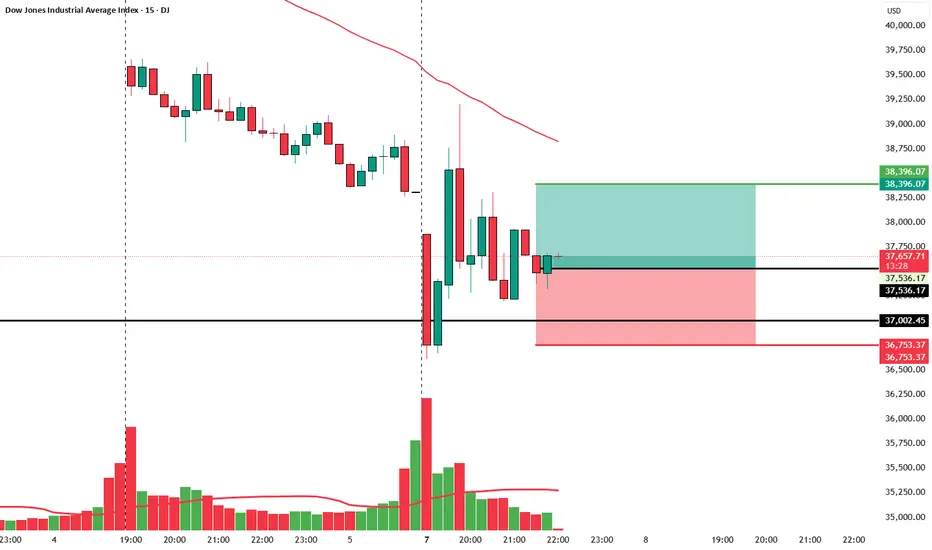
US30 Index Have seen full bearish move at closing now expecting a minor retracement before continuation

Intraday entry 1Everything is pretty much explained in the picture itself.
I am Abhishek Srivastava | SEBI-Certified Research and Equity Derivative Analyst from Delhi with 4+ years of experience.
I focus on simplifying equity markets through technical analysis. On Trading View, I share easy-to-understand insights to help traders and investors make better decisions.
Kindly check my older shared stock results on my profile to make a firm decision to invest in this.
Kindly dm for further assistance it is for free just for this stock.
Thank you and invest wisely.
US30: Absolute Price Collapse Ahead! Short!
My dear friends,
Today we will analyse US30 together☺️
The in-trend continuation seems likely as the current long-term trend appears to be strong, and price is holding below a key level of 37,395.0 So a bearish continuation seems plausible, targeting the next low. We should enter on confirmation, and place a stop-loss beyond the recent swing level.
❤️Sending you lots of Love and Hugs❤️

DJI - Rising Wedge + Double TopDJI showing a rising wedge which is a bearish pattern on this Daily chart
Also right before the prior down movement is a double top in red
Breakdown further out of this rising wedge pattern

US30 MELTDOWN! – 07/04/25🔥 US30 MELTDOWN! – April 7, 2025 🔥
📉 Historic Drop: Dow Jones tanks nearly 3,000 points in just days, crashing through all major support levels!
📉 Low Tagged: Price wicked into the 36,743 support zone before catching a small bounce.
🧠 What’s Happening?
This looks like panic selling—likely triggered by macroeconomic data or unexpected news. Volume is up, and structure is clearly broken.

Last Drop Before The BounceDow has completed ABC (Wave 4). Should resume downtrend in US session to 36k or just below. The market will then likely consolidate before begin a large move upside retracement over the coming week.

Just In: The Dow Jones Industrial Average (DJI) Dip 1,300 PointsOverview
The Dow Jones Industrial Average, also known as the DJIA or simply the Dow, is a market index frequently used to gauge the overall performance of the U.S. stock market. Indexes like the DJIA track the prices of a group of securities.
The Consumer index saw a downtick of 1300 points representing a 5.5% dip. This was days after Donald Trump declared a new set of tariffs targeting 185 countries, including major U.S. trading allies.
Tariffs Concern
The US stocks are poised to continue their bloodbath as futures signaled more fear over President Donald Trump's tariffs. Administration officials and Trump himself signaled on Sunday that they won't back down from their aggressive decisions. Meanwhile, an inflation report is due later this week as well as bank earnings.
Wall Street remained in fear mode over President Donald Trump's tariffs on Sunday evening as futures pointed to more steep losses.
The S&P 500 futures also sank 3.9% and Nasdaq futures dived 4.9%. That follows a devastating week that saw the worst selloff since the early days of the COVID-19 pandemic.
Similarly, the 10-year Treasury yield dropped 8.5 basis points to 3.906%, and US crude oil prices fell 3.7% to $59.72 a barrel.
Countries affected by the tariff rates are:
China (34%), the European Union (20%), and Japan (24%). Fitch Ratings estimated that the effective tariff rate could hit 25% on average — the highest in more than 115 years.
In an X post on Sunday, Former Treasury Secretary Larry Summers cautioned, saying there's a very good chance of more market turbulence similar to what was seen on Thursday and Friday.
Those sessions represented the fourth largest two-day drop in the last 85 years, Summer said. The selloff wiped out about $6 trillion in market cap.
“A drop of this magnitude signals that there’s likely to be trouble ahead, and people ought to be very cautious,” Summers wrote.
Meanwhile, Trump administration and the president himself defended the tariffs.
Technical Outlook
as of the time of writing, the The Dow Jones Industrial Average (DJI) Dip index point is down 5.5% trading in tandem with the support point that aligns with the 38,000 points. On a bearish case scenario, a break below this axis could be canning for the stock market as it will lead to panic selling in the industries concerned.
Similarly, should the bulls manage to thrust the DJI points up to the 42,000 points, we should experience a respite from the bears and possibly increased momentum might sent the stocks soaring higher. With the RSI at 23, this is hinting to a weak momentum with more downside ahead.

Dow Jones - Pivotal moment for the bulls and bears!The Dow Jones Industrial Average is currently approaching a critical juncture, as it risks breaking below and staying under the neckline of a potential double top pattern. A double top formation is typically a bearish signal, indicating a potential trend reversal after the price tests a key resistance level twice, failing to break higher. The neckline, which forms the base of this pattern, is the level that traders will be watching closely to determine the strength of this bearish signal.
If the Dow breaks below and stays under the neckline, it could trigger further downside momentum as liquidity is swept from the market. However, it's essential to note that this initial breakdown could just be a "liquidity sweep," a move designed to trigger stop-loss orders and shake out weaker hands. For the Dow to maintain its bullish potential, it must quickly recover and hold above the neckline after this sweep. If it can do so, the market may find stability and begin to look for higher prices again, as the double top formation would then be invalidated, and a more bullish outlook could emerge.
In summary, while the Dow Jones is at a pivotal moment, the key to higher prices will be whether it can hold above the neckline after sweeping liquidity. A failure to do so could signal further downside, but a strong recovery above the neckline would leave the door open for a potential rally.
For now the Dow jones swept the liquidity under the neckline. However, it needs a quick recovery to maintain and find support on the neckline again. The risk that it now faces is the resistance of the 50, 100 and 200-day MA. Staying above the neckline and reclaiming these MA could be a massive bullish signal on the Dow Jones.
Thanks for your support.
- Make sure to follow me so you don't miss out on the next analysis!
- Drop a like and leave a comment!
Lets chat in the comment section. See you there :)

check the trendIt is expected that a trend change will form within the current support area and we will witness the start of the upward trend.
If the index breaks through the support area, the downtrend will continue until the next support area.

Easy tricks to master you mind during correctionsHello,
The markets have been correcting, and fear seems to be creeping in. What most investors fail to understand is that big corrections such as this are the best opportunities handed to them. This is the best time to buy since markets are trading at the bottom. Additionally, for this time earnings season is about to kick in while this time the market is trading at the bottom. We compiled a few things that can help you remain composed in the current market environment.
A transformative book I would recommend is Trading in the Zone by Mark Douglas. Douglas brilliantly compares elite traders to world-class athletes, revealing that both achieve greatness not through luck, but through rigorous mental discipline and robust, repeatable systems. To guide you toward this coveted "zone" of peak performance, here are four indispensable strategies:
Craft a Rock-Solid Trading Plan
A well-defined trading plan is your compass in the chaotic wilderness of the markets. It spells out precise conditions for entering trades, selecting opportunities, and exiting positions. By faithfully following this blueprint, you anchor yourself in accountability, sidestepping the pitfalls of reckless, emotion-driven moves.
Maintain a Detailed Trading Journal
Think of your trading journal as a mirror reflecting your journey. Record every trade, emotion, and market insight. This disciplined habit empowers you to evaluate your performance, pinpoint weaknesses, and sharpen your approach—unlocking a deeper understanding of your own psychological triggers.
Cultivate Confidence Through Realistic Goals
Confidence isn’t bravado—it’s the quiet strength to take calculated risks and embrace the results. Build it by practicing on a demo account with the seriousness of real stakes, setting attainable targets, and celebrating small wins. This foundation turns uncertainty into opportunity.
Master the Art of Risk Management
In trading, protecting your capital is paramount. Embrace proven techniques like setting risk/reward ratios, deploying stop losses, and sizing positions sensibly. These habits don’t just shield you from ruin—they pave the way for consistent, long-term gains.
With the above rules we believe you should be able to invest or remain invested during these volatile moments. Again, remember the tariffs that have been set are the ceiling and we expect concessions to come once negotiations between countries begin.
Good luck and stay invested. As shown in the chart, this is not the first time the market is undergoing a significant correction. What's clear is that markets always recover from corrections and continue pushing higher. This further reinforces our conviction that this are the best times to begin buying.
Disclosure: I am part of Trade Nation's Influencer program and receive a monthly fee for using their TradingView charts in my analysis.

Double-Top Pattern for the Dow Jones Industrial AverageA long-term, double-top formation has emerged from the all-time highs of 45,073 on the weekly chart of the Dow Jones Industrial Average. With the pattern’s neckline breached (derived from the low of 41,844), chartists will likely target the structure’s profit objective, which stands at 38,613.

DJIDOW Jones
- Fibonacci Level - 50.00%
- Demand Zone
- Break of Structure
- Completed " 12345 " Impulsive Waves
- Order Block

THE BIGGEST FALL EVER, WINTER IS COMING? US30 timeframe 4hHi there. I'm here with new analyze of US30.i think its bearish again, do u think its going to make a biggest bearish trend? lets discuss about it

Bearish MovementThere is currently a huge dragon fly doji that might change to a hammer candle, cause a small bullish movement to 37706.55 where there is a gap before continuing downwards to 32411.88

US30 Eyes 41,300: Bullish Momentum Builds for Major BreakoutTechnical Analysis: The US30 has established a strong support base at 40500, with major support at 40000 serving as a safety net. Price action shows an upward channel formation on the 4-hour chart, indicating potential trend reversal. The risk-reward ratio of 1.60 (500 points risk for 800 points potential reward) provides favorable trading conditions. Recent price action demonstrates higher lows, suggesting accumulation phase and bullish momentum building.
Sentiment Analysis: Market sentiment shows cautious optimism despite recent volatility. Institutional investors maintain bullish positions, particularly in technology and energy sectors. The AAII Investor Sentiment Survey indicates decreased bullish sentiment, which often serves as a contrarian indicator suggesting potential upside movement. Economic forecasts pointing toward a soft landing rather than hard recession support continued equity market strength.
Support and Resistance Levels: Entry zone established around 40500, supported by historical price action and recent consolidation patterns. Major support at 40000 provides clear stop loss level, limiting downside risk. Target of 41300 aligns with previous resistance zone, offering realistic profit objective before encountering major resistance at 41500. Multiple tests of support levels have created strong foundation for upward movement.
Trade Management: Entry: 40500 Stop Loss: 40000 (500 points risk) Target: 41300 (800 points reward) Risk/Reward: 1.60
Additional Considerations: Recent market correction has created oversold conditions, suggesting potential mean reversion toward higher levels. Institutional buying pressure remains strong, with increased volume on upward movements. Technical indicators suggest room for upside before reaching overbought conditions. The 2024 performance showing 12.88% gain supports continued bullish momentum.
The combination of strong technical setup, positive institutional sentiment, and clearly defined support/resistance levels presents a compelling case for longing US30 with 41300 target. The favorable risk-reward ratio and multiple confirmation factors enhance the probability of successful trade execution.
