VIX trade ideas

VIX drop before the next ZOOM upWhat we experienced last week was absolutely insane in terms of volatility. The beauty of all of this is that it's still a trend and many of these spikes are quite predictable. We all knew about the days the tariffs that were going to hit, right? Why didn't you get into UVIX when I called this out days in advance. It's fine, you will have another shot! Actually, we're in line for many many more spikes which is the great thing. Volatility is your friend!
I'll be posting weekly and will be giving away a Free trading alert that has been backtested for the last 3 years over the next week. 2025 will be awesome!
Expect VIX to drop a bit more, great to get in on the SVIX and then let's analyze the next trend and take on UVIX on the upside! This is so easy....

Technical Analysis of VIX Dynamics:As we predicted, the small crab (retail traders) jumped from the ocean depths (high VIX zone) but failed to break the golden resistance at 29 due to panic and stress.
Now the mother crab (institutions) is preparing to surface. If successful, this could crush the VIX and dramatically shift market sentiment - just like we originally envisioned in our crab market theory."

21.20 is the number to watchThis channel is not providing individualized trading or investment advice, nor is it a banking service, brokerage service, trading service, investment service or money management service.

VIX is readying for a golden shot#vix the volatility index is consolidating in falling megaphone channel for another impulsive wave. TVC:VIX had the 1st wave when trade wars begin (But i warned you 3 months ago with VIX chart) then 2nd wave of correction in progress and when 2nd wave consolidation is done, 3rd wave far more cruel than 1st wave will set sail. Beware with your high risk positions, just a warning. Not financial advice. DYOR.

No proof as of nowmany of the indexes put in Doji or Hanging Man candles today - so that's usually a sign of indecision. It was a strange day and I wonder if there will be a surprise move into tomorrow.

Preview for the week - SP500, Gold, Bonds, Yeilds, VIX, DXYI ratchet through some important charts. I cover charts I don't usually trade, but are important for what may come next in the market.

Long Strategy for VIX: Eyeing Stabilization Amid Persistent Vola
- Key Insights: The VIX has exhibited significant fluctuations over the last
week, peaking at levels above 55 before settling in the 37–40 range. This
suggests that although fear has eased, market uncertainty remains elevated.
Historically, the current environment indicates potential opportunities for
a long position if volatility trends continue to moderate. Market
participants should monitor the 32–34 support zone, as a breach below this
could signal improved sentiment and reduced risk-off positioning.
- Price Targets:
* **Next Week Targets (T1, T2)**: T1 = 43.5, T2 = 47.3
* **Stop Levels (S1, S2)**: S1 = 36.2, S2 = 34.8
- Recent Performance: Over the past week, the VIX demonstrated extreme
volatility, briefly surging above 55 early in the week, reflecting intense
fear driven by macroeconomic uncertainty and geopolitical factors. By week’s
end, it had declined to the 37–40 range as market panic subsided somewhat.
Despite this moderation, the index remains well above its historical
average, indicating ongoing caution.
- Expert Analysis: Analysts emphasize that the sharp decline from the midweek
peak signals reduced panic and a potential shift to stabilization. However,
elevated levels above 20 suggest continued risk-off sentiment, with hedging
activity still prominent among institutional investors. Current levels are
reminiscent of volatility spikes seen in major crises, often preceding
medium-term recovery in equities. Traders may expect a possible rally in
equity markets if the VIX trends lower toward the critical 32–34 support
zone, which would further confirm easing fear.
- News Impact: VIX movements this week were influenced by a mix of macroeconomic
concerns and geopolitical risks, which drove it to its highest levels since
COVID. Sentiment began to improve in the latter part of the week as the S&P
500 rebounded from oversold conditions, aligning with historical trends
where elevated fear is followed by equity recoveries. While the decline in
the VIX reflects reduced panic, market risks remain, warranting caution
amidst wider price swings.

Market Insight: VIX Index WatchHold onto your life jackets, folks! The volatility index (a.k.a. the Shark VIX) has emerged from the depths at a slippery 0.88 and is now eyeing the ominous 1.138! 📈💔
Why does that matter? Well, if it's anything like a shark spotting in the ocean, it usually means it’s about to get choppy! 🦈💥 Expect some serious splashes ahead as we ride these market waves!
So, if you prefer calm seas over shark-infested waters, it might be time to brace yourself for a fun (read: bumpy) ride! 🎢 Don’t worry; we’ll keep the floaties handy!
Swim smart, invest wisely! 🌊💸**

VIX VS BTCIve always tried to KISS.(Keep It Simple Stupid) So i've color coordinated each pump of the VIX with each low of BTC and how it is a tall tale of an extreme volatile move coming. Trade safe and keep on keeping on fellow comrades.

Path to 100 VIXI wrote this note on TVC:VIX a few days ago:
www.tradingview.com
And am now expanding it a bit more.
As someone who was working middle office during the original 2016 Trump Election, Brexit, during the Taper Tantrum and a few other major events - I want to lay out my principles on trading the VIX because spikes like this bring a lot of "first time" VIX traders to something that trades like NOTHING ELSE in the market.
This is not a stock in a short squeeze, this is not a generic index.
This is like nothing you've ever traded before. In fact, I'd encourage you to take advantage of TradingView's chart options and instead look at the chart of -1*$TVC:VIX.
That alone should give you pause.
----------------------------------
So - let's start with the principles of the finance business as laid out in the masterclass which was the movie "Margin Call" .
"John Tuld: There are three ways to make a living in this business: be first, be smarter, or cheat."
1. Be First.
You are not first if you are buying above the historic average of VIX 20-21.
If you were buying CBOE:UVXY since Jan 2025, you'd be up 175% right now and likely looking to re-balance into your desired long term asset positions.
2. Be Smarter.
* Are you taking into consideration the VIXEX Cycle?
* Do you know the effect of VIXEX before or after monthly OpEx?
* Do you know the current implied volatility curve of options ON the VIX?
* Do you know that of the last 4 times the VIX has hit 50, it went on to 80+ 50% of the time after that?
* Yes, I've seen the charts going around about forward S&P X year returns but did you know that after the VIX spike to 80 in October 2008, the market (in a decreasing volatility environment) went on a further 35% decline in the next 4-5 months?
* Where is the MOVE? What are the bond indexes & bond volatility measures doing? And if you don't yet understand that equities ALWAYS reacts to what is going on in the rates / yield world... you'll find out eventually. I hope.
3. Cheat
When things start going wrong, everyone wants an easy solution.
That's why its called a relief rally. It feels like relief - the bottom is in, the worst part is over.
But that is what the really big players have the biggest opportunity to play with the day to day environment.
They know our heuristics. They encourage the formation of cargo cult style investing whether that's HODL in the cryptocurrencies or Bogleheads in the vanguard ETFs.
It's all the same and encourages you to forgot first principles thinking about things like:
1. Is this actually a good price or is it just relatively cheap to recent history?
2. Who's going to have to dilute to survive the next period of tighter lending, import costs from tariffs, or whatever the problem of the day is.
3. VIX correlation - volatility is just a description of the markets. Its not a description of the direction. There is periods where volatility is positively correlated to the price movement (like during earnings beats). Know about this and know when it changes.
4. Etc.
Some have pointed out that is more appropriately a measure of liquidity in the SPX.
When VIX is low, that means there is lots of "friction" to price movement. It means that there is tons of orders on the L2 book keeping the current price from moving in any direction too quickly.
When VIX is high, that means there is very low "friction" to price movement. It means there are very few orders on the L2 book and market makers can "cheat" by appearing to create a low volume rally and then rug pull that price movement very quickly (not via spoofing, more just dynamic management of gamma & delta hedging requirements).
Additionally - volume itself becomes deceptive. Volume is just indicating that a trade happened.
Its not telling you to what degree the spread between the bid and ask has blown out to 1x, 2x, or 5x normal and that trades are executing only at the highest slippage prices in that spread.
All of these things are considerations that the market makers can use to make a "buy the dip" situation that works heavily to their advantage.
TLDR: "If you can't spot the sucker in your first half hour at the table, then you are the sucker"
----------------------------------
So - why / when would VIX go to 100?
In 2020, its easy to forget that a culmination of things stopped the crash at -35%.
* March 17, 2020 VIXEX wiped out a significant amount of long volatility positions.
* March 20, 2020 Opex wiped out a significant proportion of the short term put positions
* March 20, 2020 Fed Reserve announced to provide "enhanced" (i.e. unlimited) liquidity to the
markets starting Monday March 23, 2020.
* April 6th, 2020 Peak of Implied Volatility (point where options "most expensive") - which meant that buyers / sellers started providing more & more liquidity following this point.
In 2025, we have yet to see:
* Any motion towards intervention from the Fed for liquidity.
* Any motion from the significant fundamental investors (we're not close to an attractive P/S or P/E on most stocks for Buffett & Co to start buying)
* Any significant motion from companies on indicating strategies about capital raises, layoffs, or other company level liquidity reactions.
* Any "reset" of options in either volatility or hedging. Numbers below as of April 9, 2025:
- SPY 2.8M Put OI for April 17
- VIX 3.5M Call OI for April 16
Just an example but maybe IF we see those clear and NOT get re-bought for May Opex... we might be ready to call a top here at 50 VIX.
Otherwise.... we're just at another stop on the path to 100.

Historical co-relation of VIX and SPXWhen VIX hit all time high and retraced below 35, it is a good indicator of the start of a bull run

"When the VIX is low, look out below!""When the VIX is low, look out below!"
+
FEDs motto "Higher for longer"
=
Fed rate hikes to go: 2-3 left
it is pivot time, change of market dynamic from "bad news is good news" to "bad news is bad news".
state of economy is not good and it will start sinking in to investors and public

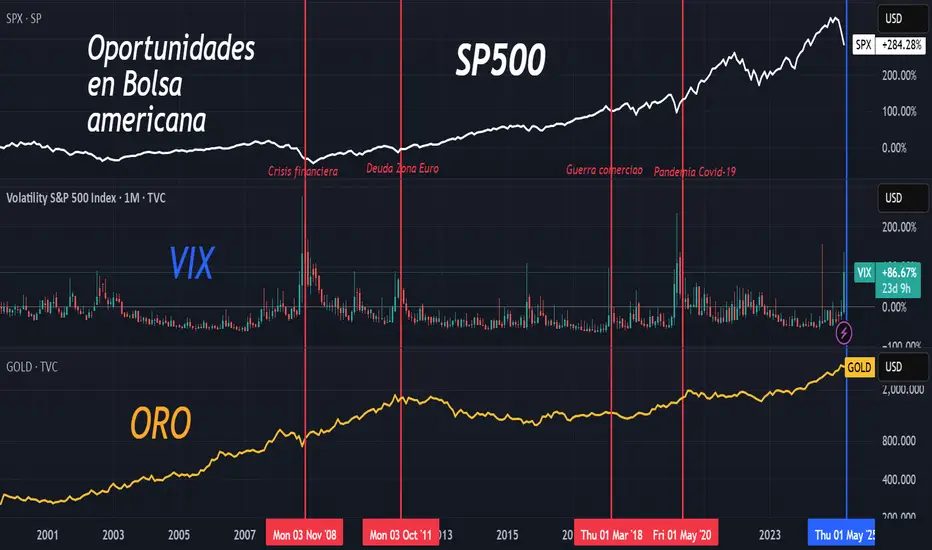
VIX - Extreme fear in the market: a unique opportunity?Extreme fear in the market: a unique opportunity?
An analysis of the most significant
VIX spikes (1987-2025) and subsequent stock market performance.
The VIX (Volatility Index) is an indicator that reflects the level of fear or uncertainty in the market based on expectations of volatility in the S&P 500 Index.
The VIX's 118% surge from April 4 to April 7, 2025 was the fifth largest 3-day surge in market history.
This surge 🚀 reflects the high level of uncertainty that has developed in the markets.
It is very difficult to make informed investment decisions during such periods.
But we can rely on historical patterns.
After the 20 largest VIX spikes, the S&P 500 Index has consistently delivered exceptional returns:
- After 1 year: 16.5% (vs. 12% in normal periods)
- After 3 years: 45.9% (vs. 39.5% in normal periods)
- After 5 years: 83.0% (vs. 74.4% in normal periods)
The difference in returns over the 4 years is 10.2% above average.
Over the past 40 years, there has only been one negative return (the 2007 spike before the financial crisis), while most extreme fear events have become outstanding buying opportunities. For example, the August 2011 spike was followed by an impressive 117% return over the next five years.
When market panic reaches extreme levels, institutional capital typically steps in against retail sales, setting the stage for stronger long-term growth. History shows that these moments of maximum fear often represent optimal entry points for patient investors.
It is essential to realize that historical patterns do not always hold true in the future. Each crisis has unique characteristics and causes that can lead to different outcomes.
These statistics provide good mathematical expectations, not guarantees.
This has always been the case in the market, and proper handling of math expectations and risk management are the foundations of profitable strategies.
Best regards EXCAVO
_____________________
Disclosure: I am part of Trade Nation's Influencer program and receive a monthly fee for using their TradingView charts in my analysis.

VIX Option Flow Signals Volatility Spike A massive wave of institutional option activity is pointing toward an upcoming surge in volatility—and likely a pullback in equities even more. Here's what the VIX flow is telling us:
🧠 Key Takeaways:
🔺 Aggressive Call Buying on VIX
Heavy blocks on VIX 22–42.5 calls, with most trading at the ask, signaling urgency.
Standout trades include:
1,407x April 22C @ $10.73 – $1.51M
2,535x May 60C @ $1.55 – $394K
5,770x April 40C @ $2.95 – $1.7M
📅 Short- to Mid-Term Focus
Expiries are clustered around April 16 and May 21, suggesting a volatility spike is expected within the next 1–6 weeks.
💵 Big Premiums Paid
Multiple trades between $500K and $1.7M, indicating strong conviction or heavy portfolio hedging.
📉 Minimal Put Activity
Very few puts being bought on VIX, signaling no expectations for volatility to fall.
📊 What This Means for Markets (SPY/QQQ)
This type of flow usually precedes a market correction, a macro catalyst, or event risk. Whether it's CPI, earnings season, or geopolitical flare-ups—institutions are bracing for turbulence.
🔮 Prediction:
Expect a spike in the VIX and downward pressure on major indices like SPY and QQQ in the coming 1–3 weeks.
This flow doesn’t lie—smart money is prepping for a move.

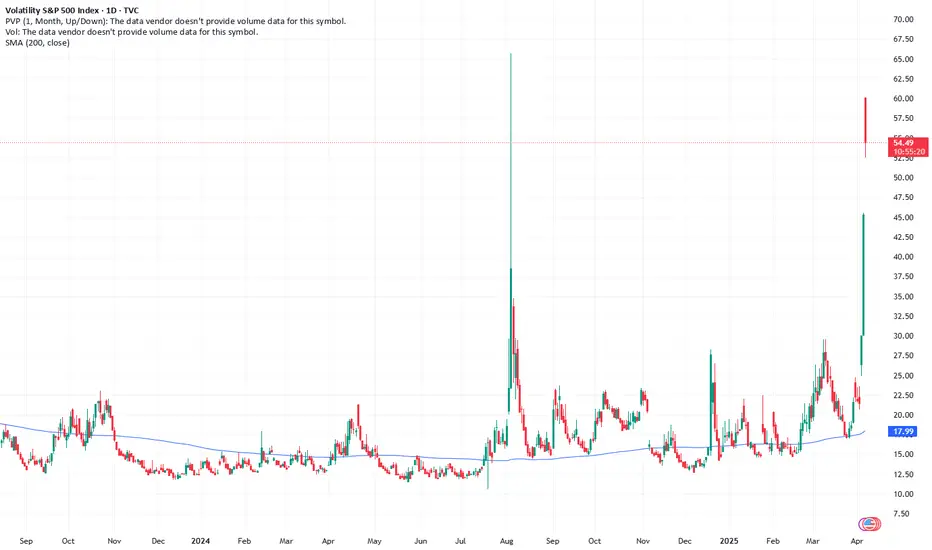
VIX Clips 60 as Market Volatility and Tariff UncertaintyThe VIX Clips 60 as Market Volatility and Uncertainty Surge on Tariff Announcement
The CBOE Volatility Index (VIX), often dubbed the “fear gauge,” surged past the 60 threshold this week—the highest level since August 5, 2023—as markets reacted violently to an unexpected announcement by the U.S. President regarding global tariffs. The sharp rise in the VIX, which measures market expectations of 30-day volatility, underscores the profound uncertainty now gripping investors, with the Dow Jones Industrial Average plummeting over 1,000 points and the S&P 500 entering correction territory. The trigger? A sweeping tariff policy unveiled by the administration on Liberation Day, a symbolic holiday marking a shift in economic strategy, which has sent shockwaves through global markets.
The VIX at 60: A Sign of Extreme Fear
The VIX typically hovers around 15-20 under normal conditions, reflecting moderate uncertainty. However, readings above 30 indicate heightened anxiety, and levels above 50 are rare, historically occurring during major crises like the 2008 financial collapse or the 2020 pandemic sell-off. This week’s spike to 60 marks a dramatic escalation, signaling a market gripped by fear. Analysts attribute this to the suddenness and scale of the President’s tariff announcement, which caught investors off guard after a period of relative calm.
The Liberation Day Tariff Announcement
On Liberation Day—a holiday commemorating historical freedoms—the administration announced a 25% tariff on a broad range of imports from key trading partners, including China, the EU, and others, effective immediately. The move, framed as a “national economic security initiative,” aims to curb perceived trade imbalances and protect domestic industries. However, its immediate impact has been severe:
Scope and Speed: The tariffs apply to $500 billion in goods, targeting sectors like semiconductors, automotive parts, and consumer electronics. The abrupt implementation, with no prior warning or negotiation, has left businesses scrambling to adjust supply chains.
Political Context: The announcement coincided with domestic political tensions, including debates over inflation and job creation. The White House argued the tariffs would “level the playing field” for American workers, but critics warned of retaliation and inflationary pressures.
Market Chaos: Sectors Under Siege
The tariff shockwave rippled across asset classes:
Equities: The S&P 500 fell 2+% on Monday, its worst single-day drop since March 2020. The Nasdaq, heavily weighted in tech stocks reliant on global supply chains, plunged over 5%.
Sectors: Semiconductor firms like Intel and AMD tanked, while automakers such as Ford and Tesla declined sharply.
Expert Analysis: A Volatility Tipping Point
Historical Parallels and Economic Risks
The current volatility mirrors past crises:
2008 Financial Crisis: The VIX hit 80 as Lehman Brothers collapsed, but the current crisis stems from policy, not financial contagion.
2020 Pandemic Sell-Off: The VIX spiked to 82 as lockdowns paralyzed economies, but today’s uncertainty is self-inflicted.
However, the tariff-driven uncertainty poses unique risks:
Inflation: Higher import costs could push inflation back above 4%, complicating the Fed’s rate-cut path.
Global Growth: The World Bank warns that trade wars could shave 2% off global GDP by 2025. Emerging markets, reliant on exports, face currency crises.
Looking Ahead: Can Calm Return?
Markets may stabilize if the administration signals flexibility. Potential pathways include:
Negotiations: A G20 summit in September offers a venue for de-escalation, though diplomatic progress is uncertain.
Policy Reversal: If tariffs are delayed or narrowed, the VIX could retreat. However, the President’s rhetoric suggests a hardline stance.
Corporate Adaptation: Companies might pivot to domestic suppliers, but such shifts take years, prolonging volatility.
Conclusion: A New Era of Uncertainty
The VIX at 60 marks a pivotal moment. Markets are now pricing in not just the immediate tariff impact but a broader shift toward protectionism and policy-driven instability. For investors, the path forward is fraught with uncertainty. While short-term volatility may ebb with reassurances, the long-term consequences—trade wars, inflation, and geopolitical friction—could redefine global economics for years.
With Liberation Day’s tariffs reshaping the landscape, one thing is clear: the era of low volatility is over. The question now is whether policymakers can navigate this new turbulence—or if markets will remain hostages to fear.

Market Prep 4/7Probably a low today. I expect the cash session to reach 4800-4750 by close and maybe sooner.

Oportunities in American Stocks sp499We used to have some equities and stocks in a continuing growth now the thing has changed
Don’t Get Trapped! Today’s Market Could Make or Break YouMarket Meltdown or Setup for Generational Wealth? What Traders Need to Know Today 🔥📉
As of April 7, 2025, global financial markets are experiencing significant volatility following the announcement of new tariffs by President Donald Trump. U.S. stock futures indicate a sharp decline at the market open:
* S&P 500 Futures: Down approximately 4.5%.
* Dow Jones Industrial Average Futures: Down around 4%.
* Nasdaq-100 Futures: Down more than 5%.
In such a turbulent environment, traders should exercise heightened caution. Here are some strategies to consider:
1. Prioritize Capital Preservation: Increased volatility can lead to unpredictable market movements. It's advisable to reduce position sizes and set strict stop-loss orders to manage potential losses.
2. Avoid Impulsive Decisions: Rapid market changes can tempt traders into reactive decisions. Stick to your pre-defined trading plan and avoid making trades based on short-term market noise.
3. Stay Informed: Keep abreast of ongoing developments related to trade policies and economic indicators. Reliable news sources and official statements can provide crucial insights that may impact market conditions.
4. Consider Defensive Assets: In times of market downturns, some investors shift towards traditionally safer assets like government bonds or gold. Assess if incorporating such assets aligns with your risk tolerance and investment strategy.
5. Evaluate Long-Term Positions: For long-term investors, market corrections can present opportunities to acquire quality assets at reduced prices. However, ensure that any new positions are in line with your overall investment goals and risk profile.
Given the current market instability, it's essential to remain vigilant and disciplined. Consulting with a financial advisor can also provide personalized guidance tailored to your individual circumstances.

Go Long on VIX as Market Fear Peaks with Trade Tensions
-Key Insights: The VIX has surged to 45.31, the highest level since the COVID
crash, signaling extreme fear in the markets. With trade tensions between the US
and China intensifying and economic fears prevailing, market volatility remains
high. This environment presents a potential opportunity to go long on VIX as
investors seek protection from downside risks.
-Price Targets: Based on current analysis, set price targets for VIX as follows:
- T1: 50
- T2: 55
- S1: 43
- S2: 42
These targets account for continued volatility with potential upside in VIX as
market fear sustains.
-Recent Performance: The VIX's recent performance highlights a significant surge
correlating with increased market volatility. The index has climbed sharply from
previous levels as investors react to negative market drivers, including
indiscriminate selling across various asset classes like stocks, gold, and
cryptocurrencies.
-Expert Analysis: Analysts show cautious optimism in the medium term due to the
heightened volatility but remain wary about immediate long-term entries. Current
market fears pivot around US-China trade tensions, which analysts believe are
central to sustained volatility. Opportunities for day trading are emphasized,
but experts advise prioritizing risk management strategies.
-News Impact: The ongoing trade war between the US and China, alongside
geopolitical developments and a lack of immediate response from central banks
like the Federal Reserve, continues to drive market uncertainty. Declines in
commodities like crude oil and copper underscore economic fears, with the VIX
reflecting this sentiment. Investors are advised to stay vigilant and adjust
strategies according to evolving market conditions.
The VIX Triangle: Countdown to a Bull Run or a Market Meltdown?🧠 What Is the VIX and Why It Matters Right Now
The Volatility Index (VIX), often called the “fear gauge,” has surged to nearly $60, a level we at Vital Direction had anticipated weeks in advance. This dramatic move has injected high volatility across global financial markets — particularly the SPX500, Nasdaq, DAX, and key Asian exchanges like China, Singapore, and Australia.
Such a spike in fear typically signals a pivotal turning point in market sentiment — the kind that leads either to a massive relief rally or a further collapse.
📈 Elliott Wave Analysis: Is VIX About to Complete a Triangle?
Our proprietary Elliott Wave analysis suggests the VIX is forming a classic triangle structure, with wave D likely completed and wave E expected to take the index down to around $16 by mid-September 2025.
This scenario fits with a standard corrective wave pattern, indicating that market panic may be peaking — and that a bullish reversal could be imminent if the structure holds.
⚠️ Critical Technical Level: A sustained breakout above $65.73 would invalidate this triangle structure. That would imply a much more severe market breakdown and trigger deeper fear-driven selloffs across global equities.
📊 SPX500 Forecast: Rare Risk-Reward Setup in Play
If the VIX follows our expected path and declines to $16, we believe the SPX500 and broader US markets could be on the verge of a massive bull run.
This would mark the return of risk-on sentiment and potentially spark fresh highs in major indices and high-beta stocks such as Tesla, Apple, and Amazon.
🎯 Our View: All scenarios remain possible, but we see exceptional risk-to-reward potential building across U.S. equities — particularly in the SPX500. This is one of the cleanest technical setups we’ve seen in months.
🚨 Final Thoughts: All Eyes on the VIX
The VIX is now the key chart to watch.
A move down to wave E at $16 = potential bull market ignition.
A breakout above $65.73 = likely market meltdown and sharp selloffs.
This is a textbook example of how Elliott Wave Theory and volatility analysis can provide a true edge in market timing.

Why Did the #VIX Explode?Trump protests escalated the markets sharply. The VIX exploded because nobody knows what will happen.
💢Why did the #VIX explode?
What we see in the chart is not just a panic, it is an ‘uncertainty shock’.
Although Trump has only been in office for 3 months, he is facing serious street protests due to his aggressive policies and rhetoric.
Such crisis situations are enough to momentarily shake the confidence of global investors in the US, because markets are emotionless, shaped according to events.
Due to the protests, the S&P and NASDAQ have been feared to sell hard
Investors play hedge in such situations.
At the same time, algorithms may even be opening temporary long positions in anticipation of ‘Will the FED intervene?’.
Let's take a look at the scenarios;
If the protests grow, if the clashes spread:
🔸VIX overflows over 50
🔸S&P500 experiences serious selling pressure
🔸Gold and bonds come to the fore
If Trump steps back or the situation calms down:
🔹VIX is quickly withdrawn
🔹Indexes may regain strength
🔹Investors switch to risk-taking again
In short, if the protests grow, this could be not just a VIX jump, but the potential collapse spark of 2025.
#vix #spx #spx #spx500 #nasdaq #nasdaq100

VIX spikingHello y'all. I have no detailed analysis other than this chart looks interesting and we can see historically what this has meant for the economy, although correlation is not causation, of course.
Stay vigilant.
