BTCI Chart Fibonacci Analysis 080325Trading Idea
1) Find a FIBO slingshot
2) Check FIBO 61.80% level
3) Entry Point 61/61.80%
Chart time frame:B
A) 15 min(1W-3M)
B) 1 hr(3M-6M)
C) 4 hr(6M-1year)
D) 1 day(1-3years)
Stock progress:C
A) Keep rising over 61.80% resistance
B) 61.80% resistance
C) 61.80% support
D) Hit the bottom
E) Hit the top
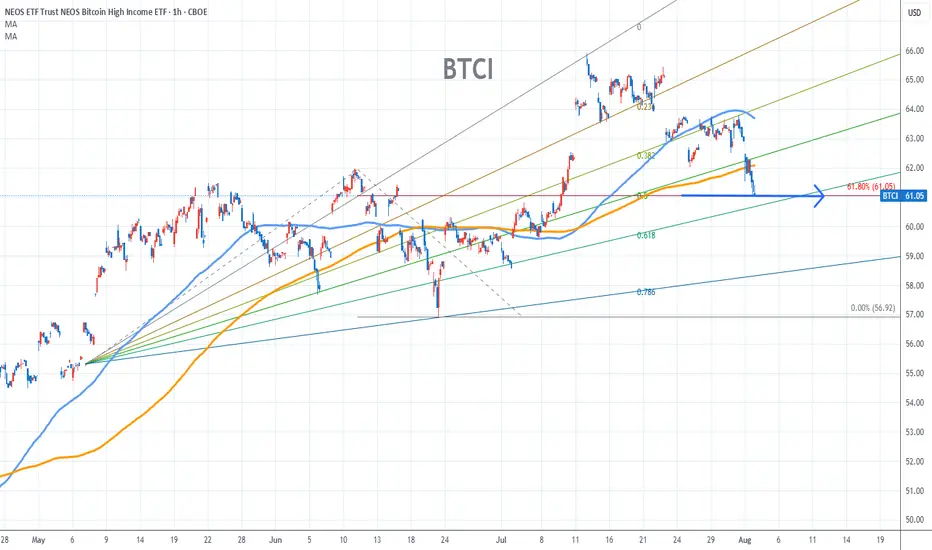
Stocks rise as they rise from support and fall from resistance. Our goal is to find a low support point and enter. It can be referred to as buying at the pullback point. The pullback point can be found with a Fibonacci extension of 61.80%. This is a step to find entry level. 1) Find a triangle (Fibonacci Speed Fan Line) that connects the high (resistance) and low (support) points of the stock in progress, where it is continuously expressed as a Slingshot, 2) and create a Fibonacci extension level for the first rising wave from the start point of slingshot pattern.
When the current price goes over 61.80% level , that can be a good entry point, especially if the SMA 100 and 200 curves are gathered together at 61.80%, it is a very good entry point.
As a great help, tradingview provides these Fibonacci speed fan lines and extension levels with ease. So if you use the Fibonacci fan line, the extension level, and the SMA 100/200 curve well, you can find an entry point for the stock market. At least you have to enter at this low point to avoid trading failure, and if you are skilled at entering this low point, with fibonacci6180 technique, your reading skill to chart will be greatly improved.
If you want to do day trading, please set the time frame to 5 minutes or 15 minutes, and you will see many of the low point of rising stocks.
If want to prefer long term range trading, you can set the time frame to 1 hr or 1 day.
BTCI trade ideas
BTCI – setting up for a breakout?What is CBOE:BTCI ?
BTCI is the NEOS Bitcoin High Income ETF – a covered-call ETF designed to provide exposure to Bitcoin price trends with monthly income. The fund uses options strategies to generate consistent yields while holding Bitcoin futures and related instruments.
💰 Annual dividend yield: approx. 18%, paid monthly
📆 Ideal for income-focused investors who still want crypto exposure without direct volatility.
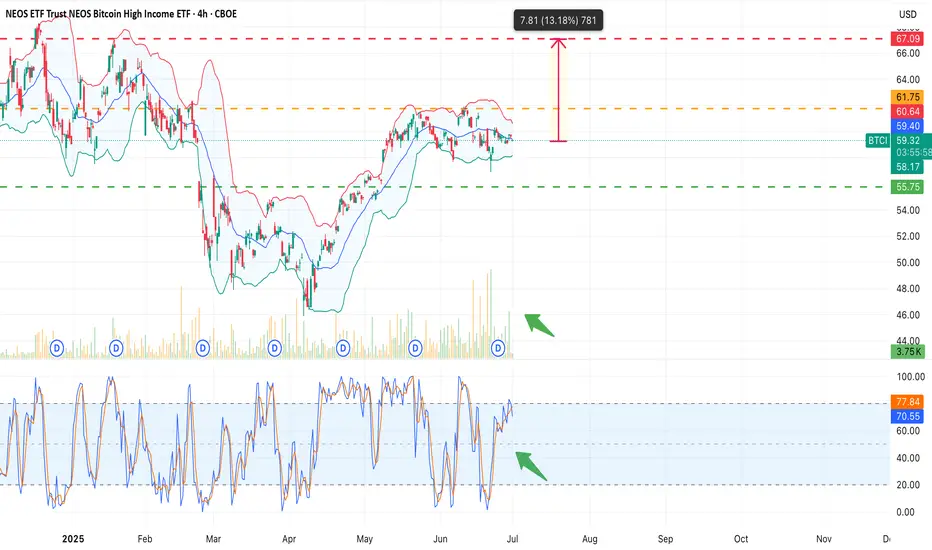
CBOE:BTCI Current price: $59.64
Strong volume is building up (green arrow), and the stochastic oscillator shows bullish momentum returning.
Price is consolidating just under the resistance at $60.90–61.75, with a potential upside of +13.2%, targeting the $67.09 zone.
📈 If volume holds and breaks above $61.75, the move toward the target becomes likely.
🟩 Key support: $58.07 / $55.75