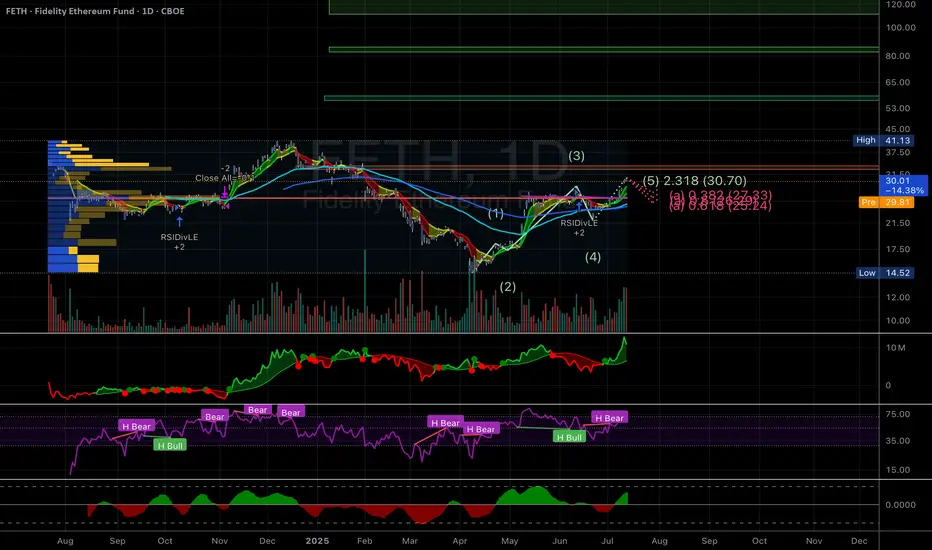
Key stats
About Fidelity Ethereum Fund
Home page
Inception date
Jul 23, 2024
Structure
Grantor Trust
Replication method
Physical
Dividend treatment
Capitalizes
Distribution tax treatment
Ordinary income
Income tax type
Capital Gains
Max ST capital gains rate
39.60%
Max LT capital gains rate
39.60%
Primary advisor
FD Funds Management LLC
Distributor
Fidelity Distributors Co. LLC
FETH aims to track the price of ether, less trust expenses and liabilities. It intends to provide accessibility to ether without the complexities of acquiring, holding, and trading directly through a digital asset platform. Holdings are valued daily based on the Fidelity Ethereum Reference Rate, using ether price feeds from eligible ether spot markets and a volume-weighted median price methodology. The index aggregates the trade flow of several Ethereum platforms during an observation window, focusing on relevant transactions, as defined by the index provider. This serves as a once-a-day benchmark rate of ethers USD price, calculated as of 4:00 pm EST. The fund will not utilize leverage and may also sell ether in order to pay trust expenses and liabilities. As a result, this may be reflected as a return of capital and an income expense.
Classification
Symbol
Geography
Global
What's in the fund
Exposure type
Cash
Bonds, Cash & Other100.00%
Cash100.00%
Top 10 holdings
Summarizing what the indicators are suggesting.
Oscillators
Neutral
SellBuy
Strong sellStrong buy
Strong sellSellNeutralBuyStrong buy
Oscillators
Neutral
SellBuy
Strong sellStrong buy
Strong sellSellNeutralBuyStrong buy
Summary
Neutral
SellBuy
Strong sellStrong buy
Strong sellSellNeutralBuyStrong buy
Summary
Neutral
SellBuy
Strong sellStrong buy
Strong sellSellNeutralBuyStrong buy
Summary
Neutral
SellBuy
Strong sellStrong buy
Strong sellSellNeutralBuyStrong buy
Moving Averages
Neutral
SellBuy
Strong sellStrong buy
Strong sellSellNeutralBuyStrong buy
Moving Averages
Neutral
SellBuy
Strong sellStrong buy
Strong sellSellNeutralBuyStrong buy
Displays a symbol's price movements over previous years to identify recurring trends.
Related funds
Frequently Asked Questions
An exchange-traded fund (ETF) is a collection of assets (stocks, bonds, commodities, etc.) that track an underlying index and can be bought on an exchange like individual stocks.
FETH trades at 24.83 USD today, its price has fallen −1.70% in the past 24 hours. Track more dynamics on FETH price chart.
FETH net asset value is 24.90 today — it's risen 36.93% over the past month. NAV represents the total value of the fund's assets less liabilities and serves as a gauge of the fund's performance.
FETH assets under management is 1.17 B USD. AUM is an important metric as it reflects the fund's size and can serve as a gauge of how successful the fund is in attracting investors, which, in its turn, can influence decision-making.
FETH price has risen by 36.13% over the last month, and its yearly performance shows a −29.16% decrease. See more dynamics on FETH price chart.
NAV returns, another gauge of an ETF dynamics, showed a 14.85% increase in three-month performance and has decreased by −25.54% in a year.
FETH fund flows account for 1.50 B USD (1 year). Many traders use this metric to get insight into investors' sentiment and evaluate whether it's time to buy or sell the fund.
Since ETFs work like an individual stock, they can be bought and sold on exchanges (e.g. NASDAQ, NYSE, EURONEXT). As it happens with stocks, you need to select a brokerage to access trading. Explore our list of available brokers to find the one to help execute your strategies. Don't forget to do your research before getting to trading. Explore ETFs metrics in our ETF screener to find a reliable opportunity.
FETH invests in cash. See more details in our Analysis section.
FETH expense ratio is 0.25%. It's an important metric for helping traders understand the fund's operating costs relative to assets and how expensive it would be to hold the fund.
No, FETH isn't leveraged, meaning it doesn't use borrowings or financial derivatives to magnify the performance of the underlying assets or index it follows.
In some ways, ETFs are safe investments, but in a broader sense, they're not safer than any other asset, so it's crucial to analyze a fund before investing. But if your research gives a vague answer, you can always refer to technical analysis.
Today, FETH technical analysis shows the neutral rating and its 1-week rating is buy. Since market conditions are prone to changes, it's worth looking a bit further into the future — according to the 1-month rating FETH shows the buy signal. See more of FETH technicals for a more comprehensive analysis.
No, FETH doesn't pay dividends to its holders.
FETH trades at a premium (0.29%).
Premium/discount to NAV expresses the difference between the ETF’s price and its NAV value. A positive percentage indicates a premium, meaning the ETF trades at a higher price than the calculated NAV. Conversely, a negative percentage indicates a discount, suggesting the ETF trades at a lower price than NAV.
FETH shares are issued by FMR LLC
FETH follows the ETH/USD Exchange Rate - USD - Benchmark Price Return. ETFs usually track some benchmark seeking to replicate its performance and guide asset selection and objectives.
The fund started trading on Jul 23, 2024.
The fund's management style is passive, meaning it's aiming to replicate the performance of the underlying index by holding assets in the same proportions as the index. The goal is to match the index's returns.