Option Insights – Trading the Greeks (4 of 4) Time Value TradingOption Insights – Trading the Greeks Part 4 of 4: Time Value Trading and the Volatility Premium
________________________________________
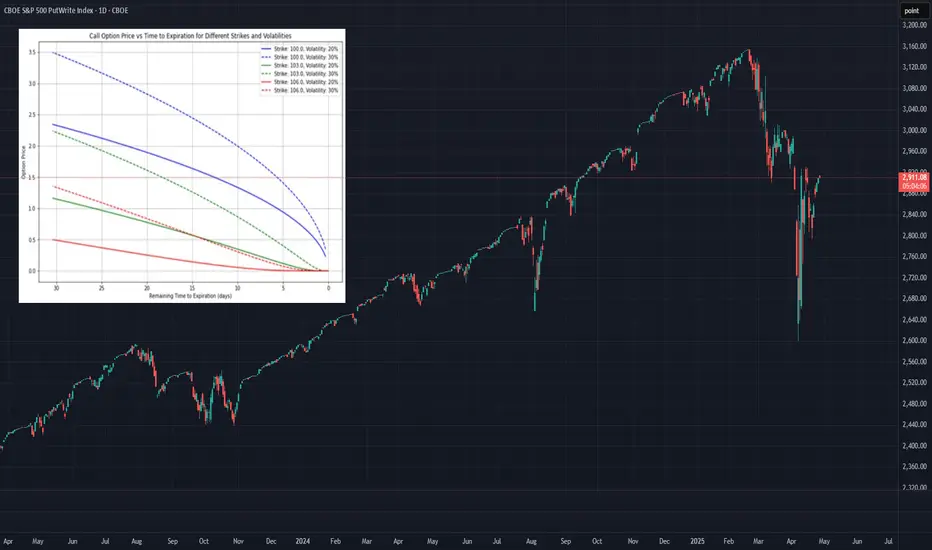
Introduction to Time Value Strategies
Time value strategies are among the most widely used option strategies. In their simplest form, these involve selling opt
Related indices
Why everyone is probably wrong - Part IVAnd why the stock market is about to melt up.
The majority of market participants are bearish. From hedge fund managers to popular media outlets, everyone is calling for the crash of a lifetime.
The above weekly chart tells a fascinating story. Could talk about it for hours. There are three line c

SPX Put Write IndexAs you can see, we are at the upper boundary of a 200 day widening bollinger band (highlighted circle) and considerably off the mean. This is a similar setup as the April 2022 intermediate peak (highlighted circle) and subsequent selloff. The only thing that I can see moving this widening bollinger

PUT Write Index (daily)A sharp (vertical) drop in the RSI (9) on the Put Write index has not been kind to the SPY (purple line). Pretty consistent forecaster. More downside ahead it it looks. So the first episode took us from 447.57 to 362.17, or -19%; the second episode went from 417.23 to 348.11, or -16.6%; a 15% drop

Heads UPEvery time RSI on the PUT Write index takes a sharp turn down (like now), the market is shaping a sharp correction.


ES - PUT Volumes +21% for potential Squeeze ahead of WednesdayProtection, cheap protection, continues to be applied.
The outsized demand for downside protection provides
an opportunity to squeeze the ES SPY SPX to higher highs.
The Gamma Squeeze in AMC, TSLA, ARKK will come to a
decided end as we begin to Roll the VIX with settlement
next Wednesday.
We rema


See all ideas
Displays a symbol's price movements over previous years to identify recurring trends.