Option Insights – Trading the Greeks (4 of 4) Time Value TradingOption Insights – Trading the Greeks Part 4 of 4: Time Value Trading and the Volatility Premium
________________________________________
Introduction to Time Value Strategies
Time value strategies are among the most widely used option strategies. In their simplest form, these involve selling options, collecting the premium, and aiming to retain it—i.e., hoping the option remains out-of-the-money (OTM) until expiration.
The most common application is the sale of short-term (typically under 3 months, often under 3 weeks) OTM put options on single stocks or equity indices.
The core rationale for selling options is time decay: if all other variables remain constant, the passage of time alone reduces the option’s value. As an option seller, time is on your side.
This strategy has gained popularity thanks to consistent historical statistics: OTM equity puts have ended worthless most of the time in recent years—especially for zero days to expiration (0DTE) options. This suggests a high probability of success.
However, selling puts carries significant downside risk. In periods of market correction or sharp price drops in the underlying, losses can occur that wipe out months—or even years—of accumulated premium. This creates a tradeoff: frequent small profits from selling options, offset by rare but potentially large losses.
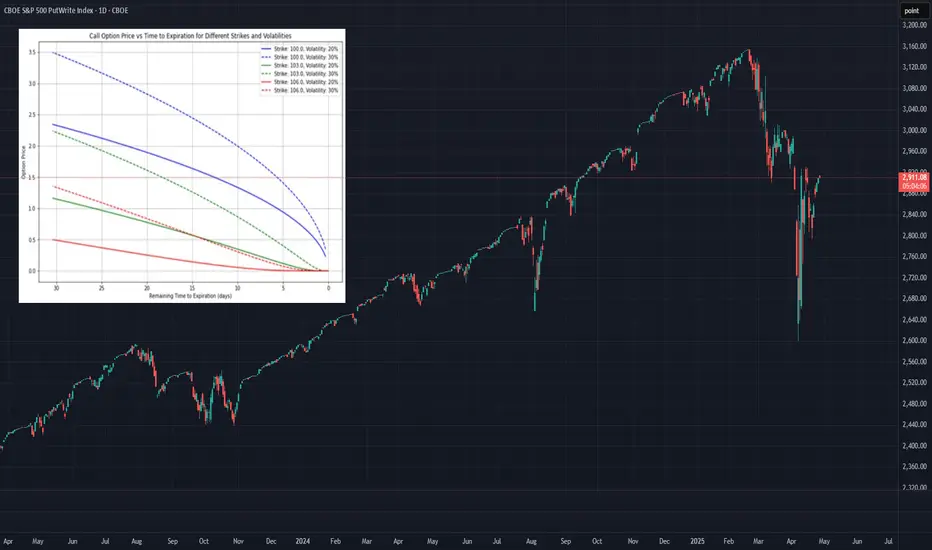
This asymmetry is evident in the performance of strategies like the PUTW ETF, which systematically sells SPX puts (see introductory chart).
________________________________________
Where Does Time Value Come From—and Why Does It Decay?
The time value of an option arises from the volatility of the underlying asset.
If the underlying price exhibited no volatility—moving linearly at a fixed rate—option values would simply reflect discounted intrinsic value at expiration. In that world, options would behave predictably and hold no additional time value.
But in reality, assets fluctuate. Volatility introduces uncertainty, which increases the value of the option due to its asymmetric payoff:
• If the price ends far in-the-money (ITM), the buyer benefits fully.
• If it ends far out-of-the-money (OTM), the buyer loses only the premium.
This favorable risk profile has value, which is reflected in the option’s time value—the premium over its intrinsic value.
This time value increases with:
• Longer expiration horizons
• Higher volatility
• Proximity to the money
When options move far from the strike price (deep ITM or OTM), they begin to resemble synthetic linear positions (long or short underlying) or a “null” position, and the asymmetric advantage—and hence time value—diminishes.
________________________________________
What Is Actually Traded in Time Value Strategies?
Selling short-term options is essentially a range-trading strategy. The trader is expressing a view that, by expiration, the underlying will not enter a specific price range.
For put sellers, this range extends from the strike price down to zero:
• If the underlying stays above the strike, the premium is kept.
• If it drops below, losses can be substantial.
In this setup:
• Delta represents the key short-term risk factor (price sensitivity).
• Over time, Theta (time decay) takes over close to the strike price.
This range-based view may be easier to formulate than directional price forecasts. Traders are effectively betting on the probability that the underlying finishes OTM.
Black-Scholes implied probabilities for OTM options to end OTM are typically above 50%. However, each trader must assess whether the real-world probability is higher or lower.
Success hinges on understanding the drivers of real-world price distributions, including technical levels, macroeconomic triggers, and potential pivot zones that define future price ranges.
________________________________________
Risk Management in Time Value Trading
A well-defined risk management plan is essential for time value strategies. If the underlying moves contrary to expectations, actions include:
• Closing the position and accepting a loss (realize losses early, when they are small, especially if hope is only reason to hang on)
• Hedging with the underlying asset (Delta Target/Hedge)
• Selling option spreads instead of naked options (limiting downside)
• Using entry filters to avoid risky environments
For example, in U.S. equity markets, traders often avoid selling puts when:
• VIX9D rises above the VIX
• The first VIX future trades above the second
These are signs of market stress and increased near-term volatility.
Typical guidelines for selling index puts:
• Sell index puts with Deltas between -20 and -30, as these are often favored by institutional hedgers.
• Buy back short puts when Delta reaches -10, as the remaining premium does not justify the risk.
• Selling options with a Delta of around ±10 is colloquially known as "picking up pennies in front of a steamroller"—frequent very small wins with looming large risks.
________________________________________
Monetizing the Volatility Premium
One of the most compelling aspects of time value trading is the opportunity to capture the volatility premium.
Historically, the implied volatility of index options has been consistently higher than the realized volatility of the underlying index. This difference—implied minus realized—is the volatility premium.
Why Does the Volatility Premium Exist?
Primarily due to:
• Hedging demand, especially from leveraged players
• Structural imbalances in supply and demand for options
For example, SPX volatility premium is often visualized by comparing:
• VIX (a synthetic 30-day implied volatility index)
• Rolling 30-day realized volatility of the SPX
________________________________________
This premium can be exploited through two main methods:
1. Selling variance swaps
2. Selling options and delta-hedging with the underlying
________________________________________
How Does Selling Options Capture the Volatility Premium?
Experienced vs. Calculated Volatility
Monetizing the volatility premium essentially involves shorting the spread between implied volatility and ex-post realized volatility—effectively being short implied volatility while being long realized volatility.
This relationship is most directly observable in variance swaps, where the final payoff is precisely the difference between the initially implied variance and the ex-post realized variance (i.e., the square of volatility).
Though not identical to the direct difference in volatilities, it is effectively equivalent in the context of variance swaps.
However, when trading options—or the underlying asset—neither implied nor realized volatility can be directly traded in isolation.
Instead, what can be monetized is the price of volatility. This is done by selling the option premium, which reflects the market’s price for implied volatility for a specific strike and expiration date.
Realized volatility, in turn, can be "traded" by replicating the option's payoff through a delta-hedging strategy.
In such a replication, the final cost of the strategy corresponds to the option premium as if it had been priced using the ex-post realized volatility.
Replicating a long option in this way is functionally equivalent to delta-neutralizing a short option position.
Thus, capturing the volatility premium using options involves selling options (becoming short the price of implied volatility) and delta-hedging the position with the underlying asset.
This hedge effectively replicates the value of the option as priced with realized volatility.
________________________________________
Important Distinctions:
• In a variance swap, realized volatility refers to the variance or standard deviation of daily returns (calculated realized volatility).
• In a delta-neutral option strategy, the realized volatility depends on the hedging frequency and is called experienced volatility.
While the payoff of a variance swap reflects the difference between implied variance and calculated realized variance, an option-selling strategy monetizes the premium (implied volatility) versus the replication cost (based on experienced volatility).
This distinction marks a key difference between using options versus variance swaps to capture the volatility premium.
Variance swaps are passive and fixed in structure, whereas option-based strategies introduce degrees of freedom in how delta hedging is executed—thereby influencing which realized volatility is ultimately experienced.
The art of monetizing the volatility premium through options lies in designing a hedging strategy that minimizes experienced realized volatility over the life of the trade.
When done effectively, this approach can be profitable even when calculated realized volatility exceeds the initial implied volatility.
That said, selling options while delta-hedging introduces gamma risk—the risk arising from large or frequent movements in the underlying asset. The profitability of the strategy becomes path-dependent, driven by how volatile and jumpy the asset is during the option’s life.
This introduces another layer of complexity that differentiates option-based strategies from variance swaps.
There is another way to trade the implied vs. realized spread via Timer Options, which we will not cover here.
________________________________________
Gamma Scalping vs. Volatility Premium Strategies
Though seemingly opposite, Gamma Scalping and Volatility Premium capture strategies via options are surprisingly complementary. Both strategies involve option positions + underlying hedges, but with different objectives for hedge execution. While Gamma Scalping’s Delta Hedge is balancing countercyclical, trying to maximize the experienced volatility, Volatility Premium Strategies hedge Pro-cyclical and try to minimize the experienced volatility.
by parsifaltrading
PUT trade ideas
Why everyone is probably wrong - Part IVAnd why the stock market is about to melt up.
The majority of market participants are bearish. From hedge fund managers to popular media outlets, everyone is calling for the crash of a lifetime.
The above weekly chart tells a fascinating story. Could talk about it for hours. There are three line charts here. From top to bottom,
1) The Put / Call ratio. This is the number of Put contracts open. i.e. folks who are ‘short’ on the stock market. That includes Dr Michael Burry.
2) The S&P 500 index
3) The Put / Call Relative Strength Index
Never in history have so many market participants been this bearish as is shown on the Put/Call chart (1). Am forever writing in the ideas I publish, 90% of market participants will lose money. This chart is screaming why the majority are about to be caught out..
Breaking it down..
A) Bearish divergence between the Put/Call ratio (1) and RSI (3) following an extreme overbought condition. Look left. Not only is the divergence confirmed lower highs are printing.
B) Price action resistance breakouts.
C) The stock market has ripped higher when the Put/Call ratio corrects. I know, this time is different ;-)
Is it possible this is meaningless gibberish flying in the face of the economic fundamentals?
For sure.
Is it probable the market rips to new all time highs?
Yes.
Ww

SPX Put Write IndexAs you can see, we are at the upper boundary of a 200 day widening bollinger band (highlighted circle) and considerably off the mean. This is a similar setup as the April 2022 intermediate peak (highlighted circle) and subsequent selloff. The only thing that I can see moving this widening bollinger band on up the ladder like in 2021 is a FED pivot.
It's all about the Fed.

PUT Write Index (daily)A sharp (vertical) drop in the RSI (9) on the Put Write index has not been kind to the SPY (purple line). Pretty consistent forecaster. More downside ahead it it looks. So the first episode took us from 447.57 to 362.17, or -19%; the second episode went from 417.23 to 348.11, or -16.6%; a 15% drop from 2/15/23 would take our current leg to 351.95 around mid April.

Heads UPEvery time RSI on the PUT Write index takes a sharp turn down (like now), the market is shaping a sharp correction.


ES - PUT Volumes +21% for potential Squeeze ahead of WednesdayProtection, cheap protection, continues to be applied.
The outsized demand for downside protection provides
an opportunity to squeeze the ES SPY SPX to higher highs.
The Gamma Squeeze in AMC, TSLA, ARKK will come to a
decided end as we begin to Roll the VIX with settlement
next Wednesday.
We remain patient waiting for Gaps to fill on both the
CASH/SPOT VIX and M1/M2 AUG/SEP.
Presently we are trading CL only waiting for Fills on ES
NQ and YM SELL TO OPEN.
VIX Bids in on SEP M2 OCT M3 NOV M4.


