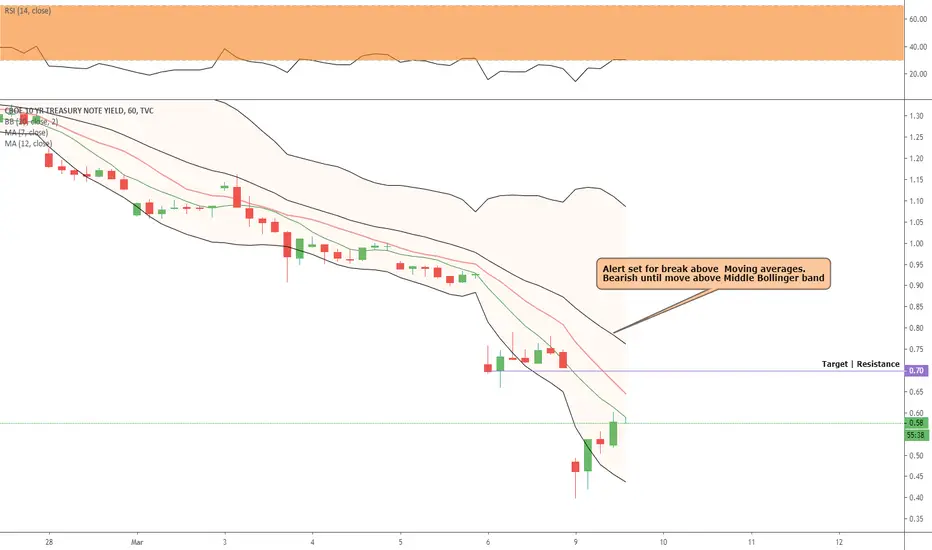
10 Year Treasury Note drop haltedTime will tell if its a dead cat bounce or the beginning of a much welcomed reversal.
This week will certainly test its stability as the perfect storm is in full force today.
TNX.P trade ideas

Booming economy he says..debt based economy looks as if the debt load is too much. people are fleeing to safety. people are selling stocks. people are panicking because of covid 19. rates cuts cant help. QE cant help either. tighten your chin straps its getting real. bond market is falling like a rock. do your DD but I believe metals is the only way to go in this environment.

10 year T-Note yield weekly bullish divergence. Daily RSI LOW.This looks like a bottom for the time being.
The divergence on the RSI is not to be ignored.

TNX 10 treasury WeaknessTNX the index related to interest rate in the usa has showed a weakness recently. Will the usa lower rates? will the usa maintain its current rate? We dont know but we follow the trend and by now it shows weakness so sell it.

TNX to 0% per HS top As predicted last week. Going to zero. Euro will fly. Gold, who the hell knows?

US 10-year yield could retest former low of 1.34 pctThere is a map of a consolidation for US 10-year yield.
The range is quite volatile between 1.50 and 2.00.
The wave B should complete with a drop to the 1.50 and then wave C could unfold up to 2.00.
After that the drop should resume to retest 1.34.


Ten Year Interest Rates Bottom at Major SupportToday 2/24/20 TYX - 30 year US Interest rates made a new low for the secular bear market that began in 1981.
This low was unconfirmed by 10, and 5 year rates.
TNX - 10 year interest rates bottomed 1 tick above the major bottom made in July 2016, also close to a new moon.
Daily RSI has a significant bullish divergence.
The daily TNX bar was completely outside the lower Bollinger Band. Please see my 2/24/20 GLD post.
Just like the Gold market, tremendous evidence of a possible major turn taking place.
Mark

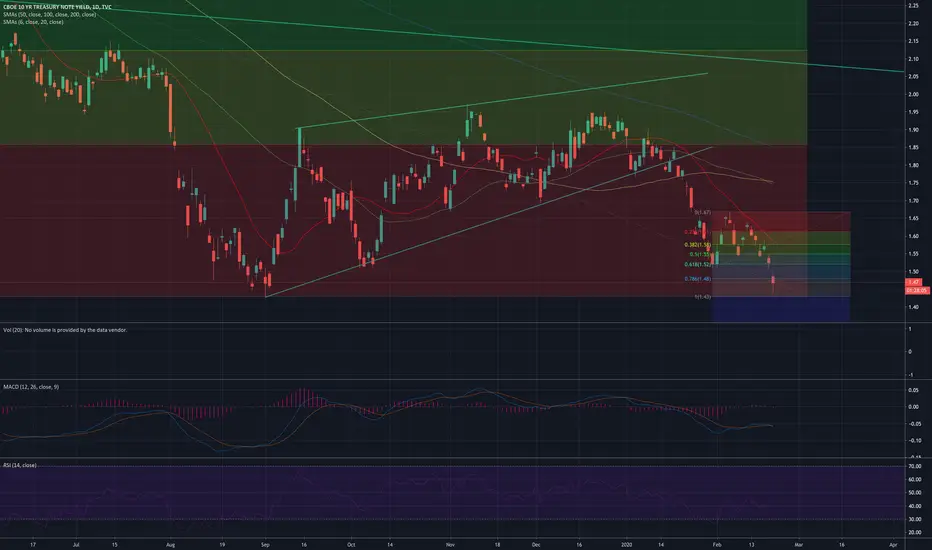
TNX - 10 year yields short term bottom?Maybe. Impulse leg seems to suggest a potential turn right around here. I've got 1.43. Stocks taking it on the chin again today but selling for now is somewhat orderly and subdued. Watching closely for a break of the 1.43 range. If so we will need to visit the mid-2016 1.34 range and test for support there. Time will tell. Be safe my friends.
TNX - Ten Year Yields SinkingAs mentioned here two months ago, ten year yields continue to fall and it looks like we are going to test support in the 1.4 area. Markets appear to be tinkering on the precipice of frivolity and exercising caution here would be prudent. Market was down over 300 in a blink of an eye today with seemingly little or no support. Stay safe my friends.

S&P 500 PE and US 10 Year note PE for comparison... 1.2S&P 500 PE and US 10 Year note PE for comparison... 1.2 updated version minor improvements
The last two cycles, bonds were most of the time more expensive than stocks... the same thing happened in the 1940s in the US interested rate history, unfortunately, there is not historical data to be showed here about that particular time....


TNX - 10 Year Treasury Yield's sliding!As I suggested in a note a couple months ago, ten year treasury yields are heading down again this time I believe to test both the the October 1.51 low and the September 1.43 low. Remember we hit 1.34 in 2016 and that low is not out of the question. Spreads between ten and two year yields are narrowing as well and all yields the lowest they've been since September/October. I'm not sure we have a recession coming, but Powell suggested today that inflation is still lower than their anticipated target level and it was starting to worry him. He also suggested that we were in an asset bubble and that also was not good. Talking heads don't know whether the Fed should raise or lower rates. It stinks out there.
Stocks like AAPL and MSFT are priced for perfection and their stock prices fully reflect the results they have posted. There is no more room to run. AAPL today looks to have made a short term top. Look at the bar. MSFT's peak in the dot com bubble was $59.50 and it ultimately traded down to $15 in 2009 losing 75% of its value. Today it is $175 or 1200% above its 2009 lows. If it follows the same pattern it did previously we could see $45 prices in the future. AAPL is significantly higher in percentage terms and the stock is up $100 in four months.
Yields look like they may break the previous lows. The chart is ugly and if you're at all confused about where things are headed don't be. Rates and equities are both headed down. Dismissing the coronavirus, global politics and the equity bubble is a dangerous game to play. Distribution is taking place. Be safe my friends.

TNX(W) Flag Break to WW DB Shark Triplet LowTNX(W) Flag Break to WW DB Shark Triplet Low
TL 2007 Break Shark WW EW Ending Asc Wedge
.886 First Reaction

S&P 500 PE and US 10 Year note PE for comparison...The last two cycles, bonds were most of the time more expensive than stocks... the same thing happened in the 1940s in the US interested rate history, unfortunately, there is not historical data to be showed here about that particular time....

TNX - YIELDS ???BLUF : 10 YR Yields trending LO'r, Let's see How-Low before it thrust for the next leg?

ORBEX: Look at Yields for Further Clues in Equities!Equities keep climbing higher on the back of renewed trade and Brexit optimism and also on the back of monetary policy decisions! Interest rates are on hold, but the Fed did cut three times in 2019!
Will the surge continue into 2020? And if yes, when can we expect the massive sell-off everyone’s been talking about to take place?
ake a pick as we near the end of a cautious year!
Timestamps
DXY 4H 02:10
SPX 4H 04:10
US Yields 06:10
Stavros Tousios
Head of Investment Research
Orbex
This analysis is provided as general market commentary and does not constitute investment advice

TNX 10-Year Yield + Repo Problems + Bonds Extreme LeverageWhen plumbing works well, you don’t need to think about it. That’s usually the case with a vital but obscure part of the financial system known as the repo market.
Bank of International Settlements has been reporting some very interesting documents connecting overleverage by MULTIPLE hedge funds (potentially even my hero Ray at Bridgewater) in the overnight repo market (making a percentage by loaning it out) which is having ripple effects in the TNX, and Bond market - Forcing the Fed to supply liquidity directly from its balance sheet. But the plumbing (Repo=Liquidity) got blown out, and the Fed is plugging the hole with QE.
The about-face interest rate policy from the Fed put significant stress on the overleveraged market.
The Bank of International Settlements is just doing routine reports, I think they don't want to be caught up in it.
Feels crazy, but I think the TNX might fall further.
Stocks and Bonds correlations appear to be absent.

EOY ShitShow? Let's Watch! HEAD SHOTs ONLY!"Conclusions – FX Swap Lines and “QE4”
Year-end in the FX swap market is thus shaping up to be the worst in recent memory, and the markets are not pricing any of this. Prices don’t seem to discount the facts that excess reserves are gone and the Fed’s operations still have not added any, and that G-SIB scores are binding and risk large U.S. banks clamping down on market making.
If we are right and the Fed loses control over the o/n rates complex going into year-end – not just around the spot turn but the weeks leading up to it – what else can the Fed do?
(1) encourage foreign central banks to use of the FX swap lines;
(2) start QE4 by switching from buying bills to buying coupons;
QE4 would re-fill the Bakken Shale in an instant...
as primary dealers stuck with Treasuries would pay off their repos with J.P Morgan, and that would bring us back to the natural state of the token system, that is, a state, where the distribution of excess reserves is uneven once again, and where J.P. Morgan is the system’s lender of next-to-last resort once again. Why is that better than the Fed?
QE4 – as much as it makes sense – won’t happen unless the Fed’s hands are forced...
and not responding to potential stresses in the FX swap market with the swap lines, may be what forces the Fed’s hands."
--Z Pozsar Global Money Notes #26 Countdown to QE4? (Google title if link does not work)
research-doc.credit-suisse.com
NOTE. . Entropy is basically a measure of disorder. For the universe, the ultimate disorder is heat death, meaning there are no patterns at all in the atoms of the universe. It’s cold chaos. Information is the opposite of disorder and chaos. It has patterns that convey something to the receiver..Surprise is the opposite of predictability ... HEAD SHOTs ONLY!!! Bust-IT!

Ten Year Treasury - Race to the bottom?Watching this closely. Still has some room to run inside the down channel. There is a higher low in place with the August low. I think this plays out slowly over time. There may be a character change but I see potential for a lot of sideways action to down action until 2022.


10 Year Treasury - is rally almost over?Ten year yields have bounced about 50 basis points since the low a couple months ago, but are still down 135 basis points since last year. Looking for rates to fail at the resistance that marks a downgrade that dates back decades. This would be a huge negative for the market and ultimately the economy. Precious metals would be the place to be.
