TNXOut of all of the charts out there, this is the one that scares me the most. I have 0% confidence that the Fed will be able to maneuver a "soft landing". The more likely outcome is that they over do it and break just about everything in their path. These are the same idiots that thought this inflation would be "transitory". My 4 year old daughter could have told them that inflation wasn't going anywhere. I still don't truly know if they're morons or if they want to break the economy. Bullish interest rates for the foreseeable future imo.
TNX.P trade ideas

$TNX softness - Another indication for the expected rally Makes sense $TNX stopped falling as they stopped the bond buying program
It's been weaker so likely they started buying again
#inflation #interestrates
Will #fed reintroduce QE and/or also stop raising (short term at least) rates???

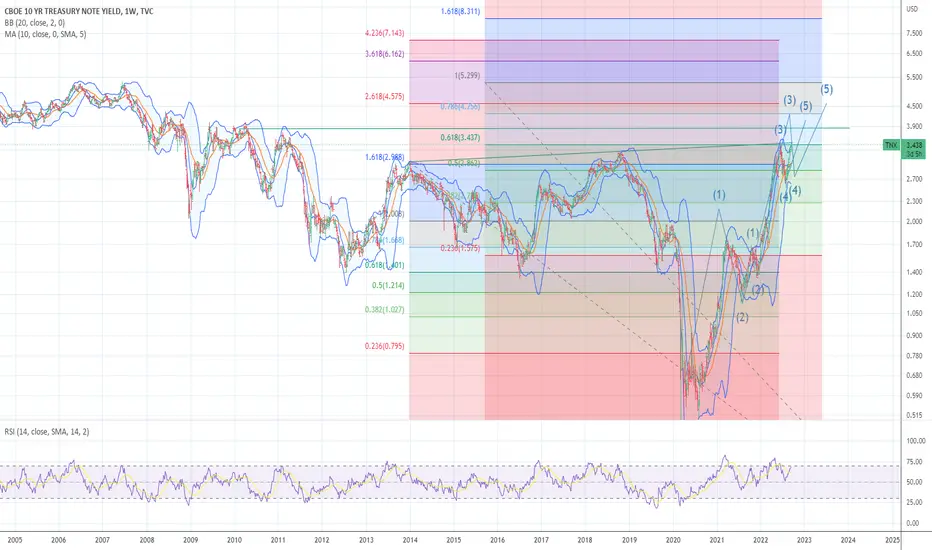
Reaching the limits of rationalThe market has reached the limits of what humans see as rational:
10Y Yields: nearing 4 percent, yes, still acceptable, still manageable.
EURUSD: 0.96..0.98 - with all things happening around the world, yes, understandable.
SPX: down ~1000 points from ATH, totally acceptable for the challenging environment we are in.
But it's all going to be fine. Things will come back to normal, and we just need to buy more SPX, and add to our long EURUSD position, because it cannot fall forever.
This is the current market sentiment. Such sentiment precedes the extended wave 5, which goes far beyond rational and will transition the world into the state of complete panic.
SPX below 1500, EURUSD at 0.75. 10Y yields above 7 percent in 3 months.
The world still hasn't realized that something is wrong with their beliefs. Once it happens, the sellers will flood the markets in FX, Stocks and Treasuries overnight. The problem is, the buyers will vanish at the same time.

Taking a Long-Term Look at Treasury YieldsU.S. Treasuries have gone through a period of historic turmoil as the Federal Reserve starts shrinking its balance sheet. Today’s weekly chart considers just how dramatic the moves have been using the 10-year note’s yield index (TNX).
The first thing that stands out is the accelerating rate of change since about March 2021. This chart shows ROC with a nine-week interval, which peaked above 80 percent almost five months ago. Moves like that are simply unprecedented in the six decades of TNX’s history.
Of course, there are problems with viewing percentage change for an index that is itself a percentage. (After all doubling from 0.6 percent to 1.2 percent isn’t a huge feat.) So we used TradeStation’s analytics to compare the changes in net points and found they’re still unusually large.
For example, TNX rose about 120 basis points in the last nine weeks. Aside from the spike in April and May of this year, that was the biggest increase since August 2003. Before that surge, you have to look to the 1980s, when yields were twice as high.
The second interesting pattern is highlighted by our Price Streak custom script, which shows TNX has risen for nine consecutive weeks. That is the longest unbroken upward move since 2004. (The only longer runs occurred in 1968 and 1972-1973.)
Finally, consider the simple price level. TNX hit 3.992 yesterday, just 2 basis points from its peaks in both 2009 and 2010. While yields may continue higher over the longer-term, will traders look for consolidation at this historic resistance level?
TradeStation has, for decades, advanced the trading industry, providing access to stocks, options, futures and cryptocurrencies. See our Overview for more.
Important Information
TradeStation Securities, Inc., TradeStation Crypto, Inc., and TradeStation Technologies, Inc. are each wholly owned subsidiaries of TradeStation Group, Inc., all operating, and providing products and services, under the TradeStation brand and trademark. You Can Trade, Inc. is also a wholly owned subsidiary of TradeStation Group, Inc., operating under its own brand and trademarks. TradeStation Crypto, Inc. offers to self-directed investors and traders cryptocurrency brokerage services. It is neither licensed with the SEC or the CFTC nor is it a Member of NFA. When applying for, or purchasing, accounts, subscriptions, products, and services, it is important that you know which company you will be dealing with. Please click here for further important information explaining what this means.
This content is for informational and educational purposes only. This is not a recommendation regarding any investment or investment strategy. Any opinions expressed herein are those of the author and do not represent the views or opinions of TradeStation or any of its affiliates.
Investing involves risks. Past performance, whether actual or indicated by historical tests of strategies, is no guarantee of future performance or success. There is a possibility that you may sustain a loss equal to or greater than your entire investment regardless of which asset class you trade (equities, options, futures, or digital assets); therefore, you should not invest or risk money that you cannot afford to lose. Before trading any asset class, first read the relevant risk disclosure statements on the Important Documents page, found here: www.tradestation.com .

TNX 10 YR Yield Needs to Cool Down 3.9%TNX 10 year yield ran too hot lately but will it cool down? I think we need to watch it at 3.9% if it has a retracement from there.

What really drives US Dollar strength?What can I do with a US Dollar milkshake theory?
➡️As a chart trader, not much.
What can I do with chart defined macro economics?
➡️As a chart trader, much more!
More weakness than meets the eye for $dxy.
#fintwit #northstarbadcharts #gold #dxy #fomc

TNX still targets 7%I drew this shape a few months ago. I re-publish the chart without changes.
Only the target for EURUSD is now 0.75.

$TNX 10 yr yields proving stubborn despite latest CPI number should have been bearish for yields ...watching closely ..something does not add up.

TNXNew highs for 10 year rates ahead of the Fed minutes tomorrow. Doesn't look like they'll be slowing down anytime soon either.

$TNX still showing weakness but should be HIGHER!Another weak day for $TNX
This should be higher BUT why not?!
Serious negative divergence too
#FED & worldwide #CentralBanks
have made commitment to buy debt
OR
Maybe 75bps won't make it for whatever reason?
Hmmm

TNXDangerously close to being dangerous, if that makes sense. Better lock in fixed rates on all debt you have if this gets above 3.50 imo.

$TNX showing strength but it's being fought$TNX is NOT backing down, so far
Doesn't make sense for it to stay where it was
3.46 is way low for 75bps, UNLESS...
The monthly is worrisome
Granted we have couple weeks left but chances of it selling off are minimal
We're looking @ a trend break
Let's c what #FEDs do

HOW HIGH WILL RATES GO WITH 8 % INFLATION NEXT STOP 3.99/4.25 The chart posted is now updated to reflect ew count and fib projections . the spread between the two to reach 2 % inflation is now in the area of a 5.25 target in the 10 % . this would most likely be seen in march 2023 the final low in the sp 500. . we still have not seen the panic in my work this is due oct 4th to the 20 th So the fractal is very much intact
𝟭𝟬-𝘆𝗲𝗮𝗿 𝗨𝗽𝗱𝗮𝘁𝗲: $TNX Monthly. Breakout40+ year trend-line resistance broken, backtested and now the 10-year appears to be heading for 5%
$TLT $ZN_F $ZB_F $TYX $DXY $ES_F $SPY $VIX $QQQ #Tech #Bonds #Rates #Trading 📈

TNX10 year rates are working on a failed head & shoulders at a trendline going back ~40 years. No telling how high rates could go if this gets back above 3.50.

10 yr yield to see NEW HIGHS target is now moved from 3.55 3.85 /4.00 in the ten year yield That still is not going to be The TOP .As we enter fall production of gasoline slows to produce heating oil causing inflation cycle to pop effecting start of more issues . I want you ALL to understand what a BEAR MARKET looks like MONEY VELOCITY peaked in SEPT 6 2021 .
Inflation adjusted US 10 Year YeildsInflation adjusted US 10 year yields are FUELED UP & ready to unwind.
This will support an IMPORTANT run for gold & silver.
When it breaks down below "sleep mode line", a MASSIVE reprice for the precious metals (and miners) will be enacted.
#stagflation #silver #gold #fintwit

That's Bait Version 2Bull Pennant/Flag are firmly pointed towards 2008 levels.
Question for the next 3-6 months will be how high can interest rates go before the massive amounts of debt becomes unserviceable.
The Bear sentiment will quickly return when the FED has no choice but to continue aggressive rate hikes into 2023.

That's Bait10Y treasury yield is bull flagging to what looks like a return to pre-2008 levels.
Question for the next 3-6 months will be how high can interest rates go before massive amounts of debt becomes unserviceable.
The Bear sentiment will quickly return when the FED has no choice but to continue aggressive rate hikes into 2023.


Bullish For Bitcoin/CryptoThe US 10 year treasury Bonds breaks a major support line @ 2.75.
This means more aggressive rally for Bitcoin/Crypto
Noteworthy:
Do not forget the historical wise saying, "Never invest more than you can afford to lose."
Not a financial advise, I suggest using this only as a guide - Do your own research.
Let us know what you think about this subject in the comments section below.
Kindly support this idea with your like and comment, thank you.

Wave analysis playing out The 10 yr has definitely sniffed out the potential fed pivot. Wave analysis has been spot on. Update to prior idea.

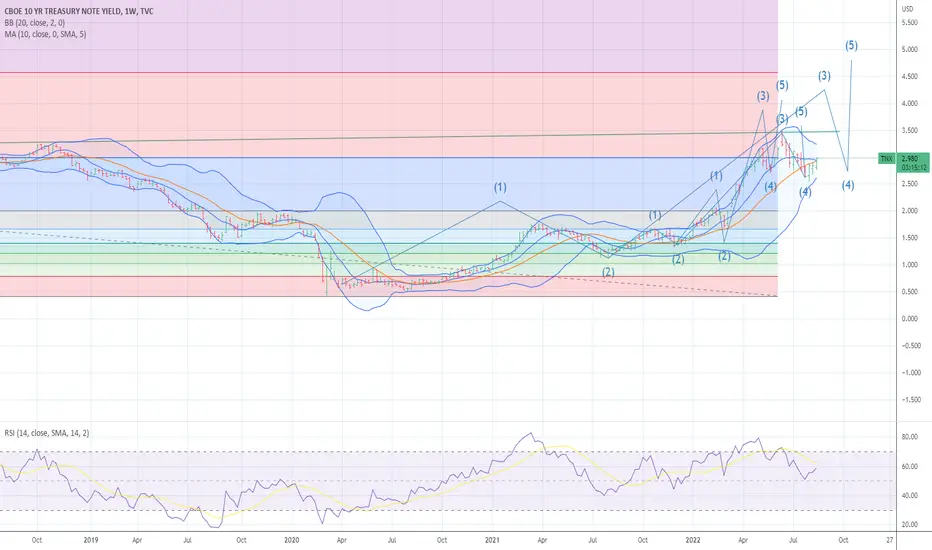
6-7% in a couple of monthsThe structure holds, and 6-7% in TNX is unavoidable as a sunset by end of day.
The move will be fast (less than two months), and will take the entire market with it:
* SPX will quickly break below 2000 in w3, and then eventually reach 1500 or lower.
* EURUSD will hit 0.80 or lower
* USDJPY will get close to 100
* Crude will revisit 10-15 range
* USDRUB will attempt to break above 200 (150-200 is realistic)
Why will the Yen strengthen against the Dollar while every other currency loses value? Because the Yen will be for the Japanese market what the Dollar will be for the rest of the world: a temporary buffer to absorb all instantaneously released liquidity from the fire-sale of all other yielding assets.
As I said earlier in my forecasts: H2'22 will hit the markets a lot harder than the 2008. Be prepared.
