$VIX making noise again, cautionNot liking what I am seeing here in reference to the $VIX.
Let's see how we close today but this roar sounds stronger than the previous one we had not long ago. That might have been the practice, test.
#stocks have performed well and are due for some sort of "rest", consolidation.
1Hr CBOE:SPX showing weakness with a bearish crossover.
4Hr seems okay, for now at least.
#VIX AMEX:SPY AMEX:SPXS AMEX:SPXL
VIX trade ideas

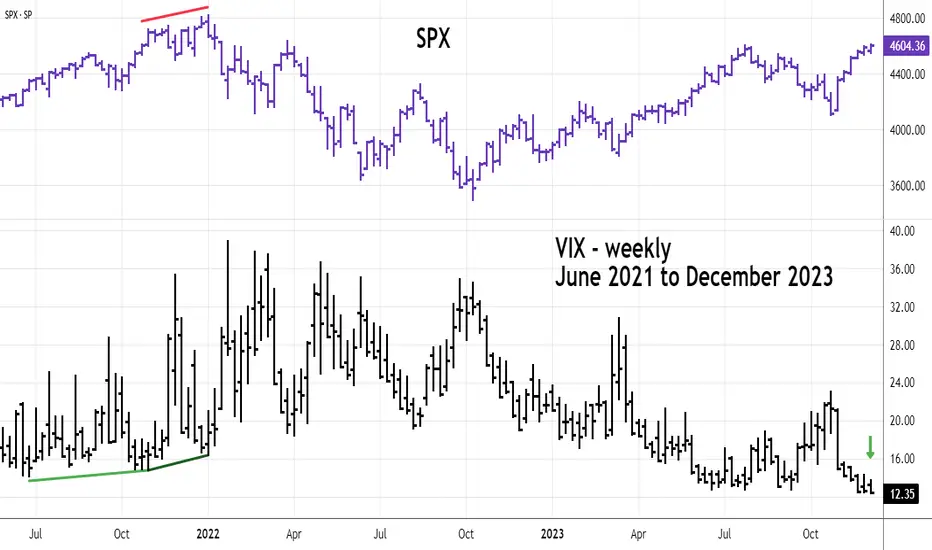
VIX showing that tension is expected soon in the stock markets.The Volatility Index (VIX) is trading within a Channel Down pattern since the September 28 2022 High, which has also been the start of the 2023 recovery year for the stock markets (SPX illustrated by the thin black trend-line). Being negatively correlated in nature, when VIX declined within this Channel, the stocks rose and vice versa.
Since October 23 2023, VIX started to decline again and that sparked the stock rise which is holding up to this day, the end-of-the-year rally. However, we see a deceleration on VIX's decline, while its 1D MACD has formed a Bullish Cross since December 01. Being so close to the Channel Down bottom, a technical rebound is technically plausible and the pattern is recurring as it resembles a lot the previous Lower Lows.
If it does reverse upwards, the SPX can react a few days later as during the previous bottom process and reversal (June 22 - July 27) it lagged. In any case, this pattern shows that by January 2024, we should expect heightened volatility translated potentially into a (short-term at least) pull-back on the stock market.
-------------------------------------------------------------------------------
** Please LIKE 👍, FOLLOW ✅, SHARE 🙌 and COMMENT ✍ if you enjoy this idea! Also share your ideas and charts in the comments section below! This is best way to keep it relevant, support us, keep the content here free and allow the idea to reach as many people as possible. **
-------------------------------------------------------------------------------
💸💸💸💸💸💸
👇 👇 👇 👇 👇 👇

$VIX about to make a moveTVC:VIX is rearing its head again. Last time it sputtered when it roared.
Let's see what happens this time around.
See how the RED LINE keeps pressuring it lower? It has been trading under the average since late Oct. Well, the Yellow line will either GIVE or Push it Higher. It is going to happen sooner rather than later.
SP:SPX AMEX:SPY

VIX to the moon If inflation is currently at the stage of disinflation instead of deflation, we will see a extreme drop in stock market and a interest rates hike would be the next best thing for the Fed to take action to reduce inflation.

VIX long term viewIn my view SPX bullish trend has restarted to target 4900 area then big crash , VIX will test 6 where massive bullish move will start to break the long term rectangle my

VIX near signaling a correctionLow volatility is good for the market, but extreme low volatility is not
As you can see, a lot of times where the TVC:VIX crossed 12 from below it signaled a correction within a bull market
And is not just the VIX, there are other breath indicators that are converging at levels that usually signal correction
I normally track the % of SPX stocks above their 50-day and 200-day MAs, NYSE New Highs/Lows and NYSE New 52-week Highs/Lows
My target would be 4.300 in the SP:SPX

VIX hitting a solid long zone one weekly candlesI will be averaging into some vix calls over the remainder of the year. I believe it will stay relatively low for the near term. My calls will be 6 months out if possible. The vix is known for its spikes and Ill have triggers for it to sell at certain price points. I am also doing this because of a personal conviction of a slight/ or major pull back in the new year. Please leave comments, I love to learn and hear other perspectives!

VIX Index at Lowest Levels Since 2017OVERVIEW
As of 12/12/2023, CBOE:VIX is at 11.82.
There have only been a handful of periods over the last 30 years where stock market volatility is at a similar level, including 2007 and 1994.
Some would argue it implies an increasing level of volatility will be due in 2024.
What is the VIX?
The CBOE Volatility Index, is a real-time market index representing the market's expectations for volatility over the coming 30 days. Investors often refer to the VIX as the "fear index" or "fear gauge" because it is one of the most recognized measures of market volatility.
Here's a breakdown of what the VIX represents:
Volatility Measurement:
The VIX measures the stock market's expectation of volatility based on S&P 500 index options. It is calculated using the bid and ask prices of S&P 500 index options.
Forward-Looking: Unlike many market metrics that look at past performance, the VIX is forward-looking. It provides a 30-day forward projection of volatility.
Market Sentiment Indicator: A high VIX value indicates that traders expect significant changes (volatility) in stock prices, which is often associated with market uncertainty or fear. Conversely, a low VIX suggests low expected volatility and is often associated with market stability.
Not a Direct Stock Market Indicator : It's important to note that the VIX does not measure the direction of stock market movements. Instead, it measures how much the market is expected to fluctuate, regardless of the direction.
Use in Investment Strategies: Some investors use the VIX to help in making decisions about market timing. For example, a high VIX might suggest a market turning point, leading some to consider it a good time to buy, while others might see it as a signal to sell.
VIX Derivatives: There are various financial products, such as VIX futures and options, that allow investors to trade based on their views of future market volatility.
Risk Management Tool: For portfolio managers and sophisticated investors, the VIX can be a tool to hedge against market volatility or to take a position on future volatility.
In summary, the VIX is a key measure of market expectations of near-term volatility conveyed by S&P 500 stock index option prices. It has become a crucial tool in financial markets for hedging, trading, and investment strategy formulation

VIX Sniper Butterfly the detail is shown in the above Idea.
I made this Idea based on Candlestick Analysis and Harmonic pattern using Fibonacci tools.
ViX makes a really pretty Butterfly
XB: 0.78 . XD :1.27
Good Luck

VIX MOONSHOTA little bird told me this, but birds aren't real, and pigeons are liars so take it for what it is worth.

VIX New Low is Probably Bullish for StocksOn 12/08/23 the VIX made a new low in its decline from the high in early 2022.
The vast majority of the time the SPX will make its ultimate top with a VIX at a higher bottom.
Please note what happened in early 2022. This is just one example of several VIX bottoming divergences over a period of many years. The VIX is very effective at catching important SPX tops.
There's a high probabilty the SPX could continue higher until at least late December/early January 2024.
2024 Election Market Whoa2024 Election Cause Spike in VIX
Just like years prior the election will cause some instability in markets.
Green line displays ranging estimation from earlier in the year.
Red line drawn as as estimation with more data at the start of the line
Yellow Line including election instability.

The VIX will be up 8% soon. 1. Higher Than Expected NFP Report: If the Non-Farm Payrolls (NFP) report is higher than expected, indicating strong job growth, it could lead to increased market optimism. Paradoxically, this positive news might also cause concern among investors. They might worry that a robust job market could prompt the Federal Reserve to raise interest rates to prevent the economy from overheating. Higher interest rates can make borrowing more expensive for companies, potentially affecting corporate profits and slowing down economic growth. This uncertainty can lead to higher market volatility, causing the VIX to increase.
2. Apple's Declining Sales: If Apple reports a 3% drop in sales after close, it could negatively impact investor confidence in the technology sector and the overall market. Apple is a significant component of major stock indices like the S&P 500 and NASDAQ. A decline in Apple's sales could lead investors to reevaluate their portfolios and adopt a more cautious approach, contributing to market uncertainty and potentially increasing the VIX.
3. Current Daily Support Level and Fibonacci Retracement: Technical analysis suggests that the market is currently at a daily support level and below the 61.8% Fibonacci retracement level in the weekly price range. Traders often pay attention to these levels as potential turning points in the market. If the market breaches these support levels, it could trigger selling pressure and increase market volatility, reflected in a higher VIX.
In summary, a combination of a strong NFP report, Apple's declining sales, and technical factors indicating a potential market reversal could lead to increased uncertainty and higher market volatility, causing the VIX to rise. Investors tend to react to unexpected news and technical levels, which can influence market sentiment and impact the VIX accordingly.

VIX ScenariosWhat do you think?
History Does Not Repeat Itself, But It Rhymes
-interest rates are about to decline
-VIX options P/C ratio of December is about 0.5
-technically we are at top (spy)
8,12,13 of December market will decide.

VIX Will Move Higher! Long!
Here is our detailed technical review for VIX.
Time Frame: 1D
Current Trend: Bullish
Sentiment: Oversold (based on 7-period RSI)
Forecast: Bullish
The market is on a crucial zone of demand 12.66.
The oversold market condition in a combination with key structure gives us a relatively strong bullish signal with goal 16.01 level.
P.S
Overbought describes a period of time where there has been a significant and consistent upward move in price over a period of time without much pullback.
Like and subscribe and comment my ideas if you enjoy them!

Making Sense of the VIXWhat is the VIX and why is it relevant to investors?
The Volatility Index, known as the VIX or FEAR index, helps measure how much the stock market might swing in the future. It looks at options prices on the S&P 500, hinting at how investors feel and what they expect in the market.
1. Checking Risk:
The VIX tells us how unsure or risky the market might be. A high VIX means more ups and downs, suggesting possible market drops or significant price changes. Traders and investors use this to see how much risk they take and adjust their plans.
2. Protecting Investments:
Large investors use the VIX to make plans that protect their investments. When the VIX is high, they might buy certain types of contracts to reduce potential losses if the market drops.
3. Deciding When to Buy or Sell:
Some people use the VIX to decide when it’s an excellent time to jump into or out of the market. If the VIX is high, it could be a chance to buy stocks at lower prices. If it’s low, it might mean the market is too high and could go down soon.
4. Trading on Volatility:
Some traders focus on the ups and downs of the VIX itself. They use special contracts tied to the VIX to try and make money from short-term changes in its level.
5. Contrarian Investing:
Contrarian investors often take positions opposite to the prevailing market sentiment. If most investors are optimistic and buying, contrarians may be more inclined to sell or short the asset. Conversely, if most investors are pessimistic and selling, contrarians may see it as an opportunity to buy. Successful contrarian investing requires patience and discipline.
In simple terms, the VIX is like a weather forecast for the stock market. It helps investors know if it will be calm or stormy so they can plan accordingly.
What is the VIX telling us now?
The global geopolitical lanscape has been deteriorating steadily over the past few years and the Volatility Index has collapsed to its pre- Covid price level. That’s what we call a bargain.

The VIX is showing a monthly buy signalTVC:VIX
The VIX is showing a monthly buy signal. Historically, volatility increases by around 275% from the low within 1-3 months of the signal. Long volatility here.

$VIX under support but holding tight, for nowTVC:VIX is trading under the "13" support level.
The 12 area has not been touch & there's a struggle trading above 13 again.
Let's dissect shorter term, 1Hr (not here, see profile)
There's slight positive divergence being formed.
However, it is way to early to say #VIX will reverse here.
CBOE:SPX closed STRONG on Friday and the #SPX500 had the highest in 2023.
AMEX:SPY

WARRING: Marco market conditions change incoming #SP500 $BTC CBOE Volatility Index has been used by investors for decades to identify macro market transitions.
This is 1 Year analysis of TVC:VIX in conjunctions with market developments.
1. 28th Sep '22 is the date TVC:VIX signalled oversold conditions on #SP500 where price double-bottomed and commenced this bullish wave we are living through
2. 9th of March '23 TVC:VIX signalled heavy market oversold conditions and #SP500 completed the first significant correction
3. 20th Oct '23 TVC:VIX signalled another #SP500 oversold condition triggering another continuation
At this stage is important to consider a important market rule "The Power of 3"; - TVC:VIX has topped 3 times now suggesting this intermediate bullish wave is coming to an end.
Now turn your attention to 22nd Jan '22 where TVC:VIX for a fist time dropped back to COVID-lows.
It had since repeatedly touched and rejected of these levels suggesting of bottom formation.
At the same time TVC:VIX signalled first significant market overbought condition very close to what it seems the bottom and shortly after forming 3rd oversold peak.
Traditionally CRYPTOCAP:BTC had front-run #SP500 and would expect crypto market to take downard turn before traditional markets which can serve as a final confirmation of an upcoming winter.

AMZN bullish uptrend has begun.Clear move to the upside. It's broken the previous resistance and looking to make new highs on volume.

The odds of another spike in the VIX are growingOn Friday, the Volatility S&P 500 Index reached new lows unseen since January 2020. What is intriguing about this situation is that new lows in the value of the VIX tended to be followed by a subsequent spike in the index and weakness in the U.S. stock market (over the past year or so). Considering that the recovery of the Chinese stock market is starting to show signs of stagnation, with the Shanghai Composite Index and Hang Seng Index moving increasingly sideways, we are again on high alert. The odds of stock market reversal and spike in the VIX are growing.
Illustration 1.01
Illustration 1.01 displays the daily chart of the Shanghai Composite Index, Hang Seng Index, and S&P 500 Index.
Please feel free to express your ideas and thoughts in the comment section.
DISCLAIMER: This analysis is not intended to encourage any buying or selling of any particular securities. Furthermore, it should not be a basis for an individual investor to take any trade action. Therefore, your own due diligence is highly advised before entering a trade.

Decoding the VIX: Unraveling Market Sentiment in 2023's LowThis week, we've observed some intriguing movements in the VIX index, revealing key insights about the current state of market volatility. The VIX, often referred to as the market's 'fear gauge', achieved a new low for 2023, signaling a period of reduced market anxiety and volatility. This trend is especially noteworthy as the VIX typically inversely correlates with market performance, and its current levels are the lowest observed in four years.
Historically, such low levels in the VIX have at times preceded market downturns, as seen in the past following significant events like the Silicon Valley Bank failure. This pattern suggests a potential caution for traders despite the current calm in the market.

$VIX could be flashing BULL!TVC:VIX is almost @ the MAJOR SUPPORT level we have spoken about many times.
IF this 12 area is broken it has a history of going as low as 10.
Sub 10 = R A R E!
Pulling back to this area after a high VIX, then normalizing to a low #VIX, it has signified a GOOD CBOE:SPX RUN.
After some time, shortest span was 2 years, the VIX eventually trades higher & #stocks have an eventual crash.
