Bearish Outlook for VX1!Bearish Post Description for TradingView
Title: Bearish Outlook on VIX Futures - Time to Brace for a Pullback!
Hey traders, take a look at this VIX Futures chart (CBOE Volatility Index - VX1 Futures) published by FairValueBuffet on TradingView (Mar 10, 2025, 20:58 UTC). The technicals are screaming caution, and here’s why:
- Supply/Demand Zone Breakdown: We’ve hit a critical supply zone (highlighted in yellow) with a sharp spike, suggesting heavy selling pressure. The price action is showing rejection at this level, hinting at a potential reversal.
- Moving Averages: The 18-week and 52-week SMAs are converging, with the price breaking below the shorter-term SMA, reinforcing bearish momentum.
- Bearish Divergence: The RSI and Williams %R at the bottom show clear bearish divergence. Despite a price spike, the momentum indicators are declining, indicating weakening bullish strength.
- Seasonality Indicator: The bottom-right seasonality chart (COT data for VX Futures) shows a historical tendency for volatility spikes around this time, often followed by a correction.
With the VIX jumping to 24.700 and a volume of 137.66K, coupled with the bearish technical setup, I’m anticipating a pullback in the near term. Keep an eye on the 20.000 support level—failure to hold could see us testing lower grounds. Let’s stay cautious and consider short opportunities or hedging strategies!
---
CBOE:VX1! CME_MINI:ES1! AMEX:SPY
Bullish Case for S&P 500 - Fundamental Perspective
While the VIX chart suggests short-term volatility, the broader S&P 500 presents a compelling bullish case based on fundamentals as of March 10, 2025. Here’s why we might see upside potential:
- Economic Resilience: Recent data points to robust corporate earnings growth, with many S&P 500 companies exceeding Q4 2024 expectations. This earnings strength supports a sustained rally.
- Interest Rate Outlook: The Federal Reserve has signaled a dovish stance, with potential rate cuts on the horizon. Lower interest rates typically boost equity valuations, especially for growth stocks in the S&P 500.
- Gold and Bonds Correlation: The chart shows a dip in gold prices and bond yields stabilizing, which historically correlates with risk-on sentiment. This could drive capital back into equities, favoring the S&P 500.
- Market Sentiment: Despite short-term volatility (as seen in the VIX), investor confidence remains high, supported by strong consumer spending and improving global trade conditions.
Given these fundamentals, the S&P 500 could be poised for a bullish run, especially if volatility subsides and the 18-week SMA on the VIX chart starts to flatten. Consider long positions or adding exposure if the market holds key support levels. Stay tuned for confirmation!
---
Note: This analysis is based on the provided chart and my knowledge up to March 10, 2025. For the latest updates or to validate these trends, I can perform a web search or analyze additional X posts if requested!
Not Financial Advice
VXMX2024 trade ideas

Top 5 Weekly Trade Ideas #5 - VX Trend BreakVX tried to breakout recently, but just couldn't do it. Looks like a triple top at 18.50 and we also have an uptrend break to the downside. Watching for another move down to the 16-15.80 area, that will be critical.
If it can reclaim the uptrend, upside target is still 18.50 until it breaks. Pretty large range from 18.50 - 15.80 as volatility has picked up so don't want to get baited by a quick move. Will look for confirmation above or below the range, but for now VX is collapsing again.

Top 5 Weekly Trade Ideas #4 - VX BreakoutLooks like the market is preparing for some volatility heading into FOMC, which is not something not we've been seeing as of late. We could be due for a sharp correction if this continues, but of course it could also just be some hedging and might not amount to anything.
Pretty good looking chart, nice bounce off the low at 15.80, but for now it is still in the range from 15.80 - 16.80. Given the inverse H&S + channel break and bounce at 15.80 I'd expect more upside in the short term, but it has to clear 16.80 first. If it does and keeps going, look out below on ES.

VX hit 20VX:
Daily:
-broke a downtrend in momentum
Weekly: (will publish separately)
-hit the uptrend line and bounced away
ES: breaking down
YM: breaking down
NQ: also large candle though support PA and rsi not broken yet
it would be nice to get a bounce in the indices and pullback in the vx, but thats hard to tell with so many trend violations today. could see bounce, or just sideways hold before the next drop
Notes:
--yield curve no longer inverted; reverted this week
--there have been a few one-day-wonder pulbacks in the market lately with a MM revival the following day; this feels different...

VX Channel BreakVX is starting to look a little more lively after today. It has held the major low around 15.80 several times and has an inverse H&S. That combined with the descending channel breakout could spark a quick rally up to 16.80. Getting a little more cautious with longs now but bullish structure on pretty much everything else important remains.
Short version - range is between 16.80 and 15.80. Neutral until the range is broken.

VX Channel BreakVX has just broken above its ascending channel, just barely. Definitely could go either way still. Today was a little unusual with VX and stocks rising together. Could just be some hedging before Powell or something, but normally this type of action leads to a sell off in equities after. Hard to say how big of one, especially in these conditions.
VX has resistance above and I wouldn't be super bullish on it until it reclaims 15.25, but there's room for at least some upside and I'd expect more momentum if it does reclaim 15.25. Important to watch.

VX Coming Back to LifeToday's opening 15 minutes was one of the more wild ones I've seen. It's been a wild week in general. Every single morning we have been hit with war fear news right at open. Each one led to a big VX spike and near instant recovery. You can see the huge spikes every morning, starting with last Friday.
What I think is important here is that it has came right back up every time. Despite getting sold off after every rip, it ends up higher a few days later. This is a big change from what we've seen this year. VX has not been able to sustain any moves up whatsoever. I'm seeing a lot of potential strength being built up. We have another descending bullish wedge formation, this one is more of a broadening wedge.
We'll see if this time is any different. Looking for a move up to 18.40 or back down to 15.25. All of these dips on SPY getting bought could very well lead to more upside and squeezes. My intuition tells me this has not been normal action and the market is preparing for a big move after whip sawing back and forth all week. a VX breakout would confirm that will be a move to the downside, especially if SPY falls below $585 at the same time.

VX Bull FlagVX has broken above 17 and is trying to sustain above. Looks like some bullish consolidation on the 15m, I'm expecting a break up to 18.40. That would likely lead to a new session low and more downside for ES. Opposite happens if it falls back below 17.

Top 5 Weekly Trade Ideas #1 - VX Falling WedgeWill be watching this wedge on VX throughout the week for directional bias on SPY. VX is near the top end now trying to break. If it does break up, first target is 16.60 followed by ~17. To the downside, it has critical support around 15.25, we could see another big leg up for SPY if it breaks below and continues falling.
Will be cautious with longs if VX breaks out, but if it continues getting crushed it'll be back to risk on mode after a brief pause late last week. This chart alone should provide a lot of valuable info, especially when you combine it with SPY.

VX Coiling Before CPI VX looks primed for a move up to 16.60 after a descending channel breakout and retest. Makes me wonder if CPI is about to come in hot or have a negative reaction. We'll find out soon enough. 16.60 will be key for VX to get above and stay above for bears to have a day.
I'll have bearish bias until VX falls back below 16. Ideally we'd get a long opportunity on SPY when VX hits 16.60. Will look for SPY puts instead if VX sustains above 16.60.

VX Paths Before FOMCLooks like we'll have a pretty good setup with VX during or after FOMC. We'll probably get some volatile movements after the minutes release and then more volatility during and after Powell's speech starting 30 minutes later.
VX has been getting crushed all week, back below 16 now. This will be a key watch during the volatility. I could see it spiking up to 16 and failing. If we get an initial sell off, you could look for longs when VX hits 16, stop above. Other scenario is VX doesn't rally at all and goes straight down even more which would spark yet another rally for SPY.
Downside target = ~14.75
First upside target = 16.60
VX below 16 = Bullish SPY
VX above 16 = Bearish SPY

Top 5 Weekly Trade Ideas #3 - VX Risk On?VX has had a hard rejection off of the 21 area. It failed to breakout of its bull flag and instead fell all the way back below support around 18.40. Two massive red days in a row for VX leading into the election results and FOMC. The market is seemingly going full risk on mode heading into the election. That typically means we're going to rocket in my experience, but also leaves the door open for extreme volatility if the market gets a surprise.
Having said all that, this 18.40-18.20 area is critical for rest of the week and it makes things fairly simple. Final downside target for VX would be around 16.45.
VX below 18.40 = Bullish for SPY
VX above 18.40 = Bearish for SPY

VIX!!!HS, the VIX is about to crash. I'm accumulating SDIX (short VIX) and buying puts of UVXY at every short term rally. SP500 heading to ATH.

Top 5 Weekly Trade Ideas #5 - VX Critical SupportTo wrap up the ideas for this week I have to choose VX, I don't trade it directly but it will be key to determine the direction for the rest of the week. So far it has held around 18.40, which was also last week's low. In addition to the 18.40 support here we also have trendline support. First upside target would be around 18.90 and then 19.40.
Last week's low is one of the most critical things in the market right now for this week if you ask me. If VX ends up failing here, we will most likely see the melt up continue and gain momentum. Otherwise we may chop around if VX holds the range, if it happens to break above 19.40 that's when it comes time to be bearish on ES.

Top 5 Weekly Trade Ideas #4 - VX S/R FlipBig move up for VX after bouncing near 18.40. This is mostly due to some weakness in semis after leaked earnings on ASML. 19.40 will be a key area on VX moving forward. If it goes up there and fails I'd be looking for longs on ES/SPY. If it's able to break above and continue higher, I'll start looking for shorts.
Overall, the range is from 19.40 - 18.40 so I'm looking for the top end of the range to fail or a breakout above if it doesn't hold.

VX Ascending ChannelVX has shown a lot of strength over the last couple of weeks which I consider to be unusual. DXY and treasury yields have also spiked recently, but the equity market remains resilient. We've been chopping for weeks and we'll likely see a big move once this range breaks.
VX had a big red day today after rejecting a previous high. This is what VX would normally do when stocks are rallying, but that hasn't been the case until today. VX dropped today, but it's still way too high. This is a large divergence that has been building for weeks.
We should see some fireworks soon, maybe after CPI but who knows. If this recent VX strength results in a failure then it has a long way to fall and we may be back to full risk on mode for a while. It will be an important watch. I'd be concerned watching treasury yields and VX climb along with stocks if I were a bull. but we'll see.

Using VIX futures to manage equity risk over the US Election One-way traders can look at expected volatility and movement in the S&P500 over the US election volatility is by looking at the premium or the differential that VIX October futures hold over VIX November futures.
Because the VIX index takes in a series of S&P500 options strikes that blend to create a 30-day implied volatility, the October VIX futures essentially looks at S&P500 volatility over the November US election.
Therefore, the higher the premium for VIX October futures over November futures, the greater demand for volatility over the election and the greater the implied movement in US equity markets.
This can be useful for traders who look at event risk and consider the propensity and extent of movement, and whether they want to hold exposures over that risk.
The code in TradingView to use is - VXV2024-CBOE:VXX2024

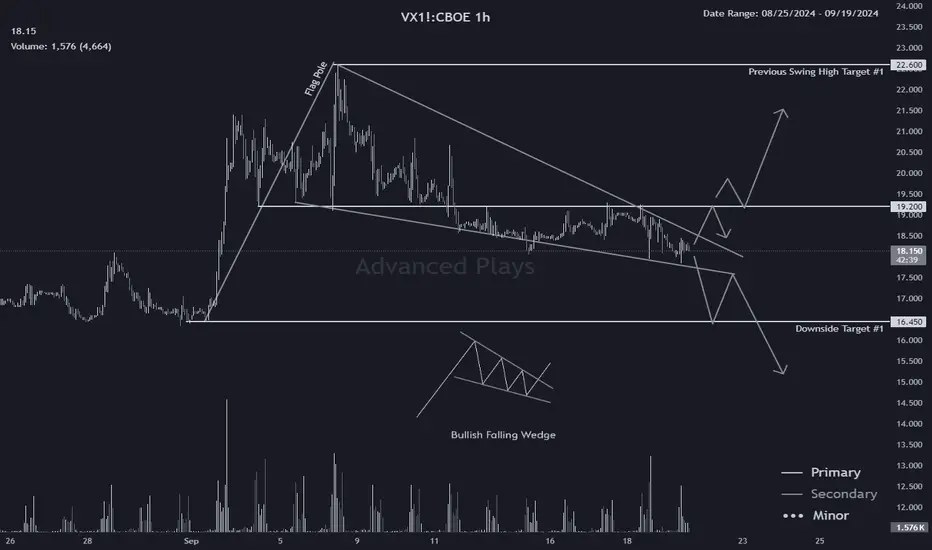
Top 5 Weekly Trade Ideas #1 - VX Falling WedgeI posted a similar chart last week, but as I'm looking at things after today's action I still think this is the most important thing in the market right now so it's going at #1 even if I don't plan to trade it directly. I wouldn't recommend trading VIX or UVXY, maybe VX futures but that's not for me.
Instead, I used the VX futures to determine direction on ES. This will make things very simple if we actually move this week unlike today. VX has been hanging around even throughout the recent rally to ATH. I think this is noteworthy, but still need confirmation it's going to continue to stick around and potentially gain strength.
This pattern gives us the confirmation we need, it should tell all. If we get the upside break and it can take out the 19.20 level, I would expect it to continue up to at least 22.60. That's the recent swing high and is also just below the flag pole target. If VX fails and falls below the wedge, that would also mean it broke below 16.45, which is the line in the sand. If VX can't hold there, it's time for more risk on.
TLDR:
VX below 19.20 = bullish for ES
VX below 16.45 = really bullish for ES
VX above 19.20 = bearish for ES
VX above 22.60 = really bearish for ES

Using VX to Spot Divergences + Intraweek UpdateWe've had some great examples of clear VX divergences lately so I wanted to highlight that here. VX is a key component of my strategy and I don't believe it is used enough by most traders. It'll be important to monitor moving forward as we see rising volatility and global tensions. I also go over the most important levels and watches for the remainder of the week.
Maybe it's another short lived sell off, but I believe there's going to be a point where perma bulls buying every dip are going to wish they hadn't. We'll see, if VX explodes over 22.60 this week I'd be very careful on either side. Expect big ranges until VX falls back down. Money can be made very quickly in a market like this if you learn how to use spot key levels on the major indexes and VX. It doesn't come without risk, but remember you don't have to know where price is headed next to make money.

VX Bull Flag RetestWe had another very large VX divergence this morning after VX broke out of its bull flag and soared above 19.20. However, ES remained flat and VX came all the way back.
Now is the critical retest of both the bull flag and 19.20. If it doesn't hold id expect a squeeze on ES, but this is a great spot to enter short ES.or SPY and stop out if VX can't hold.
Remember the simple analysis for this week was:
VX above 19.20 and QQQ below 485 = bearish.

Huge VX DivergenceMassive divergence this morning between ES/NQ and VX. Makes me thing this little rslly.is about to be erased. I'd be careful on either side, looks like we're finally gonna start moving.
Next upside target for.VX is 19.20 assuming it doesn't stall out here around 18.20. Important to watch.

VX Falling WedgeI was watching the 19.20 level before FOMC and VX didn't even get close. However, it is holding up better than I'd expect on a day like today. It has been pretty flat lately rather than only going down like in the summer.
It has a falling wedge that may lead to a big breakout and test of the 19.20 area. QQQ is at some pretty important resistance so given that it's rejecting there and VX is doing this I would be cautious longing here. I'd be cautious about chasing a move like this in general anyway.
If we see VX break below this wedge, I'd expect more upside for equities and for VX to go back down to 16.45. That would be a good spot to consider taking profit on longs if that plays out. If it does breakout to the upside, look out below.
VX Paths Ahead of FOMCVX will be very important to monitor during today's volatility. For a basic short term view, I think this chart will work well. For the center line in the sand we have the 19.20 level. We also have some shorter term trendlines along with some more major support and resistance.
So we can just look for VX to break or come into these areas. For now, if VX remains below 19.20 and has a trend break to the downside, I'd expect bullish action on equities and for VX to head back to 16.45. Otherwise if VX can reclaim 19.20 and sustain a breakout, I'd expect it to hit the 22.60 area.
Major resistance: 22.60
Major support: 16.45
Middle: 19.20
