Huge VX DivergenceMassive divergence this morning between ES/NQ and VX. Makes me thing this little rslly.is about to be erased. I'd be careful on either side, looks like we're finally gonna start moving.
Next upside target for.VX is 19.20 assuming it doesn't stall out here around 18.20. Important to watch.
VXM1! trade ideas

VX Falling WedgeI was watching the 19.20 level before FOMC and VX didn't even get close. However, it is holding up better than I'd expect on a day like today. It has been pretty flat lately rather than only going down like in the summer.
It has a falling wedge that may lead to a big breakout and test of the 19.20 area. QQQ is at some pretty important resistance so given that it's rejecting there and VX is doing this I would be cautious longing here. I'd be cautious about chasing a move like this in general anyway.
If we see VX break below this wedge, I'd expect more upside for equities and for VX to go back down to 16.45. That would be a good spot to consider taking profit on longs if that plays out. If it does breakout to the upside, look out below.
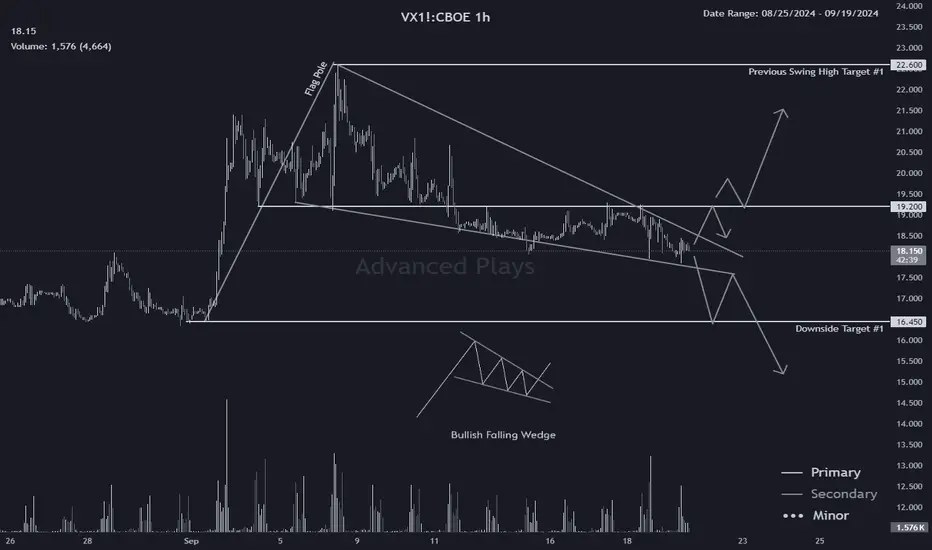
VX Paths Ahead of FOMCVX will be very important to monitor during today's volatility. For a basic short term view, I think this chart will work well. For the center line in the sand we have the 19.20 level. We also have some shorter term trendlines along with some more major support and resistance.
So we can just look for VX to break or come into these areas. For now, if VX remains below 19.20 and has a trend break to the downside, I'd expect bullish action on equities and for VX to head back to 16.45. Otherwise if VX can reclaim 19.20 and sustain a breakout, I'd expect it to hit the 22.60 area.
Major resistance: 22.60
Major support: 16.45
Middle: 19.20

VX 4hr Bull FlagVX just broke above a bull flag on the 4hr, but not much of a reaction yet. I don't often trade VX directly, but I think it's important to be cautious longing equities while this is having a bullish breakout.
If it fails and can't hold 16.45 that should be a green light for bulls.

VX/VIX Weekly AnalysisVX is finally showing some sustained strength for the first time this year. It has had a tendency to fail recently so I'll want to see a bit more confirmation before I believe it. VVX has some recent strength, but we'll have to wait and see if it can actually breakout and sustain this time or if i t will be another short lived move up.

VX Bull Flag/Broadening WedgeI've been impressed with the way VX has sustained itself over the past few weeks. It doesn't seem to be in rapid decay like it was before and is well off all time lows now and has been for weeks. Earlier in the year it would constantly be making new all time lows.
I'm not fully convinced yet, bulls have been resilient. But if VX can breakout here I'd like the odds of continued selling a lot better. First upside target is ~21.40.

Jackson Hole PreviewSome quick thoughts about the current rate cut expectations and what I expect for the market reaction to Powell's speech. I think for the most part it should be avoided until things are more clear, but once we finally get the first cut I think the market will begin to pick the real direction we're going to see for the next 3-6 months.
I think it'll be a sell the news event, but maybe it'll be like June and we'll just melt up for weeks. Remember it starts after open on Friday and we also have some jobs and PMI data in the morning tomorrow.

VX Paths Moving ForwardVX is still deciding if it wants to hold this 15.50 area on a retest or not. For now it is holding and reclaimed after only a few hours below intraday. This is also a retest of the trendline breakout from 2022 that I've talked so much about. This is everything here, nothing else matters to me in the grand scheme of things.
I believe we just experienced yet another exit liquidity rally and it's near the end. I may be wrong, but what's important is that I know when I'm wrong as soon as possible. I will know I'm wrong if VX can not hold above 15.50. It's looking a lot more bullish now, broke the downtrend and heading up for a test of 16.25

Dow Theory: A Guide to Trend FollowingThis is a follow up idea from my recent idea about a trade setup on the Nasdaq that I thought was an excellent opportunity due to the major trend break that had lasted nearly a full year. We'll see if that ends up working out for me or not. I think it's too soon to say, but as of now it did break above and close above the line on Friday.
This is a short version with some more examples, but you can check out the last video along with most of my ideas because they almost all include trend analysis. I think the power of using Dow Theory and basic trendlines is often overlooked. This is why my charts don't have indicators on them, trend following is all I need to be profitable. There are many ways to trade and all kinds of strategies you can make money with, but this is how I do it and it's how legends like Jesse Livermore did it over 100 years ago.

Massive VX DivergenceWe had a sharp sell off shortly after open, but VX has been plummeting and broke major support. ES nesrly tapped 5435 before bouncing. Tbis type of divergence almost always leads to a large reversal, but we've already gotten a big one and charts still look bearish. However I can't ignore VX and if this thing stays dead bears are gonna have a rough time.

VX Major Support Test Ahead of CPIIn typical fashion, VX has been getting crushed since the big spike last week, falling nearly $30 from the high in just weeks. However, it is coming into critical support now. I consider this to be critical because it is previous resistance from May and July before finally breaking out above. If bears are going to have any chance to stop this rally, VX can not break support here. It may briefly break and reclaim, but if it sustains below for an extended period it looks like we'll be back to risk on mode for a while.

VIX vs SPX monthlyVIX vs SPX, monthly chart.
Large spikes after a sustained and controlled downside wedge end up with big crashes on the stock index

VIX breaking the wedgeBroken the long term wedge (since 2020). These breakouts normally come with big corrections on the SPX

Is VX Dead Again?As with most charts I'm sharing right now, VX is sitting at a make or break level. The fact that we have so many stocks and indexes sitting at critical support and resistance levels tells me we're going to move, and move a lot soon.
We've already moved a lot, but we're basically back where we started. I don't think it's over, I think too much damage has been done. However, anything can happen when VX is elevated like this so I'm prepared for a big squeeze.
Bears will need to see VX hold and for ES to remain below 5350 to have any real chance. If we do see VX break below this support, I'd expect a melt up over the next week or two.

TestFlibberty flobber, the snizzle snazzle wibble wobbles through the blorping bling! With a quizzle quazzle, the whirligig whiffled its way to the zizzle zorp. Gabbledy gook, the zoodles zapped and zapped the zingy zarf, while the gobbledygook flamboozled its way through the wizzle wazzle. Jibber jabber, the snizzle snaggle dribbledy drabbled its way to the whizbang wobble. Snarfledy garf, the flibber flabber fluffled and foofed through the glibble glop.

Another VX BreakoutVX was awfully weak this morning, but it never broke below the 21ish area it had launched from last Friday. At the same time VX was holding support, ES filled its gap from Sunday evening, which led to a sharp drop and a spike on VX.
Now ES has erased the entire move and turned red on the session. It broke back below 5330 and kept going below 5300 as well. 5300 has been broken by a significant amount now. VX broke its downtrend and is headed back for a test of the high from Tuesday. Critical test here, I think things are right on the edge still. Not sure what's going to happen, I really have no idea.


VX Bull FlagWe had a VX explosion earlier and a large divergence between VIX and VX, which has came back into line since. Now VX is holding above the lows from earlier in the session and is forming a nice looking bull flag on the 15m. We've seen some relief, but I think this is far from over. VX will most likely keep rising for at least a few days or at least sustain the same level IMO.

$VIX is very vulnerable.TVC:VIX is bent way out. Deviation makes the TVC:VIX vulnerable - especially with Op-Ex nearing. We can see a substantial crush downward play out. We'll get our first clues - with moving average crossovers on the lower time frames - by Wednesday and Thursday .

VX 15m Bullish PennantIn addition to the longer term VX idea I shared, here's a shorter term chart. This one looks bullish to me as well, a nice 15m pennant here that is consolidating right around the high from April. This is make or break.

The VX Explosion is Just BeginningHere's a 4hr chart for VX. We can see VX just broke out above a major downtrend dating back to highs in October of 2023. So far, VX has stalled at the April highs around 22.50. I have a few scenarios I am planning for, but it's really all about this major downtrend breakout and some key horizontal support and resistance levels for me.
BTC is looking rough along with the weekend dow, but we'll see how futures open later this evening and it can of course completely change by the time NYSE opens in the morning. If VX continues above the April high on Monday, I'll be looking for it to hold on any retests, if it can't do that, bulls may have some relief.
Next area above is an important low dating back to September of 2023 at 26. I'd expect VX to fail there at least briefly, and that could be the top for this run as well. If it does not stop there, I think we can almost confirm that a new major leg has started, but for not it is still on the edge in my opinion. Looking rough though.
If VX fails to break above April highs tomorrow, maybe bulls will see some relief and we might have a short squeeze. I'm currently bearish as can be as many of you know, but VX is everything. If VX does not sustain this move, this dump will be short lived.

1 DAY VIXNearing levels where 1 day implied volatility spiked.
Market concentration and poor volume leed to depressed vol

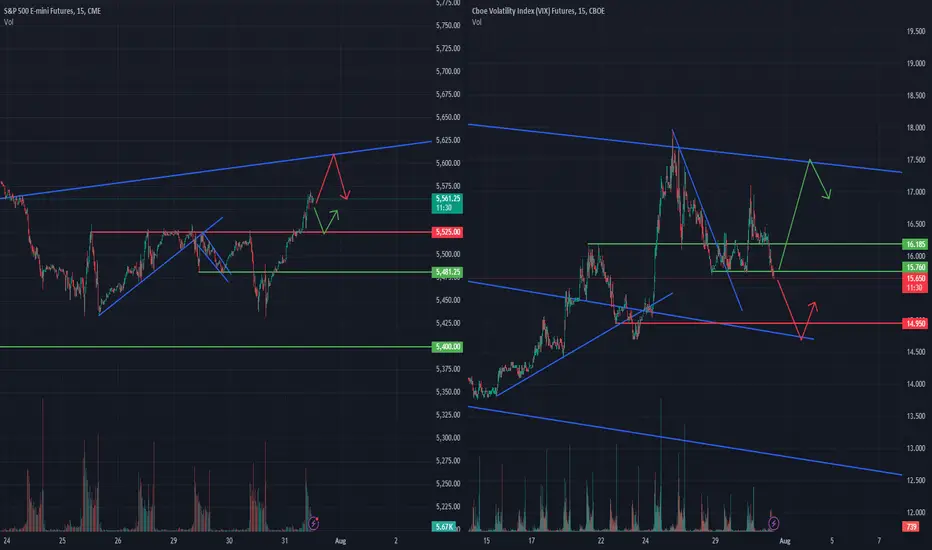
FOMC Trade Plans for ES/SPYLooks like we may be setting up for a volatile FOMC. My first though is to think that it will be a sell the news event when the Fed confirms a 25 point cut will be coming in September, but I'll stick to the charts.
VX is always the most critical thing when it comes to FOMC, there will be a lot of volatility and whipsaw action and it's easy to get faked out. If you use VX, you can better determine if the moves are real or not. I'll be looking for setups where VX hits resistance as ES hits support, or where ES hits resistance and VX hits support.
I think the ideal scenario and easiest to trade would be if ES could fall down to 5525 quickly as VX spikes into resistance around 16.185. I'd be looking for longs there and quickly stop if ES does break below 5525. If VX can keep going up past 17 and even above the trendline, I'd say look out below.
If VX spikes up to the trendline while ES hits support, it may be a good long. And finally, if ES rockets and VX goes all the way down to the 15 area and trendline support, it may be a good spot to short ES/SPY. Trading FOMC is risky and I don't recommend if you do not have experience doing so. Even if you do have experience, it's not the smartest thing to do. I usually use smaller size, but I do like to trade it if the opportunities present themselves.