Death of VXVX is near all time lows, had a nice rejection today off the 14.05 level which has sparked a rally. I wouldn't want to be shorting SPY or anything else until this gains some more strength. It had been slowly grinding down in a stair stepping manner which usually means it's going to continue.
VXM1! trade ideas

VX WeaknessThere's a lot of bears out there right now calling for a crash, and I thought we'd have continued downside as well after seeing VX break out of its major downtrend it has been in since 2022. However, in classic fashion VX hard failed within a few days and ES has already recovered a lot of the losses within a few weeks.
VX has continued to weaken since the market bottomed. There will be no sell off unless VX becomes strong again, it's just a fact. I'll need to see VX above 14.45 to consider being bearish now. I expect all rallies on it to be sold until it breaks this downtrend. Zoom out for longer term levels and trends.


This is why the markets will not crash in the near futureFirst things first: This is about the longer-term direction of the market. We're not advising against short positions here. In the short and medium term, they can lead to significant profits. However, given the seemingly fragile nature of the current markets, I'd like to point out the COT (Commitment of Traders) data and the corresponding levels in the Volatility Index (VIX). Here we have a weekly chart. The blue line represents the positions of the Commercials in the VIX. We can see that this line reached significant peaks just before the markets collapsed significantly, by 15% or more. Particularly notable are the extreme levels in November 2019, just weeks before the markets collapsed due to the COVID-19 pandemic. Often, the net long positions of the Commercials rise to these extreme levels, and the decline in stock indices occurs several weeks, sometimes a few months later. What does this mean for the current situation? Looking at the net long positions of the Commercials in the VIX, we can see that we are very, very far from extreme levels that would make a significant downturn likely. Therefore, it remains true: The Trend is Your Friend. And the trend continues to point upwards.

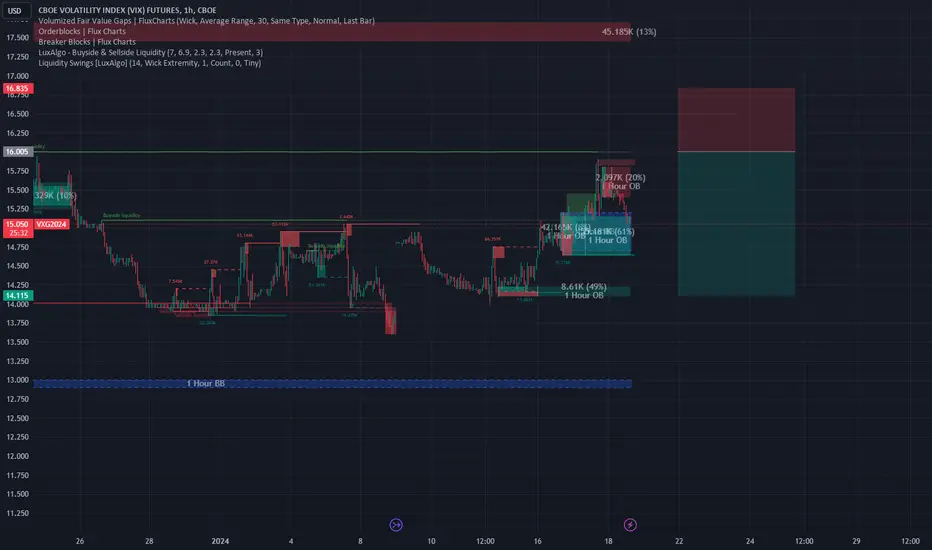
VIX (MARCH) --> Friday overshoot?Trade for 11th March (Mon) - 12th March (Tue)
UX1 went a bit of overshoot with Tech sold off, which also influenced by the weekly Option expiration (rather than Non-farm). However, there is no indication on fear in the market. Our model suggested it will still go compressing till Tuesday (post CPI data)
Entry price reference: 15.2 or higher (this is not at Open)
UX1 Indicative range: Low - High 14.5 - 16 (spread 0.7 - 1)
Stop loss: 15.7 post CPI data release on Tuesday
Profit take: 14.5

VIX (MARCH) --> In defense mode now?Trade for 4th March (Mon) - 5th March (Tue)
With such a hot market in place (still very strong momentum), even though spot vs UX1 has built a big gap on friday and in long run there is no sign of "fear" yet. However the contradict move for UX1 March on Friday indicate a long VIX model signal.
Entry price reference: 14.05 or lower
UX1 Indicative range: Low - High 13.8 - 14.5 (spread 0.95 - 1.01)
Stop loss: 13.8 (30 mins post US open, basically to avoid a big compression)
Profit take: 14.35 (or let it run if VIX surged)

VIX (MARCH) --> Thurs down, Fri expecting to go up againWith PPI data release on Friday (again.. there may be a surprise as like Wednesday CPI). Model is expecting a surge on UX1 (March future).
Entry point: 14.95 or lower (watch for how Market goes on Thursday and Friday APAC/EU morning session)
Profit take: 90bps from Entry or 15.8 (whichever hit). In particular if PPI is much hotter than expected (est. 0.1% on Core PPI), then let it run further till where VVIX has hit the upper bound (use BB 20 EMA, Daily, 1 year window)
Stop loss: 14.7 (about 25bps below entry) post PPI release

VIX (FEB or MARCH) --> still indicating to go upTrade for 12th Feb 2024 - 13th Feb 2024 (Mon and Tues)
With CPI data release on Tuesday, SPX is just slightly above the 5000 threshold (subject to how long it is able to hold) and SPX Monthly Option expiration on Friday. Model is very committed with a long vix signal which led an average lift of 50+ basis pt
Any "bad" CPI data point higher than expected could trigger a negative reaction to the market
Entry price reference: 13.35 and lower (for Feb Future) OR 14.7 and lower (for March Future)
UX1 Indicative range: Low - High 13.1 - 14 (for Feb Future) OR 14.4 - 15.2 (for March Future)
Stop loss: 13.1 for Feb OR 14.4 for March (use 30 mins post US Open)
Profit take: 14 for Feb, 15.2 for March (anytime thru out the day)

VIX Futures Facing Resistance at 200-SMA with Bearish DivergenceVIX Futures are currently sitting at the 200 SMA on the 1-Hour Timeframe at Resistance with Bearish Divergence a looks to be preparing to go down to fill the gap it created on the spot market, likely after the CPI release.

VIX (FEB) - about to go up !??Trade for 8th Feb 2024
As now ES and NQ is on the high end, there is a expectation of a mini pull back at least for profit take.
Entry price reference: 13.40 or lower
UX1 Indicative range: Low - High 13.05 - 14
Stop loss: 13.2 30 mins post US open (tighter stop loss)
Profit take: 13.6 - 13.8 anytime thru out the day

VIX (FEB) - neutralAs now is in this strange pattern where ES up, Vix up, signal continue to keep as Long spread signal, also recent VIX curve move is parallel move in front 3 months (long spread help to keep risk low as no real direction in short or long vix)
Entry price reference: 1.06 or better (UX1 is 14.12)
UX1 Indicative range: Low - High 1.01 - 1.11 (UX1 is 13.8 - 14.4)
Stop loss: not set
Profit take: 1.11
Do prepare a UX1 future pop at end of month (also given FED meeting on Wed)

VIX (FEB) - still looks like there should be a bounce upThis is for Long UX1 (Feb) positioning (1 day),
Entry price reference: 14.6 or better
UX1 Indicative range: Low - High 14.3 - 15
Stop loss: 14.2 post 30 minutes of US open (i.e. post 10am)
Profit take: any time if hit 14.8
Very short stunt as ES's momentum is very hard to keep up with many earning release yet to come.
Next week
- Johnson & Johnson 23/1 Tue
- Netflix 23/1 Tue
- Tesla 24/1 Wed

VIX - First Pump, then DumpThe new year commenced with volatility in the stock markets. Currently, market nervousness appears to be subsiding, but yields for US bonds are exhibiting fluctuations. Consequently, we anticipate a further increase in the VIX to approximately 16 points.
Subsequently, a decline towards 14.12 points is anticipated, which would be considered bullish for the stock markets.
VIX (Jan) PPI potential reaction rangeThis is for Long UX1 (Jan) positioning (1 day), Entry point is 13-13.05
Today PPI is another eco driver for the week. Indicative trading range for Friday is 12.8 - 13.5.
If PPI is muted. set stop loss at 12.8 post 30 mins of US open OR profit take any time 13.3 during the day (whichever hit first)
If PPI again is hotter than expected, set profit take higher to 13.5.
VIX spot is still have a reasonable gap away from UX1 future (Jan) with Monday is also a holiday, can switch to Calendar spread (short Jan long Feb) after the Long VIX exit or by end of US hrs trading

VIX Got Rejected at Bearish Order BlockThe kickoff of the year 2024 unfolds with turbulence in the US stock markets. Consequently, the VIX opened with a gap-up. In the daily chart, it is evident that the VIX is struggling to overcome a bearish order block. Given the context of the significant gap, we anticipate a decline in volatility. This anticipated scenario is directly associated with rising stock prices, and accordingly, we maintain a bullish outlook.

Volatility may have reached a turning pointWhile more and more investors believe that a sharp price correction has already started and more and more retail traders are opening short positions on the indices, divergence indicators suggest that the VIX could fall soon.
The H2 chart shows the formation of a symmetrical triangle - a trend continuation formation when the bullish trend is in place.
The price of the VIX is currently at the upper edge.
It would be possible to take a short position or speculate on falling volatility in other assets while quickly finding an error in the analysis.

Differenz between VIX FuturesThis charts shows the difference between the VIX Future Front contract and the following contract.
If the difference is negative the front Contract is more expensive than the next following --> We have a Backwardation
Dieser Chart zeigt die Differenz zwischen dem VIX Future Front-Kontrakt und dem nachfolgenden Kontrakt.
Wenn die Differenz negativ ist, ist der Front-Kontrakt teurer als der nachfolgende --> Wir haben eine Backwardation

VIX Future and VIX ComparisonI compare the VIX Futre front contract with the following month and with the CBOE VIX Index.
Ich vergleiche den VIX-Future-Frontkontrakt mit dem Folgemonat und mit dem CBOE VIX Index.

equity bulls really getting cocky today.getting long vix for the first time in a while, dont trade it often because its spreads are wide and the interest rate over night is high. But this is true capitulation, this market has entered mania territory. absolute mania.
Buy equities because "muh ai dog pictures" at your own peril.

/ES_VIX intraday_Dynamic Higher Timeframe Fibonacci Pivot chart /ES VIX intraday_Dynamic Higher Timeframe Fibonacci Pivot Points_Regression Channel

VIX structure since 2007 - FLATLooks like ELliott wave flat from 2007. C wave seems to be forming since 2017-18. Expect more volatility going foward!

$VX Weekly 5/10 Golden Cross = 5-10% drawdownDuring '22 and each of the last 3 times the $VX 5/10 week SMA has done a 'Golden Cross' (5 week passing above 10 week) we have seen 5-10% drawdowns in S&P500 E-Minis
Will history repeat itself?

VIX is doji'ing on a very interesting spot. 🤔
I noticed last week that the VIX is just chillin on a trendline that goes back 5 or so years. It also closed a doji on the weekly on top of said line. This happens all while we are at major resistance on almost anything tradable.
Bears about to show the claw? 🐻 Comment below!
