VXNSimply use the Levels, RTs were to be anticipated, we saw a heavy Prop
under the ES and rotation to the YM.
NQ will sell once again.
Patience required.
No point in chasing it, Price will come to you.
STO/RSI Deeply oversold on 1 HR as indicated.
_______________________________________________________________
There are Days when CASH is an excellent Position.
We have not traded all day, merely Observing.
VXN trade ideas
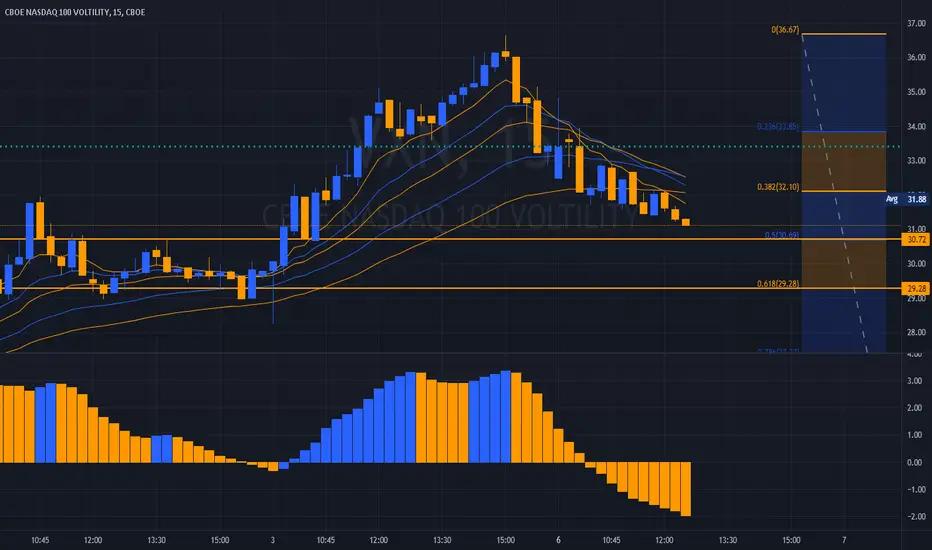
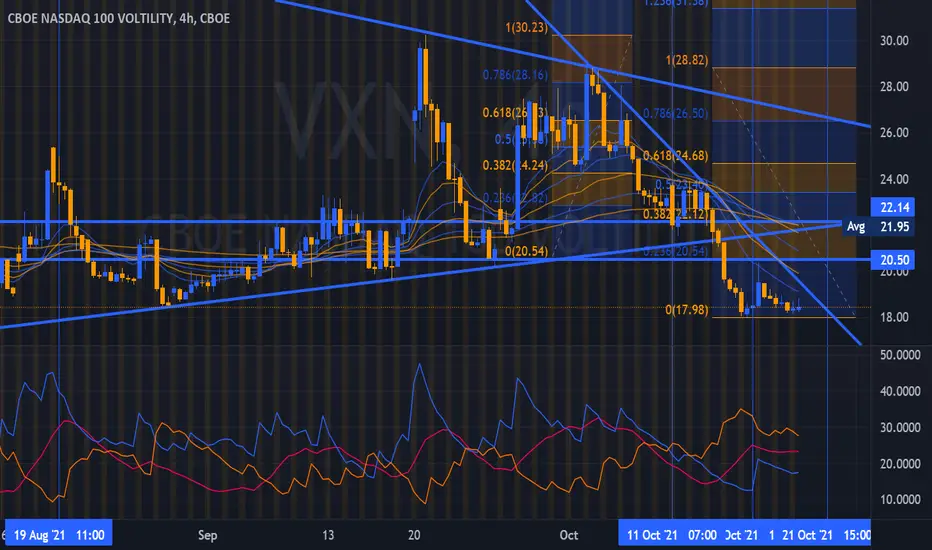
VXN - 4 Hour / Prior Highs 30.24
The Apex is refreshed from a 1-hour Chart showing its Zenith in the lower 31s.
What is fascinating about the VXN - imminent change in the index occurs when
a Prior Range is broken and a Price Objective is Exceeded.
This is followed by a rapid rise in the Index when it moves through after Backtesting.
The Delta HEdge needed the lowest possible FILL for the VX COMPLEX.
The VXN volatility index is now at a fairly high level, where it will provide - 1 of 3 outcomes
1. Continue an exponential move higher
2. Complete APEx and retracement to Support.
3. Reverse on the Secondary High
____________________________________________________________________________________
Given the outright Fraud in the Q3 Reporting and repeated Gamma Squeeze since September,
Collapsing Confidence - UMICH @ 500 Sample Size / Upcoming CCI 3000 Sample Size and
reduced Liquidity.
Any Panic will have a cascading effect.
_____________________________________________________________________________________
There are a great many very Disturbing possibilities.

VXN - Range CompressingWe have sold the NQ twice during the AM Session.
EU Session Close will be our 3rd Opportunity for the SELL.
The usual Gamma Squeeze Suspects are in the Trade.
After blowing through Extension Price Objectives, the
NASDAQ is getting Extremely Over-Heated.
__________________________________________________
TSLA 1209s appear to be the trigger for the ES to hit 4750.
AMZN is seeing Profit-taking while the Semis continue to be
bid.
TNX isn't having it - +3.78%.
Something is going to Break IF the VIX can hold above 20.20.
__________________________________________________
Our Position - Press Sells.
Today has been very amusing so far. Markets simply teetering
on the Abyss.
Non-Plussed on our End.
We will see how the EU Session Press and EOD Print registered
on the Stop Run / Bubble Scale

VXN - 4 HourBAAF
To my tired eyes...
This appears Bullish as ALL F_ck.
_________________________
Lets' get that 3%+ Drop on Evergrande Default.
It's in the Wind.
Multiple Confirmations from German Bond Holders as well as USA.

VXN - 1 HourAs Yields continue to Spike & Spook @ 2.28%+
Our Analogue for November 2019 may well come into
Trade this Week.
______________________________________________
The Blown 30 Year Auction is weighing heavily on the
Equity Complex.
With $10.875 in Coupon Purchases, Yields keep giving
Jerry and the Kids @ the FED...
The FAT FINGER.
______________________________________________
SAFETY TRADE = Uncle Buck.
Although Cancer-stricken, it is LESS Dead and Dying option
around the GLOBE as Nations are Raising Rates.
Meanwhile - FED FUNDS FUTURES continue their MOVE FORWARD.
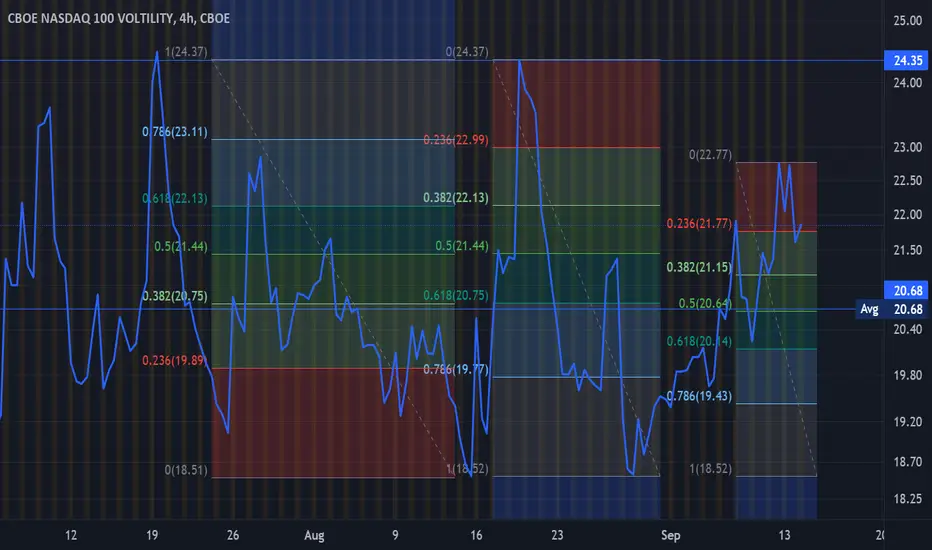
VXN - 2019 AnalogueThe VXN Setup up an Unseasonal Decline in 2019.
Erasing a 3%+ in a similar Structure to what we are
Observing now.
____________________________________________
The Point is - at that time, everyone was taken
aback by the sudden and very unexpected reversal.
*** Note the Lows for 2019, they are important on
a break of 18.01

VXN - Consistent / Congruent / CredibleAs indicated, the Bid under Volatility is THE Hedge.
Unable to Unload...
You have precisely ONE Option.
One Guess where the Hot Mess...
Will be heading
____________________________________________
9/9 Completes without a Higher HIgh.
Valid?
Yes, it is not required, but would have been nice
to have higher Entry.
____________________________________________
TSLA comprises 6% of NQ / 3% of the ES.
As Coins BTC/ETH head to 69K - 80K and 5 to 5.2K
A "Liquidity Event" is quickly approaching.
____________________________________________
This will take a few days to further assert downside.
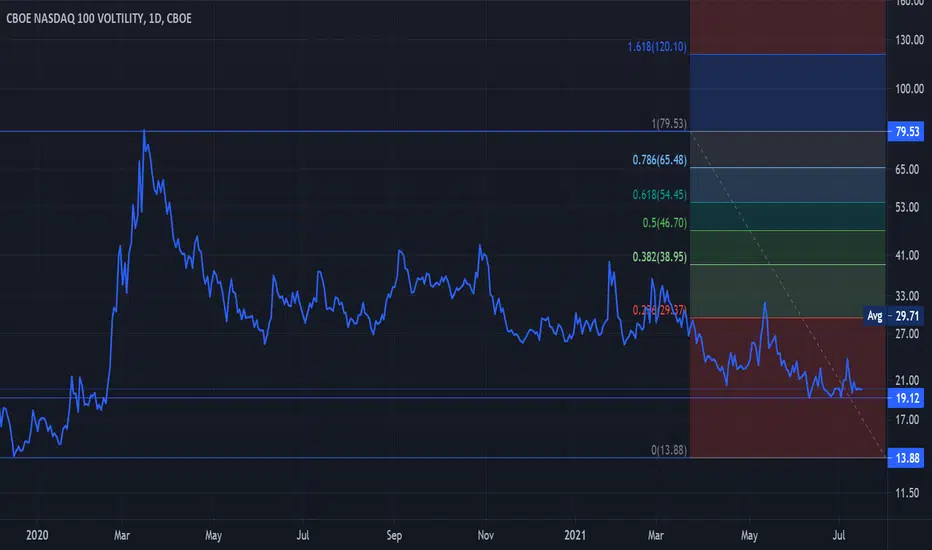
VXN - Setting the UP - 24sWe've seen Volatility Smoked repeatedly since the 2020 Highs.
One enormous Downtrend to fill the Lower Price Objective at
12.25.
It has been a long and somewhat winding road on the path, as
we have seen multiple retracements, some quite violent and
unexpected in TIME.
We suspect the same patterns will continue to repeat, although
anticipating a break from the 17 Month Trend, it will not be without
its fits and starts.
There are far too many headwinds to overcome on an Applied
Fundamental Basis.
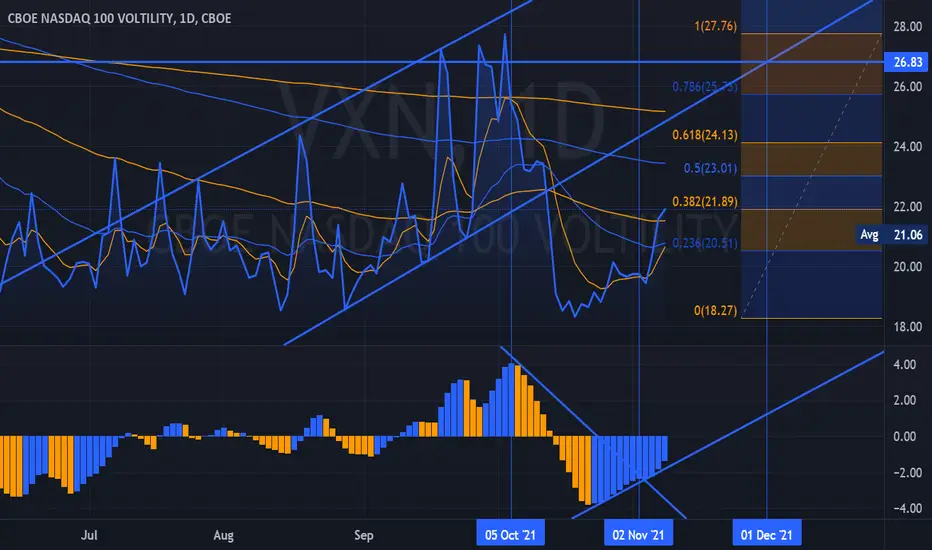
The ARBs have taken the VX Complex down further and faster ahead
of the FOMC in early November.
The REAL issue as indicated remains - is it Early November or Late
November.
A Santa Rally is baken in according to Buyers, all be forgone,
I see it quite differently, 4/4 is not complete or 3/5 is finishing,
although I lean more to far more prolonged and Complex correction
now, TIME itself will provide the answers.
In Obeying Price, the results are always a success.
There is No real rush for us, rather we prefer to watch those in need
of the Higher Fills grab them, we follow.
Price action is eerily reminiscent of DEC 2019 - Jan/Feb 2020.
Structures are indicating the 10 - 15% correction will occur, perhaps
much more, it will depend on whether or not our Counts are correct.
The rest is up to Price.
We are setting up a Large Structured Positional SELL.

VXN - Setting Up VXN's ST SMAs are curling back up once again after Teading the Lower Boundary.
As NQ continues to Range between Support and Resistance, the SELL continues to
perform @ Resistance.
VXN has NOT Filled its Opening Gap @ 19.17.

VXN - Collateral that does not Correlate all too well, it willThere is an explosive move setting up in VXN in the coming weeks.
We can see the NQ and VXN moving down together in the Micro Timeframe
as TNX moves higher, clearly the NQ is correlating more closely to 10Yr Yield.
The VXN will simply trade into the "Catch Up" Phase ahead.
ZB is hanging on, ZN is not being permitted to Break the 130.005, defended as
if there is no tomorrow.
TLT, weakest retracement in the 20Yr in Years.
TNX did manage to break and push to a Higher High @ 1.653, an ominous sign.
The issue now becomes does the FEDs Prop Desk go all-in on pushing a Yield Curve
around which is clearly had enough of their antics.
An Epic Battle is underway.
NQ traded to a Front Run of its Price Objective of 15316, taking some heat from the
SHM today. It will be interesting to see if they can now hit the Higher Price Objective
overhead @ 15517.
The DMI supports it for now, one to watch as the Progressive series of lower lows there
is meaningful.
An outsized move is again set up as Divergences grow, we all know what happened last
time we had conflicting Indications. It took time to build, this go around... time seems to be
very compressed.
The next 30 days should be amazing.
TECH remains @ RISK.
VXN - NQ Volatility Weekly - Significant Falling WedgeWhen in doubt, Zoom Out has been suggested for as long as we have been trading.
Alexandra reminds me of this tried and true Axiom when Counter-Trends Develop.
Confirmation in the Weekly Time-Frame supports the BULLs, of this there can be
very little doubt, it is a large falling wedge of extreme range.
It looks terrible for the SELL.
And yet we saw 1343 Ticks come off the NQ within the downtrend, barely a blip
to the Upper Trend Line only to fail again.
A ~6% move down in NQ generated a 50% move in VXN.
Institutions/Funds profited from their Put buying Spree as Implied Volatility
had been crushed again. Step and repeat... same as it has been for a long time.
There are always anomalies in Weighted Indexes - TSLA by example was falling down
the mountain and kissing dirt... BUT... implied VX in TSLA was rising quickly as PUT
Buyers began to double down, triple down, and begin a degenerative campaign against
the Heavy Weights who hold Tesla. Tesla is a Protected entity and has a decidedly large
weighting within its Index.
For 12 straight days, Put Buyers were smoked, used as lighter fluid for a relenting grind
higher and higher.
Anomalies occur, the Heavy Weights always catch the Bid to prop, and when there's fuel
a match is merely a few feet away. Once again the Tesla Dumpster Fire was put out
with Gasoline.
With the VXN feeling the Crush, having broken 23.52, 22.12, 21.32, 20, and 19.73, then
18.60. It's a beat down that only the Chevchenko's can deliver.
So where is the Lower Boundary, we'll know as we head into EPS and VX Settle.
More importantly, where is the UPPER BIoundary as it serves to provide indications as
to whether 4/5's completion ends there or an Overthrow of this Weekly Trendline can
occur, signaling much larger issues ahead as 5/5 completes.
We shall see, it will take a monumental effort to keep this in check as Yields are quite
clearly a threat to the TECH Complex. There are a large number of Additional Threats
beyond Yields.
We are entering a cautionary period for TECH, as we maintain it will fail.
By all appearances, one would expect the exact opposite, and there is the challenge.
Trade safe~!
- HK

VXN - 21.51 Failure / 19.60 - 18.60The NASDAQ Volatility Crush is advancing as Price has moved through the lower
DOM Support.
It will open Lower this morning after the Globex wire to wire Bid.
AAPL is back above 142 signaling another Gamma Squeeze ahead of what
will be disappointing EPS on the EPS Warning of 10 Million Shortfall in iPhone
shipments.
Again, ZERO mention of M1X/M2 rollout, an ominous commission of what lay
ahead for AAPL - a Price Objective of $35 after 5/5 completes.
Crude Oil EIA was delayed a day due to the Monday Holiday, it will be released
@ 11AM EST. Crude and the NQ trade in some interesting patterns during RTH
and why I am mentioning it here, watch the pair and see if you observe it on
the Micro timeframes.
EPS reporting Season for Q3 opens with DOW Components, Tech begins today
as well as TSM, who missed Top Line by a small margin as reported.
IMHO, they cooked.
The fate of the Markets rests upon further fraudulent reporting to arrive.
We closed Globex BTOs form RTH close yesterday - Position @ 100% CASH.

VXN - NASDAQ Volatility Increasing - Larger Draws DailyNever underestimate Wall Street.
Although there is a clear break in the Absolute Correlation between
the VXN & NQ as there is in VX as a Complex... one which can easily
be observed... it is irrelevant, as the Trend Itself will re-assert as Price
begins to clear VIX Roll into a settlement next week.
Wall Street is positioning now.
As we continue into a very heavy MAcro Data Week beginning Wednesday
with the FOMC and Jerome and his Minions posting up the Blah Blah and
Yada Yada - Yoda routines... the Smart Money isn't buying it.
We see the NQ's reaction with the VXN substantially lower than Friday's
lower range while Nq's Price is struggling the 50%.
Divergences are very clear and why we maintain the 200SMAs will be tested
and Ultimately Busted - after the Potential for a 200SMA bounce and countertrend.
The Bots are running wild again competing on both TF's - there is a very real
struggle to continue lifting the NQ which is having difficulties...
We are SOH and waiting to see what shakes out.
We have closed our NQ Longs off 703 @ 777.

VXN - Open at Lower Trendline SupportThe VXN has been extremely reliable. The range has expanded with NQ VX.
The same cannot be said for the VX Curve and VIX as it correlates to the ES,
the compression and clear attempts to collar it are evident.
We should anticipate lower Prices for both Today.
Tuesday's NQ/QQQ Put buyers were used and abused once again, buying lows
and having no chance to exit prior to RTH's NYSE open and vertical move off
the pre-market lows from Globex.
We doubt the same Buyers will attempt this again any time soon as they were
simply crushed, abused - their pockets picked, becoming immense fuel after
having gone all-in on the Crash for NQ.
Impatient, and now wrecked on this trade, the DESKs see the entire order book
and use it to their advantage every time, they never miss a beat in collecting
bad retail bets.
And make no mistake that bet was way offside near the Weekly Lower Support
and Trend Line. It was a blind bet with no real awareness as to where Price was,
simply a dart toss on who knows what.
Keeping a close eye on the VIX and VXN as we come into trade today will be extreme
in its importance as the next 24 hours are going to provide a great deal of information
as to whether this can continue or simply roll back over and head to the 200s.
Should Friday provide cover to run higher, things begin to change short term.
Unfortunately, we will not know until the Close of Trading Friday...
SOH here... Patience.

VXN - NQ Volatility / 30 Day VX Expectations - ES YM RTYWe see how important the Ledge remains.
We traded Support first thing this morning, this
is where and when we Closed our NQ SELLs.
The balance of the Day was SOH.
The intent is clear, the Hourly was over-sold, the Weekly
remains deadly.
These are enormous ranges and again, IF there is not a
high probability setup with a clearly defined trade plan.
9/10 its a loser.
NQ did exactly as indicated within the Range.
The ES, although the Range expanded to 4140 (200SMA) to 4388,
it did dip in @ the Upper Trend Line by a few Ticks.
The VIX gave up the Ghost, as indicated there is a serious effort
to keep it under control AND we have 10 trading days to Roll/Settlement.
This is the sweet spot for Counter Trends to develop.
YM / RTY - exact same trades... RTY is always used to park $ as it is easy
to manipulate due to its weightings.
We suggested this CT would evolve and patience was required as it can
trade up to the Ledge, a Gap Fill, remains possible, but not probable.
Were the Indices to Fill their overhead Gaps, it would imply a longer
correction duration... this is why patience is so very important.
It is best to permit the Trade to come to you as opposed to chasing it.
This generally ends badly for most traders.
There is far more Downside to come as the 200SMAs are wide open now.
Observe where the 21/34/50EMAs are, know these levels, they are extreme
in importance and the Algo's always using them for Fills.
We have 2 competing BOTs, one - short term duration - and the other attempting
larger fills on Daily Time Frames, when they are not competing, as we have observed,
the ST ALGO runs the Range until the DT ALGO gets its Fill.

VXN - NQ Volatility / 30 Day VX ExpectationsImplied Price of options listed for the NQ.
We see a clear change in the Trend for NQ VX.
Globex is now increasing in VX as we see a 200 Tick Range
for NQ since the Globex Open.
Algos are simply running the Range capturing Ticks.
AAPL is sitting on support @ 141 and with EPS dead ahead
for the Indices - and an absence of EPS Warnings...
Bombs should begin to drop as Q3 was dismal, to be kind.
AAPL's delayed M1X rollout and M2 rollouts will have left a large
hole in 11% of the Company's EPS, iPhone lackluster demand for the
13 isn't going to assist.
The marginal iMobbers are tightening their spending significantly.
10Yr Yields will continue to provide a stiff headwind for everything
as DEBT issues compound into the 18th.
We should anticipate some Media Swings with respect to the Administrations
Agendas and Fiscal Malaiese.
The SMH continues to SELL as TSM & ASML remain @ Risk.
GOOG will enter the Mobile market with its Tensor Chips with
impressive advancements for the Pixel 6 and Pixel 6 Pro.
Samsung's Exynos 5nm chipset centered on the AI-boosting TPU and
a great many improvements for Google Fi as well. A true International
Phone is arriving Mid-October.
Alphabet is hoping to capture Market Share and we believe they will.
One Plus was our go-to for several years as they simply outperformed
everyone else until the Oppo integration.
We are switching to Pixels later this year and moving all services to Fi
as the Service is straightforward and with fully integrated Carrier
Switching... a near-perfect arrangement.
Apple's latest offering, a shallow one imho.
Although Budget offerings from Mint Mobile will see uptake, where it
counts, Fi will begin to gain share slowly until they are able to
scope/scale for a lower tier.
Chip shortages are going to wreak havoc once the Retail herd understands
how dramatically sales have gone El Cliffo.
VX is going to increase again, as uncertainty begins to unfold in a far more
dramatic fashion.

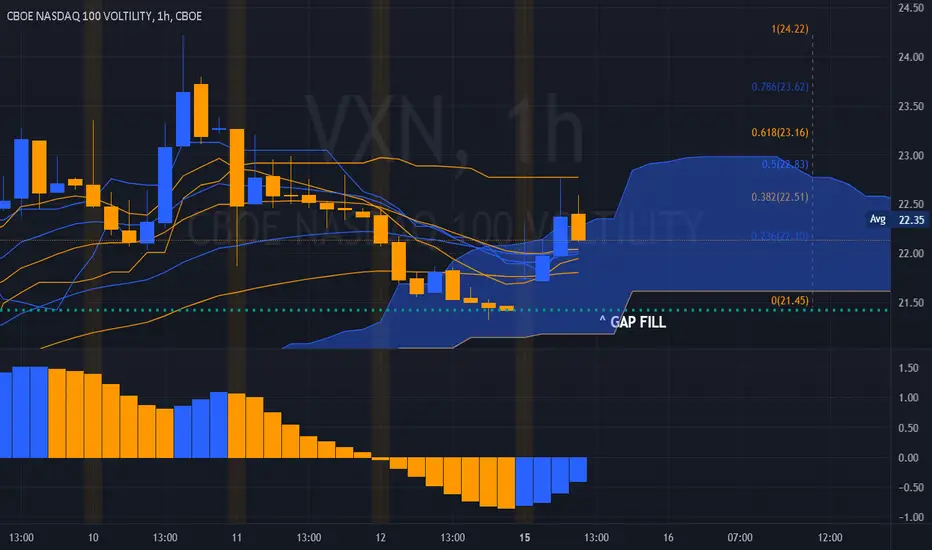
VXN - Gap FillOver 15 Months $4.7 trillion was added to the National Debt.
The Federal Reserve purchased $2.442 trillion in US government bonds.
US Central Bank monetized more than 50% of the US Debt during
the first year of the pandemic.
No single entity bought more US bonds than the Fed – Foreign Investors,
US Banks, US Corporations, and Individual Investors.
The Debt Ceiling will need to make it through the Senate, which will
use reconciliation.
It remains in stasis for the next several weeks, giving Wall Street cover
to begin further distributions as planned.
Quite often the best-laid plans come to pass, sometimes they do not
as we have seen the Price of the NQ fall below the prior consolidation
zone.
A great deal hinges on today, there will be a reactionary trade into
the final hour is when we will see the real ST trend indications.
They may well be a misdirection, patience will prevail into October.
Anticipate the Gap Fill on the VXN and VIX - although the Indicies are
not moving in lockstep with a direct correlation, but wildly volatile
as this pullback in Volatility completes.
Observation Day ahead - HK

VXN - NASDAQ Volatility Increasing - Larger DrawsWe have Objectives for VXN int he 35-40 Range into October - November.
With Put Protection on Varying Instruments within TECH from Retail traders
at one of the highest in Months in play, they will attempt tp squeeze protection
as Crammer has once again led the sheep into the Dip.
Institutions are concerned as they are UNABLE TO ATTRACT DEGENRATE GAMBLERS.
Only the HOODIOTS are taking the bait.
VXN - NastyTech wreckage, shattered 480s.
Not good as Tech chasers were clubbed
as Baby Seals scampered off the rocks
only to be devoured...
By Great Whites.
It's what's for Dinner.
FLASH CRASH setting up nicely.
"Everything Must Go Sale"
xoxo - China A50 wants Ketchup

VXN - NASDAQ Volatility IncreasingNot a good sign for the HODLers of Tech, still early and
EU Session close ahead.
Up to the Usual Suspect to use $1.47 Billion in Kitty Cat Cash
for the Squeeze.
Wish them well..

VXN - NQ VIXIndications from the VXN were suggested this AM.
It serves us well in providing information to confirm or deny
or trades in the Nasdaq 100.
It's working perfectly today, the wedge break and move up and
out told us the NQ would test 526.

VXN - NQ VolatilityNasdaq continue to ride the 2010-2011 Peak's Upper Trend Line.
VXN's range is disturbing as it broke the 19 level. 13s are now open
for a potential blowoff.
Banging its head repeatedly, it has been difficult to ease into a
SELL position that can be held... new highs, larger negative divergences.
Straddling the Upper Boundary on the Weekly chart remains the trade
for NQ.
It has lost all momentum, making a lower low in trend - only to reverse
and make new ATHs.
Semiconductors were the leader for NQ - MU AMD INTC NVDA AMAT AVGO
TXN QCOM ASML TSM all had large CALL BUYING to wreck the NQ Sellers.
SOXS holders as well, a large destruction of Price to new lows.
The RANGE is extreme, the Upper Trend Line now 10 years in uptrend,
remains the Sell Off Level.
Position - 0

NASDAQ Volatility - Important Tool The VXN Index is a Volatility Index to estimate expected volatility of the
NASDAQ 100, It is calculated using the midpoint of RTH Real Time NDX
option bid/ask quotes.
The Range is quite clear, we are approaching the bottom of the range.
Probability is advancing into a clear SELL signal.
NQ trading for success requires a close monitoring of VXN, everything
a Trader needs is within this Chart.
The Financials continue to selloff, there are large warnings in all
Markets - when this breaks down it will be dramatic.