Bear flag18 ema, looking to smash down ans invalidate a VIX breakout, if you bullish you want to see a bearish breakout from bear flag, if you bearish you want to see a vix breakout..
Stoch rsi showing overbought conditions with an apex around 330pm
VXX trade ideas

Trading the VIX – Part 2Trading the VIX – Part 2: VIX ETPs and Strategic Applications
In Part 1 of this series, we explored the structure of VIX Futures, focusing on the roll-down effect in a contango VIX futures curve—common in calm market conditions.
In Part 2, we turn our attention to VIX-related Exchange-Traded Products (ETPs)—specifically, the popular and liquid:
• VXX – unleveraged long VIX ETP
• UVXY – leveraged long VIX ETP
• SVXY – inverse VIX ETP
Each of these products is based on a specific VIX futures strategy, the “S&P500 VIX Short Term Futures Index” , which is maintained by S&P, Dow Jones (the “SPDJ-Index”). The Fact Sheet and Methodology can be obtained from the S&P Global website.
What is the SPDJ Index that these ETPs track?
The SPDJ-Index is a strategy index that maintains a rolling long position in the first- and second-month VIX futures to maintain a constant 30-day weighted average maturity.
Key Features of the SPDJ Index:
• Starts with 100% exposure to VX1 (the front-month future) when it’s 30 days from expiration.
• Gradually it rolls from VX1 to VX2 (next-month future) each day to maintain a 30-day average expiration.
• At all times, the index is long either one or both VX1 and VX2, with exposure shifting daily from VX1 to VX2.
• This roll mechanism causes value erosion in contango (normal markets) and gains in backwardation (during volatility spikes).
• Since contango is the dominant market state, the index loses value over time—with occasional short-lived gains during sharp volatility increases.
Importantly, the SPDJ Index does not represent the VIX or any other volatility level, it simply reflects the value of this futures-based rolling strategy.
________________________________________
Breakdown of the ETPs: VXX, UVXY, and SVXY
VXX – Long SPDJ Index (1x)
• Tracks the SPDJ Index directly
• Suffers from the roll-down drag in contango environments.
• Useful only for short-term exposure during expected volatility spikes.
• Timing for long positions is critical
UVXY – Leveraged Long (Currently +1.5x)
• Replicates a strategy that maintains a constant leverage of 1.5 to the SPDJ Index.
• Formerly +2x leverage; reduced in April 2024.
• Highly sensitive to VIX moves; underperforms long term due to both roll-down drag and leverage decay (see below). Timing for long positions is even more important than for the VXX.
SVXY – Inverse (-0.5x)
• Replicates a strategy that maintains a constant exposure of -0.5 to the SPDJ Index.
• Benefits from falling VIX levels as well as from contango in the front part of the VIX futures curve.
• Formerly -1x before the Feb 2018 volatility spike triggered massive losses (XIV, a competing ETP, collapsed at that time).
• Performs well in calm conditions but is vulnerable to sharp volatility spikes.
Leveraged & Inverse ETPs – Important Notes affecting the UVXY and SVXY (without going into details):
• Daily resetting for the replicating strategies to maintain constant exposure factors (different from 1x) are pro-cyclical and can cause compounding errors, specifically in turbulent markets (e.g. Feb 2018).
• The real volatility of the VIX futures itself acts as a drag on returns, independent of the index’s direction.
• Risk management is essential—especially with inverse products like SVXY.
All three of these ETPs track a VIX futures strategy, they are not levered or unlevered versions of the original VIX index. Each of these ETPs benefits from liquid option markets, enhancing the toolkit for volatility trading.
Trading Strategies Using VIX ETPs
Here are several practical approaches to trading these products:
VXX and UVXY
• Best used for short-term trades aiming to capture volatility spikes.
• Options strategies such as zero-cost collars, vertical and calendar spreads can help mitigate the challenge of precise timing.
• Avoid long-term holds due to erosion from roll-down and leverage decay (see historical performance!).
SVXY – The Carry Trade Proxy
• Ideal for profiting from prolonged calm periods and the contango structure.
• Acts like a carry trade, offering a positive drift—but must be paired with robust stop-loss rules or exit strategy to guard against sharp spikes in volatility.
Switching Strategies
• Tactically rotate in/out of SVXY based on short-term volatility indicators.
• One common signal: VIX9D crossing above or below VIX, i.e. long SVXY if VIX9D crosses under VIX, staying long while VIX9D < VIX, closing long SVXY position when VIX9D crosses over VIX. Some traders also use crossovers with VIX3M or the individual expirations of the VIX futures curve to manage entries.
• Switching between SVXY and VXX based on crossover triggers through the VIX futures curve is often advertised, but very hard to get working in practice due to the importance of timing the VXX entry and exit – signals from the VIX curve may not signal VXX entries and exits timely enough.
Term Structure-Based Combinations
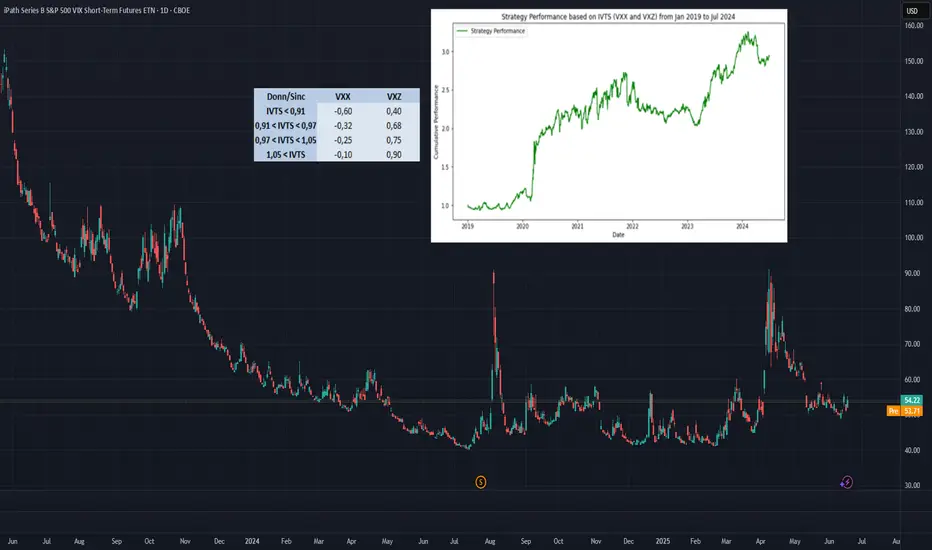
• Combine short VXX with long VXZ (an ETP tracking longer-dated VIX futures, balancing the 4th to 7th VIX contracts to achieve a constant expiration of 60days).
• Weighting is determined by the Implied Volatility Term Structure (IVTS), calculated as VIX / VIX3M. This approach adjusts positions based on the shape of the VIX futures curve, indicated by the IVTS. For instance, when the VIX futures curve shifts from contango (where near-term futures are cheaper than longer-term ones) to backwardation (where near-term futures are more expensive), it involves reducing short positions in VXX and increasing long positions in VXZ.
• This approach mimics the spirit of a calendar spread strategy in VIX futures and reflects the “S&P 500 Dynamic VIX Futures Index” , with weightings backed by research from Donninger (2011) and Sinclair (2013) - see performance chart and weighting-matrix enclosed in the introductory chart).
________________________________________
VIX Curves as Market Indicators
Beyond trading, VIX instruments and their term structure are widely used as market sentiment gauges. For instance:
Signs of Market Calm:
• VIX9D < VIX
• VIX < VIX3M
• VIX < VX1
• VX1 < VX2
These relationships imply that short-term volatility is lower than longer-term expectations, indicating near-term calmness in markets, occasionally leading to market complacency.
Traders and institutions use these signals to:
• Adjust positioning in broad market indices
• Determine hedging requirements
• Evaluate suitability of selling naked options
________________________________________
Final Thoughts
VIX ETPs offer a powerful toolkit for traders seeking to profit from or hedge against volatility. But they come with structural decay, leverage dynamics, and curve risk. Timing, strategy, and risk control are key.
VXX LongAfter SPY quick UP, VIX is Low, there might be next SPY move to the downside.
Long entry 51.5
stop 50. buy Option, Max risk is same as stop 50.
Target 65
Risk management is much more important than a good entry point.
I am not a PRO trader.
In my trading plan, the Max Risk of each short term trade should be less than 1% of an account.

VXX shortVIX above regular range
After SPY quick down, VIX is high, there might be sideway consolidation.
Long entry 76
no Stop ,
Target 40
Risk management is much more important than a good entry point.
I am not a PRO trader.
In my trading plan, the Max Risk of each short term trade should be less than 1% of an account.

SHORT TERM VXX ON THE DAILY. BREAKOUT COMING SOON?Doing my weekend research i stumbled on the macd crossing green on the vxx with this descending triangle on the daily. If this breaks the volatility can come back into the market like last week and we can see some huge swings in stock price. The week of 2/10/2025 will be very interesting.

VIX ready to explode higherLook at the last 2 Monthly candles. They are bullish candles and short term volatility would explode higher in Feb 2025.
All the best.
Marketpanda
Disclaimer: The information provided is for general informational and educational purposes only, and does not constitute financial, investment, or legal advice. None of the content shared should be relied upon as the sole basis for making investment decisions. Prior to making any financial or investment decisions, it is strongly recommended that you consult with a qualified financial advisor, accountant, or other professional who is familiar with your individual circumstances and risk tolerance. Any reliance you place on the information presented is strictly at your own risk, and we are not responsible for any losses, damages, or liabilities resulting from your investment or trading activities.


commodities high conviction entry in FebLooking back, commodities had a high conviction in february based on a longterm trend. Combining macd and BB break out.
Markets have either risk-on sentiment or defensive. During risk-on phase people want to put money to work, there is too much money. During risk-off or defensive, people want money and safety. Assets become too expensive. Bitcoin rallies during risk-on phases. Oil or gold can be either risk-on and risk-off . Markets are fascinating.
Faang can be a risk-on and risk-off, till everything becomes too expensive to have.
Markets leave clues. and they move on cycles.
It makes sense why commodities are risk-off . Small caps usually are risk-on (when economy does well, there are no global conflicts; ie the future is BRIGHT).
More concerns move the weight to risk-off , ie markets are a weighing machine longterm.
People tend to be stuck in one mood or another, and it's tough to adjust? markets can change gears quickly.

DJP - Commodity Index H&SHead and Shoulder formation on the Bloomberg iShares Commodity Index. Attractive trade also in the current inflationary environment for one's currency to maintain purchasing power. Target @ 37.50 corresponds to high in Aug 22.

Inflation poised to get a hair cut The chart of $DJP, the Dow Jones Commodity ETF, if forming a descending triangle, which typically is a bearish manifestation on the charts, particularly when it occurs as a continuation pattern. I will take a short position here if a BO occurs.

Commodity Index Bearish ContinuationA basket of commodities continuing its downtrend. If we break to new lows, expect further decline.

DJP holds TL or GANN support @37; FIBO levels dictate INFLATION!DJP, a commodities play, is an inflation hedge. If DJP breaks 37 voiding the Trendline or GANN FAN line support, then inflation may have peaked out temporarily.
Holding 37, DJP may see higher inflation numbers.\
Note that all impt FIBO levels are respected here in increments of 4.
37 is the 2.618 level of 31 to 27.
If 37 holds, the next resistance is at 41, the 3.618 & next higher high is 45 the 4.618 level.
If 37 breaks, the next support is 33, @1.618 FIBO.
Not trading advice

Commodities gap turned support; bounced above TL, VWAPs & 0.236DJP commodities back to short term uptrend with 2 higher highs & now also 2 higher lows. It just recovered the uptrend line after filling the previous up-gap (the green zone). It also bounced above the 2 VWAPs & FIB 0.236 level.
However, it still have to go back inside the ascending triangle where it BO from. If DJP holds the TL & also go back into triangle in the next few days, then this BO was a beartrap.
Not trading advice

Economic Game Mechanics: Part 1DISCLAIMER
This is in no way, shape or form, fluid and function, an analytical, qualitative or intelligent compte rendu. The function of this essay is the maddening diatribe of a curious author, and how this one manages micro- and macro-economic data for a critical investigation into the micro- and macro-economic world. This text is not suitable for direct consumption, and should never be used as a primary or secondary source. The contents of this text are often illogical and offensive, and great care should be given to the reader's personal qualifications and senses. This text is delivered on TradingView, where the userbase is expected to have a level of financial and investigative understanding that would enable them to query appropriate thoughts and abdicate nonsense to the void. May whatever sovereign and omnipotent being you believe in, guide you through this.
Important note: There are many, many figures here. Please pay attention very carefully to the axes and trends, not specifics. Real data is only as real as the reader allows.
Thesis
Settlers of Catan is the greatest game. For those unfamiliar, it is a relatively simple randomly generated board of resources where players act as independent nations, working towards building their settlements, roads, and armies. Players have limited inhibitory actions against each other, but may trade freely. Points are tallied by performance and landmarks, such as longest road and largest army. While high-brow journals might be more focused on old-civilization games like Go, Settlers of Catan is far more interesting as an old civilization-building game. Monopoly is a game of chance, Risk -meditated chaos, Sorry -a delightful spar of sadism and masochism. In most games, the player that forms the strongest plan of attack with the best risk management wins. The player could set out clear objectives, focus on their dominance in these aspects, measure the points carefully to ensure their success. Rarely does a game so reward the dancer as Settlers. A game of limited outcomes, plans are easily delineated, and the appropriate hindrance dropped fortuitously can crush moves many turns in the making. Randomly-generated resource placement poses possible geographic dilemmas for players, forcing a social relevance to the landscape. A player focused on combative, competitive behaviours could find themselves without the commodities they need. The nation that remains fluid to the situation, with a dynamic plan and clear focus on the only thing that matters: victory. The nation focused on forward progress rather than one specific path will fare the surest chance. The nation conscious of resources it needs now, and in the future, will be the surest to flourish. The nation empathic to it's peers, that learns to use cooperation to win the competition, will be the surest to embiggen. Settlers of Catan is the greatest game.
Dichotomy is engrained into the laws of the universe; always opposing forces that balance to create and destroy along ordered fractals parallel. This dichotomy is reflected in nature, both the natural order around humanity, and the natural order humanity attempts to create. Yin and Yang, life and death, darkness and light. Where each person defines the rules of their own life, this author rests with the rules of Thermodynamics that beautifully states, "Energy can be neither created nor destroyed, only altered in form." This law unites dichotomy, not as similar forces, but as two hands of the same beast; evolution. Each side must be preserved and accounted for, one without the other is a stress on disequilibrium, the longer and more extensive the pull from balance, the greater the shock. In nature, this is found by the cyclical expansion of predator and prey populations. Russia's price-shocks after the fall of the Soviet empire poses a more relevant example for economics. As the USSR maintained price-controls at the expense of trade opportunities, industry diversification, and sovereign indebtedness.
Economies are equal parts substance and confidence. That is to say, the richest economy in resources struggle in wealth on the international scale. Africa has long been the land of ravaged, with many European countries cutting through the populace and geography, accentuating deforestation and desertification, ripping the people from their homes and building their own countries on the backbone of a new serfdom. Arguing history is as forlorn as arguing data, Africa is a commodity rich land that has been scraping by on the charity of their Western peers . Afghanistan, presently war-torn, as opposed to the historically war-torn, is one of the most interesting modern cases of the resource wealth versus economic wealth. The country has rare mineral and metal pockets scattered through the landscape at an estimate of trillions in pre-COVID prices, and with commodity inflation what it is, those trillions grow. So too does the international interest, with China's recent spotlight stake on investing in Afghanistan. China has one of the most phenomenal programs of imperialism, mimicking the US' and Europe's own program of massive credit and debt leverage extension to the banks and corporations integrating into developing countries and controlling large parts of their development. On the flip-side, America's own invasion of Afghanistan in 2001, to their withdrawal in 2021, went astoundingly well for the country. One final glimpse at Russia's own predicament outlines the shades of grey; from resource to commodity, what is the sovereign state worth? Afghanistan's lack of confidence erodes substance, the inability to unite a diverse population with a common goal, limited their ability to thrive on such resource-rich land. An inability to tap into those resources via commercial mining operations and international trade, or intranational refinement, development and technological maturation. Russia's self-destruction of confidence languishes in substance, international trade destruction an obvious outcome of continued aggression, and a last-ditch effort and pulling forward the iron curtain once more.
America: the universal center of finance and trade, the epitome of a developed nation, the unipolar superpower upon which the rest of the world exists a derivative of, with a significant lack of substance. Economies are a confidence game, because trade is built upon a single principle, Supply and Demand. Influencing either side can be done via substance, or confidence. Trading goods and services for goods and services is inefficient, impractical, and impossible for the developed world. Sovereign state citizens must have confidence in their ability to trade their own goods and services for an intermediary, and that intermediary being stable and acceptable to procure other's goods and services. That Sovereign state must erect a system to ensure that confidence is not eroded inter- and intra-nationally. The form of that confidence growth is multi-faceted, implicating more active economic participants making goods and services, selling, buying and using those goods and services. The form of that erosion is a decrease in the relative economic strength to competing sovereign states, because in Capitalism, there are no non-competing sovereign states .
America's ability to tame the world, to unite the many states and offer them a platform for more efficient growth and trade, has established it as that center. The confidence is well deserved; global lifespans are increasing, education, progress, development, medicine and technology have all seen such accelerating growth over the last 80 years when compared to the entirety of human history. Avoiding the obvious ethical dilemmas in proclaiming a complete victory, Bretton Woods has been wildly successful for the world. But, as the confidence in the foundation of Bretton Woods being fair to all current major economic superpowers erodes, a new balance will be sought. China's ability to create a second pole, not just a second superpower, is critical to the relative strength of the dollar. Playing World Reserve Currency may seem a simple trick to the crypto-enthusiast, but it is a destructive battle of balance. As the US strengthens, there must be a congruent weakening. As the US weakens, there must be congruent strengthening. How this interaction behaves in a system is up to the balancing members, with an explicit focus on the key world reserve currency central bank. When a senator of the United States congratulates the president of the Federal Reserve on becoming the most powerful man in the world, again, there should be no laughter. Leaving some algorithmic response, a mathematical god to balance the great international abacus of trade, is a harsh solution to a harsher reality. The Federal Reserve's job is to buffer these changes, to control chaos and infect it with order on the grand monetary board, because the system's most important part is the future participant, because the system must be self-propagating, it must continue . If America fails to present to the world a convincing thesis to maintain the global monetary form of confidence, then it must be backed by substance. Even when the world government's meet to discuss a new Bretton Woods or Desert, America's strength at the table will be on based on confidence and substance. A brief tour of American international relations plays as a horror-show of karmic entrants across a landscape of emerging markets. America will require substance.
CONTINUE TO PART 2

Big Reversal?Just putting the lines together. Looks like it could hit 32 by end of September. Breakout or dip after?

DJP monthly - trending is turning upDoubleLine Gundlach said this year is the year of commodities. I took a look at DJP it indeed looks very attractive. RSI is above 50, MACD is positive and price is above 10 month MA and the MA itself is flat to turning up! I think it is a buy if it can close above $25.50 on a monthly basis.


Mirror, mirror on the wall say whats the best trade of them allZero risk volatility
The main risk free rate of return is the US government treasury bill and that is one of the oldest bull markets we have today. With rates so close to zero, some argue the market have already peaked.
Weaponized "exorbitant privilege"
The US monopoly over the global payments infrastructure has been challenged by Germany’s foreign minister, Heiko Maas, after European businesses have been caught between the European Union and the US over trade with Iran amid US sanctions. If both Russia, China and now Europe create their own payment systems, the world can route around the weapon that is now the dollar and the world dependence on the dollar will subside. By weaponizing their currency USA risk loosing the dollar as world reserve currency.
The zero lower bound
When interest rates are super low, central banks can not lower them that much more. This creates a liquidity trap and the phenomena is well known. This becomes a big problem when the economy is imploding and needs stimulating. Since central bank can not lower the rates, the government will instead have to spend. Hopefully they will print money and spend on building (instead of going to war) out infrastructure. The Chinese "One Belt One Road" is a good example. If the Chinese succeeds, this will also contribute to shifting financial power away from the dollar.
Loose cannons on a ship
If the world starts to route around the dollar and the T-bills as zero risk might comes into question, the big question is what can replace it. It has to be something that is deep and liquid enough. Can you think of something obvious? Me neither. So if there is nothing obvious, a whole lot of money will start looking for something that at least won't go to zero. If government starts spending on infrastructure commodities might become a money magnet.
Commodities
The US stock market have already had a huge record breaking bull market and subsequently one of the sharpest dops. Commodities on the other hand has been more or less ignored for a very long while. Even though the world is eating more food and building more stuff and there is talk "peak in this and that", the narratives have failed to compete with that of IPOs on Nasdaq. If commodities starts going up in price, this will also add fuel to inflation which is a boon in a deflationary economy and will help to inflate the huge debt burden of the world (which is a reason why I believe those in power won't try to prevent it).
Current
I've been a dollar bull since it started to trade upwards some time ago and as the world stock markets started to go down. I think the dollar will strengthen as more problems in the economies of the world starts to surface. Then after that.... then I think commodities will start to trend upwards.

DJP checkup - patiently waiting for a turn - 1/24/2016DJP is far far worse than 2009, and is now at decade low. Other than diverged RSI and MACD, the main trend is still down.

DJP update - bullish - 6/9/2010Similar triangle bottom pattern as 2009, with similar RSI and MACD settings. Buy triangle breakout + RSI breakout, on weekly close basis. Or if aggressive, buy now with a reasonable stop (like March low).

DJP update - promising - 4/30/2015A tiny breakout and above 10 MA. May be still bottoming and forming a small right shoulder (or cup handle). But I think in near term, it should be able to reach 0.382 Fib ($32 level).

DJP update - commodities may have bottomed - 3/22/2016Still a little early to call, but the divergence is evident. To confirm, we want a positive MACD, and all red resistances get cleared.

UBS-Commodity Idx Buy Signal DetectedThough 50-3EMA has a steep down-slope which is indeed worrisome, volume and price suggest early buy signal confirmed by RSI bottom reversal. If you want to have a real-time alert try us www.2waytrading.com
