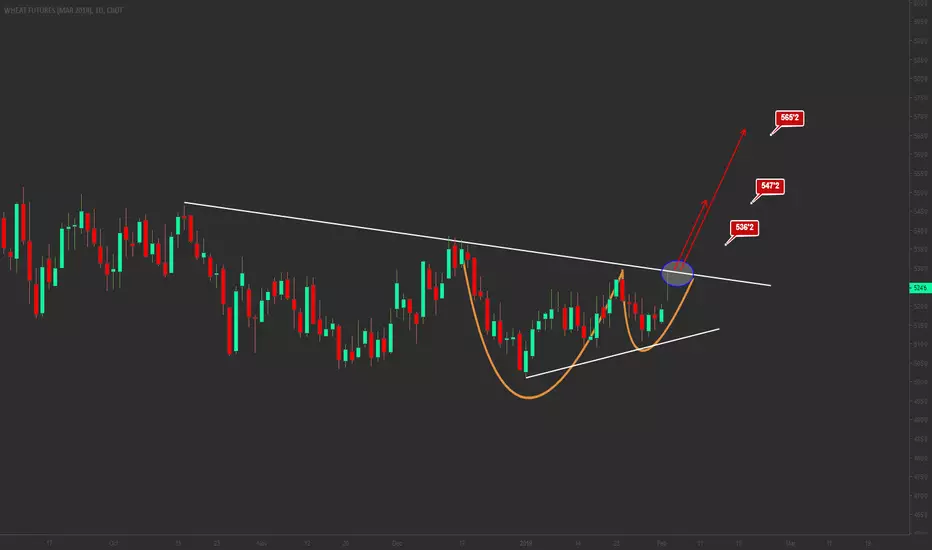
Wheat Long analysisWheat looks like a inverted head and shoulder. If you are looking for swing trade the target is 608.70 on the break of 557.14
AUW1! trade ideas

Navigating the Temporary Rebound in Wheat PricesWheat prices have recently strengthened, supported by a surge in exports. However, the upcoming main harvest season is expected to boost supply significantly, which may lead to oversupply and downward pressure on prices. This dynamic presents a compelling opportunity for astute portfolio managers to consider a spread trade using CME Micro Wheat Futures.
Surging US Exports Provide Near-Term Support
Source: Karen Braun via X
Over the past two weeks, US wheat export sales for the upcoming marketing year have sharply accelerated, reaching a 12-year high. This surge is driven by a weaker US dollar and a front-loading of trade activity due to potential disruptions.
Source: NASS
In addition to strong export sales, weather-related concerns recently caused a dip in US wheat crop ratings. However, the overall rating remains at a multi-year high.
Strong July Harvest Likely to Pressure Prices
Despite short-term support, the longer-term trend for wheat remains bearish. Since 2022, prices have been in decline, driven by increased production from top global producers.
Source: PSD
With adequate supply, prices have pulled back significantly from their 2022 highs. Most recently, prices have dropped 11% since February amid expectations of strong upcoming supply.
The May WASDE report projects US ending stocks for 2025–26 at 923 million bushels, citing slower expected exports. Additionally, a Reuters report noted that Russia has removed its minimum export price recommendation, potentially making US wheat less competitive globally.
Large carry-in stocks from the 2024–25 season are also expected to reinforce favourable supply conditions, limiting the potential for a sustained price rebound.
Options Market Reflects Diverging Price Expectations
Source: CME QuikStrike
Between May 16 and May 23, open interest in SRW wheat options shows a significant increase in front-month call options expiring May 30. In contrast, later-dated contracts show higher put option activity relative to calls.
This suggests that while near-term prices may rise, the market expects a reversal as the harvest progresses.
Asset Manager Positioning Remains Bearish
Despite a brief period of short covering, asset managers continue to hold a broadly bearish stance on SRW wheat futures and options. According to a Reuters report , funds resumed net selling by May 22.
Seasonal Patterns Reinforce Bearish Outlook
Seasonal trends over the past decade show an average price increase of 1.5% in May and 1.9% in June, followed by a decline of 3.6% in July. While the timing can vary year to year, the general pattern aligns with the expected harvest-related decline.
Hypothetical Trade Setup
With fundamentals pointing to a strong harvest and longer-term bearish outlook, wheat prices may remain under pressure after the current rebound. Near-term support from strong exports and weather-related uncertainty is likely to be temporary.
Options market activity and seasonal patterns support this view. As asset managers begin trimming their net short positions, wheat may continue to rally in the short term before resuming its decline.
Investors can position for this view using a calendar spread in CME micro wheat futures, which are sized at one-tenth of standard contracts. This allows for a cost-effective way to express a short-term bullish and long-term bearish stance.
A spread consisting of a long position on the July contract (MZWN5) and a short position on the September contract (MZWU5) is highly capital efficient and requires just USD 31 in margin. A hypothetical trade setup on the spread is described below:
The overall position reward-to-risk is 1.43x.
This spread consists of a market neutral trade at inception and deviation between the price difference between the two contracts will lead to potential gains and/or losses. As such, the position gains when: (a) Jul contract rises and Sep contract falls, (b) Both contracts rise and Jul rises more than Sep, and (c) Both contracts falls and Jul fall less than Sep.
Conversely, this position will result in potential losses when: (a) Jul contract falls and Sep contract rises, (b) Both contracts rise and Sep rises more than Jul, and (c) Both contracts falls and Sep fall less than Jul.
MARKET DATA
CME Real-time Market Data helps identify trading set-ups and express market views better. If you have futures in your trading portfolio, you can check out on CME Group data plans available that suit your trading needs tradingview.com/cme .
DISCLAIMER
This case study is for educational purposes only and does not constitute investment recommendations or advice. Nor are they used to promote any specific products, or services.
Trading or investment ideas cited here are for illustration only, as an integral part of a case study to demonstrate the fundamental concepts in risk management or trading under the market scenarios being discussed. Please read the FULL DISCLAIMER the link to which is provided in our profile description.

Wheat Futures - Bump to 593 and Possible BreakoutWheat has a solid base at ~540. Every time we have pushed to or above the red down sloping trendline we reverse to this level. This has formed a triangle that is reaching a decision point that may yield to a breakout of this low level and a push above the 600 level. Given that the price has held firm to the red trendline for so long a move above it will be a reason to keep an eye on it. If the price retests to the red trendline then it is cause to watch closer for a possible break above the 600 level. If a retest goes back to the 545 level then its more likely the price will continue to crab in this range.
I'd say that from this level the push to 600 is more than certain in the short term given the previous behaviour of the price from this level. Again, what is uncertain is whether or not we get a push beyond 600, and that is largely dependent on the retest. Worth keeping an eye on.
Edit: Its worth noting that on the 4hrly chart there is a double bottom that has been printed and a congestion zone following confirmation of the pattern has printed. Currently it has had a break and retest of the pattern. So it is likely that the move to 600 is already underway.

WHEATN2024 ShortWheat price did higher highs, RSI did lower highs, we have a bearish divergence.
Wheat daily RSI is overbought.
Fibonacci extension shows that it can $641, that corresponds to 1.618 Fibonacci.
Also we have the white lines that correspond to current supports, at $650 and $633.
Thank you.

Wheat and Fertilizer Futures: A Cash Cow for War Mongers In this layout I have Black Sea Wheat and Corn, Australian and Ukrainian Wheat, and 4 main Fertilizer (UREA) Futures.
Conflict and Wars are good ways for Financial Institutions like Black Rock and State Street Corp oration to make a lot of money. What better way than to destroy the wheat fields/silos themselves and profit at the same time?
These markets are built in blood and they are sitting on Advanced Fibonacci Blueprints showing who is really in control.
Volatility may be seen as many Russia pulled out of the Black Sea Grain Deal. Wheat supplies will undergo straining for the foreseeable future.

Black Sea Wheat futures SHORT to $250Futures for Black Sea Wheat are clearly on the downside due to fundamental reasons. Finally, Ukrainian Wheat is transported by ships and also from the Baltic Sea through Poland, Lithuania and Latvia. It is relief for many reasons like global hunger, stabilization of basic food prices etc. Emotion are playing a role here and market is on the optimistic side.

Ukraine is the 2nd largest....supplier of grains to the European Union. Most wheat crops are planted in fall and harvested in July (spring wheat is planted through March and should be largely in in the soil already).
Even though prices are shooting up, the total planted area is still about in line with with long-term trends. If tensions with Russia will not get resolved however, and the supply lines for fertilizers/pesticides break down further, then the real trouble begins next fall .
Update: France is already considering foot stamp cheques according to news out today.

WHEAT Futures Long OpportunityProspects for lower than expected acreage in 2019 could help firm the market, but demand still looks modest. Flooding can be an issue in some countries.
The short term trend is turning from bearish to neutral.
Wait for the breakout of 530.
Midnight moves KCWheat futures forced liquidity??Picture perfect stop hunt. Back on the rise? Huge potential here.
600% is the goal :D

1W Channel Up. Long opportunity.1D Channel Up with support at 528.40 within a 1W Channel Up with support (Higher Low) at 510.00. Any of those can be used as stops on longs with targets = 574.20 & 588.20.

WN2017 - July '17 Wheat FuturesAs the market made lower lows, the MACD indicator made higher highs. This is very powerful bullish divergence. Circled is where the MACD crossed over to the upside, further indicating bullishness.
Stops should be placed slightly below the most recent low of 429'4, which occurred on March 31.
Profit targets are at the Fibonacci retracement levels.
Target 1 - 459
Target 2 - 483
Target 3 - 503*
*Following the same pattern as the other upward movements would put price at this level on June 21, the summer solstice.

MW1! @ daily @ closed last 8 days higher, while every day
This is only a trading capability - no recommendation !!!
Buying/Selling or even only watching is always your own responsibility ...
.zip (with PDF`s) @ my Google Drive
Closings Bullish (32 Commodities)
drive.google.com
Best regards :)
Aaron

Wheat -- near long opportunityProbably soon there will be nice long opportunity, at least for correction. Closely watching & bought small part for medium term.

Wheat Futures, In demand.Todays close was in yesterdays demand. All the beans closed positive. Wheat will have a bounce back tomorrow depending on the open.

Buy WN2016 at 461 with a Stop at 449 and Target at 488.WN2016 after a long fall has recently formed a triple bottom and could be switching to a range trade or eventually an uptrend. We are buying at the low end of the range and aiming to sell at the high end of the range with a 2 to 1 Reward to Risk.


Kansas City Wheat Working on a bottomWe are reaching a place for a long term low. Looking at this expansion fork we see that the move has extended the same distance from balance as the previous low.
