10YR US Treasury Note Chart Fibonacci Analysis 052825Trading Idea
1) Find a FIBO slingshot
2) Check FIBO 61.80% level
3) Entry Point > 112/61.80%
Chart time frame:B
A) 15 min(1W-3M)
B) 1 hr(3M-6M)
C) 4 hr(6M-1year)
D) 1 day(1-3years)
Stock progress: A
A) Keep rising over 61.80% resistance
B) 61.80% resistance
C) 61.80% support
D) Hit the bottom
E) Hit the top
TN1! trade ideas

US 10 yr Treasury Note Chart Fibonacci Analysis 051925Trading Idea
1) Find a FIBO slingshot
2) Check FIBO 61.80% level
3) Entry Point > 111/61.80%
Chart time frame:B
A) 15 min(1W-3M)
B) 1 hr(3M-6M)
C) 4 hr(6M-1year)
D) 1 day(1-3years)
Stock progress: B
A) Keep rising over 61.80% resistance
B) 61.80% resistance
C) 61.80% support
D) Hit the bottom
E) Hit the top
Stocks rise as they rise from support and fall from resistance. Our goal is to find a low support point and enter. It can be referred to as buying at the pullback point. The pullback point can be found with a Fibonacci extension of 61.80%. This is a step to find entry level. 1) Find a triangle (Fibonacci Speed Fan Line) that connects the high (resistance) and low (support) points of the stock in progress, where it is continuously expressed as a Slingshot, 2) and create a Fibonacci extension level for the first rising wave from the start point of slingshot pattern.
When the current price goes over 61.80% level , that can be a good entry point, especially if the SMA 100 and 200 curves are gathered together at 61.80%, it is a very good entry point.
As a great help, tradingview provides these Fibonacci speed fan lines and extension levels with ease. So if you use the Fibonacci fan line, the extension level, and the SMA 100/200 curve well, you can find an entry point for the stock market. At least you have to enter at this low point to avoid trading failure, and if you are skilled at entering this low point, with fibonacci6180 technique, your reading skill to chart will be greatly improved.
If you want to do day trading, please set the time frame to 5 minutes or 15 minutes, and you will see many of the low point of rising stocks.
If want to prefer long term range trading, you can set the time frame to 1 hr or 1 day.

TN Fib FrameworkHigh Timeframe Fib Framework for the TN contracts which appear to be following a very simplistic Fibonnachi path

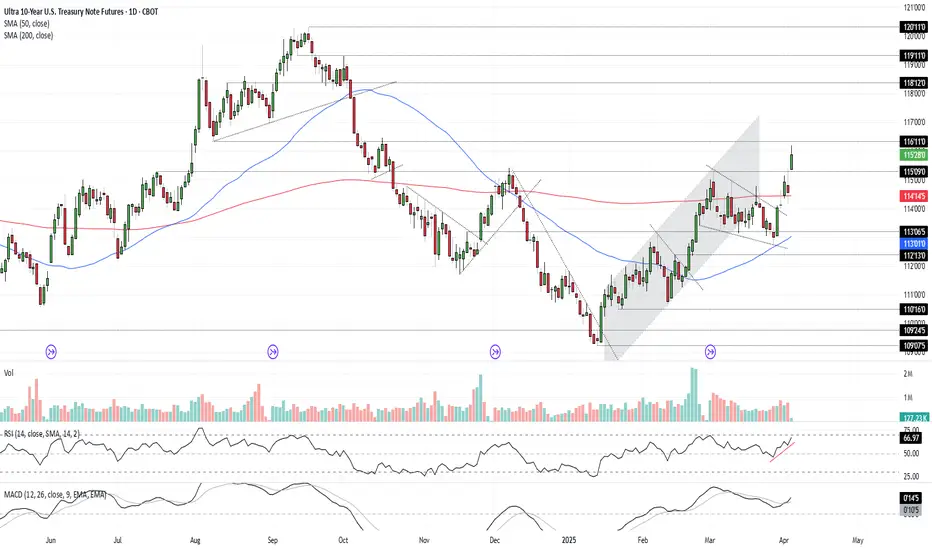
Bonds Don’t Lie: The Signal is ClearU.S. 10-year Treasuries are a crucial cog in the global financial machine, serving as a benchmark borrowing rate, a tool for asset valuation, and a gauge of the longer-term outlook for U.S. economic growth and inflation.
As such, I keep a close eye on 10-year note futures, as they can offer clues on directional risks for bond prices and yields. The price action over the past few days has sent a clear and obvious signal as to where the risks lie: prices higher, yields lower.
Futures had been grinding lower within a falling wedge for several weeks but broke higher last Friday on decent volumes following soft U.S. household spending data. It has since extended bullish the move, reclaiming the 200-day moving average before surging above key resistance at 115’09’0 after Trump’s reciprocal tariff announcement on Wednesday.
RSI (14) is trending higher but isn’t yet overbought, while MACD has crossed the signal line above 0, confirming the bullish momentum signal. That favours further upside, putting resistance at 116’11’0 and 118’12’0 on the immediate radar. For those who prefer it expressed in yield terms, that’s around 4% and 3.8% respectively.
Good luck!
DS
10 yr Treasury note Stock Chart Fibonacci Analysis 022825Today's chart analysis uses the Fibonacci fan line and extension.
Today, the 10-year treasury note touches the 114/423.60% of the 1st wave, and then U.S. stock markets rebound from falling in these days. Accordingly, QQQ has a nice 497/61.80% support level.
But if 10-year treasury note go over this resistance 114/423.60%, the next target price is 119/423.60 of the 2nd uptrend wave. The US stock market continues to fall to the next support level.

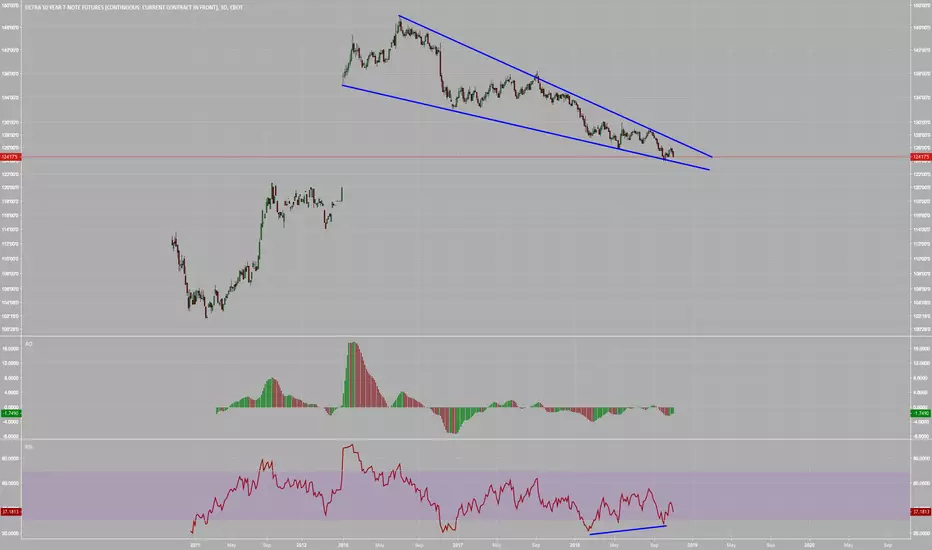
Treasury yields at a crossroads? The implications for marketsThe long end of the US Treasury curve has been influential for FX markets recently. The rolling 10-day correlation between US 10-year yields with the DXY, EUR/USD, GBP/USD, and USD/JPY is either strongly positive or negative. Even gold shows a notable -0.73 correlation, highlighting the influence of long bonds on broader markets.
Given the inverse relationship between bond yields and prices, it’s no surprise that the correlation between 10-year yields and 10-year Treasury futures (shown in orange, left-hand pane) has been nearly perfectly negative over the past two weeks.
In terms of directional risks for yields moving forward, the right-hand pane showing US 10-year Treasury note futures is instructive. The price remains in a downtrend, repeatedly rejected since being established October. If this trend persists, it signals lower prices and higher yields.
That said, with the bullish hammer candle from the lows last week, coupled with RSI (14) and MACD which are providing bullish signals on momentum, you get the sense we may be in the early stages of a turning point.
If we were to see the price break the downtrend, resistance may be encountered at 113’00, a level that’s been tested from both sides in recent weeks. If that were to give way, it points to an environment of a softer US dollar and kinder conditions for longer duration assets and commodities.
Good luck!
DS

TN! 10 Year Note Futures Bull ScalpLooking for a pullback into bear channel after the strong selling of 10-year bond futures from Friday's job report. Yields jumped today, so I would think there's some buyers coming into US session. At least there's a decent chance.

Buying Opportunity in T-Notes? After putting in a bottom in mid-October, T-notes have rallied sharply higher. Patient bulls have been afforded few opportunities to enter the contracts on a pullback, but that may soon change. Pullbacks are a healthy part of any sustained rally, as they allow market participants to take profits from longer held positions, and reallocate capital in the direction of the prevailing trend.
Fundamental Snapshot :
T-Note prices are inversely related to yields - meaning that as yields decline, the price of T-Notes will rise. After the last Fed meeting, Chair Powell suggested that the Fed may be cutting rates as much as 3 times in 2024. As displayed on CME’s FedWatch Tool below, the market is pricing in a 77.2% probability that the first rate cut may come as soon as March. If that materializes, T-note prices should continue to press higher.
Talkin’ Technicals :
The white line on the bottom of the chart labeling short-term bearish divergence on RSI in the bottom indicates that the market is making successive new highs on decreasing momentum, and that the market remains in overbought territory. Meaning that the current rally is effectively running out of steam. Furthermore, volume has steadily decreased since the previous high. If there are no more bulls willing to enter the market, it will likely result in a pullback. A pullback on price will force current bulls to liquidate long positions to capture profit, and afford new bulls to enter the market amidst the correction. Fed policy is a major function in establishing the longer-term trend in T-notes and bonds. By lowering rates in 2024, one should expect both T-notes and bonds to perform well pricewise.
Check out CME Group real-time data plans available on TradingView here: www.tradingview.com
Disclaimers:
CME Real-time Market Data help identify trading set-ups and express my market views. If you have futures in your trading portfolio, you can check out on CME Group data plans available that suit your trading needs www.tradingview.com
*Trade ideas cited above are for illustration only, as an integral part of a case study to demonstrate the fundamental concepts in risk management under the market scenarios being discussed. They shall not be construed as investment recommendations or advice. Nor are they used to promote any specific products, or services.
Futures trading involves substantial risk of loss and may not be suitable for all investors. Trading advice is based on information taken from trade and statistical services and other sources Blue Line Futures, LLC believes are reliable. We do not guarantee that such information is accurate or complete and it should not be relied upon as such. Trading advice reflects our good faith judgment at a specific time and is subject to change without notice. There is no guarantee that the advice we give will result in profitable trades. All trading decisions will be made by the account holder. Past performance is not necessarily indicative of future results.

10-Years Treasury Note: Weekly Head & Shoulders + Daily TriangleBearish continuation head and shoulders.
First entry on January 7, stopped on 13 January, second entry on February 4 on breakout confirmation of the daily triangle.
Risk / Reward 4.5
Potential target 135

10YR BondsMarkets bottom only through the 10 year bonds $TN forming a bottoming formation at 139, which roughly corresponds to 10YR interest rates topping at 2.2%. Might take a good week to churn out. Otherwise, adieu markets.

TNThe rally out of Oct 21 low - is it an evolving impulse, or a correction in a larger downtrend?
I think more likely it’s a fresh impulse - in which case it’s working on Wave 4 of 3.

treasury notes forecast thursday expecting a move up here
sep 17 a move higher, then a decline
good for a long scalp

TN1 IN 30MIN💰Hi friends
the graph of this market most likely shows an upward trend after market opening .


2h TO TRADE - VERY STRONG SUPPORT TO WATCH OUT - TN1! - 30MNThank you for your likes and shares! Much appreciated!
_________________________________________________
The market has shown amazing entry point for a long trade down. The formation of a large wick followed by volumes later on gave us very profitable trades today.
The support line is very strong and the market failed to break it . This is it for today!
Another tentative might come in the next 2H but for the moment any entry done will be in the long direction. The probability of seeing the market rebounding on the support trend line being very high.
Trade from Monday and keep an eye in this strong support line.


Channel Down on 4HClear Channel Down on 4H after a 128'22 Lower High. TP 127'07 and 126'40 in extension.
