T-Bonds good value30-year bonds are yielding 3.2%, this is not a bad value if the Fed cuts long term growth, that's why everyone is parking their money here at this level. Now, if they pivot and we enter "stagflation", run away.
Buying TMF (3x TLT) at this level
NFA DYODD
ZB1! trade ideas

After the clarity of several indicators, After the clarity of several indicators, it is expected that the balances will correct after a decline that lasted more than a month. I noticed a discrepancy in the strength of sellers, which is evident in the MACD indicator.

T-BOND FUTURESThe public treasury broke the lowest order area and is also a very strong support area and this is evidence of the continuity of the landing

T-Bond Futures Falling T-bond futures have been on a steady decline since the March 2020 highs and have entered oversold territory. We broke below major trendline support going back to January 2000 and are trading at the lowest levels since January of 2014. We have the FED meeting over the next 2 days, and their rate hike decision is expected to be 75bps with an 82% probability, and from there we will get an indication if this market continues to selloff or if we can establish a floor in the market.

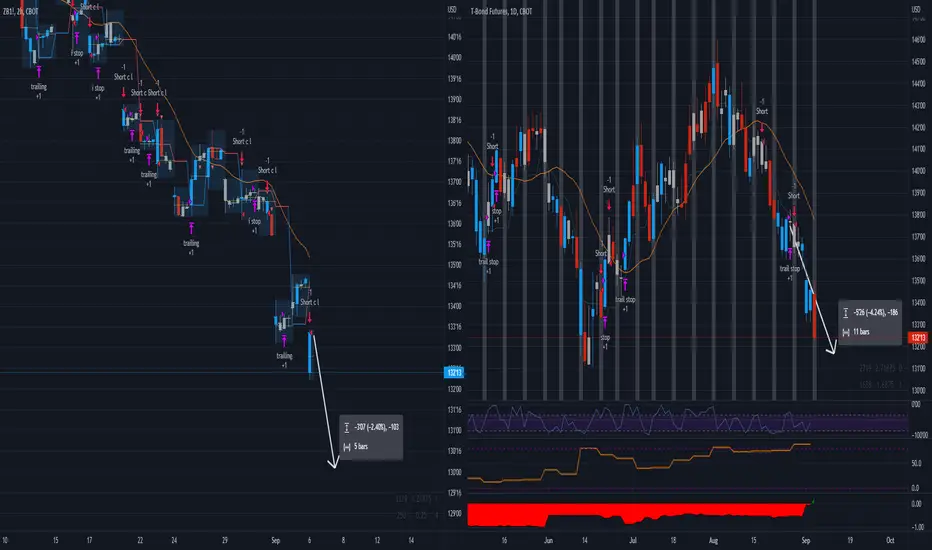
Clean idea in zb after breaking the support with volume we can wait the market until return to make pullback and we sell there CBOT:ZB1!


Bonds 5 min opening breakout strategybonds and CBOT:ZN1! and CME_MINI:NQ1!
most of the times continue the short trend on a break of a 5 min bar in the first half hour after US market opens
however most markets will first wait for an intraday double top (or rally to 50% level) for a short trend continuation...
daily chart clearly bullish on bonds i am always looking for short setups...

T-BOND FUTURESAfter a strong climb reversed its direction and came down strongly and achieved strong bottom targets and currently close to strong demand areas breaking it is the biggest selling opportunity

Beginning of September is a Shorting HeavenSee my setup list almost all commodities are in short setups: www.tradingview.com
I like to add to short positions on the 5 min opening range breakout (9.30 am eastern time) on Nasdaq and Bonds.
Low Risk high reward when exiting in the afternoon, or simply with a trailing stop above prior two days high.
Target new lows.
30Yr Bonds Long & Short Plays In the ChannelIn this update we review the recent price action in the US30Yr Bond futures and identify the next high probability trading opportunities and price objectives to target

ZB achieves a significant Support areaZB formed an obvious reversal pattern (Head and Shoulders) in the last months, taking the pattern's MA 209 As a Neckline. the break of it kept moving the price lower. Breaking the support area you'd probably take the price to lower until achieving the potential target which is equal to the distance between the Head and the Neckline.

ZBwe can take a short sell inside a correction mouvement,and we can wait also the end of the correction to buy.


The breakout on bonds?Bonds getting a bid after US housing data showing a recession. If the breakout is real we shouldn't see 139 again. This may be beginning of the "rush to safety". Nothing confirmed as of yet.
www.cnbc.com

Support level for Bondsshould hold if bonds will remain in an uptrend. Minimum Target 150 but could get to 154 for next leg.

We recommend buying, especially if the channel is brokenWe recommend buying, especially if the channel is broken, and the reason is the price breaching an important resistance, in addition to a clear increase in the number of mixed buyers through indicators. (ZB)

T-BOND FUTURESHe made a very strong rise and creativity, but today he broke the price canal hard and it was a very strong sign.

We are waiting for a strong rise when the descending trend line We are waiting for a strong rise when the descending trend line is broken
traget1 / 141$.
target2 / 142$.
I advise any trader to trade the ZB market a little bit until the trend line is broken to buy

ZB is bearish !accroding to my analysis, there is i high probability of a decline towards the 141'01 level

ZB T-BOND 4Hdear traders and investors as we can sell this trend is been retested after the breakout appears finally and give us opportonities to sell and the target will be in 136.04


ZBZB , waiting for mitigation & sweep liquidity to short it from the supply zone our target will be previous low .

30-Year Bond Trendline Back-TestMany are considering the Fed actions as a pivot, but the Fed could look to to continue to tighten policy and maintain a hawkish approach. The 30-year bond futures have been in a steady uptrend going back to 1999, holding strong trendline support, until April when we saw a break below the trendline. This week, we are looking to back-test this breakdown level which now acts as strong resistance after the bounce off the 200-day moving average. As we continue to retest these strong levels, keep an eye out for the Jobs data coming out Friday to give a catalyst to the bond market back above the trendline or back towards the 200-day moving average.
