Long Term Bonds Affect High Multiple Stocks the MostComputer models of future cashflows help determine prices of tech stocks. Values are lowered when bond rates go up. If the bond chart on the left doesn't recover, then NVDA could go and fill the lower gaps.
ZB1! trade ideas

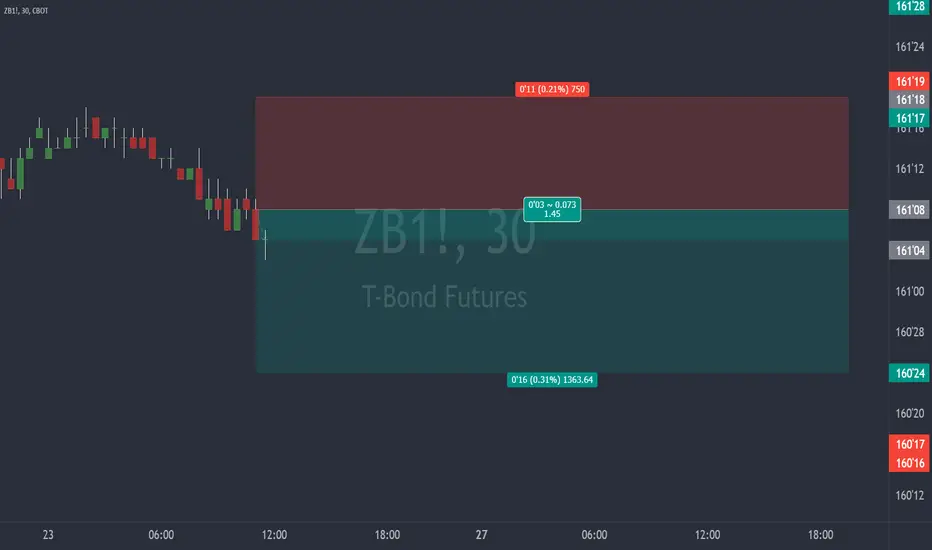
treasury bonds 30 years ANALYSISPOWERFUL ANALYSIS if the market breaks this area with an interesting volume probably we will see the market down to 155,18

high probability to rise on the ZB I think the ZB will reach 166' but don't enter with too many contracts good luck guys


T bond ZB is going upa small trade on the market
ZB is showing a really good buy signal - time frem
This is an article, not financial advice, always do your own research.
If you have any questions, you can write it in comments below, and I will answer them.
And please don't forget to support this idea with your like and comment, thank you.
Buy Now ZB1 With probability 98%Welcome Back. Please support this idea with LIKE if you find it useful. ***


ZB treasury bond 30 years set uphave you ever used pitchfork before, a very powerful indicator if you know how to use it


T bond ZB is going down Sell Zb with haight probability more than 90% l am not using fondamentale analiste l am using technical analysis.

ZB treasury bonds are falling down, daily ZB T bond 30 falling down, you have to search only for sell signal,

/ZB Could Go to 159. The NQ Wouldn't Like ThatA break of 116'16 could see the /ZB go all the way down to 159. The NQ stocks don't like rising yields.

ZB is bearisha small trade on the market that I love the most
I advise you to specialize in treasury bonds I know it is a difficult market but if you master this market you will become rich very rich :D
$ZB_F: Uptrend signal activeWe now have a good signal here indicating bonds can rally substantially in the coming weeks. I've bot a bull call spread to capture the upside here, expiring on Dec 10th, for the March contract.
It allows me to fine tune risk and maximize gains if the trade works in a way that an outright futures long position wouldn't. If you can, join on Monday on dips, if making a higher high, be ready to pay up. It's a good hedge for your portfolio in case of carrying long oil positions like I do.
Cheers,
Ivan.

Two possible paths the chart may follow.EN:
We have a downtrend, the chart goes down into the downtrend channel,
the green and red horizontal lines are a 4h frame S / R which means they are strong for a 1h frame.
- The chart may continue to fall if it fails to break the red downtrend channel (red trend lines).
- The chart may go up in case it could not break the horizontal green support line, also if it breaks the red resistance area and the top of the bearish channel (upper red trend line)
wait for confirmation.
FR:
Nous avons une tendance baissière, le graphique descend dans le canal baissier,
les lignes horizontales vertes et rouges sont une trame S/R de 4h ce qui signifie qu'elles sont fortes pour une trame de 1h.
- Le graphique peut continuer à baisser s'il ne parvient pas à casser le canal rouge de la plage (lignes de tendance rouges).
- Le graphique peut monter dans le cas où il ne pourrait pas casser la ligne horizontale de support verte, également, s'il casse la zone de résistance rouge et le haut du canal baissier (ligne de tendance rouge supérieure)
attendre la confirmation.

ZB1! Analysis EN:
There is a trend reversal in the intersection area of the two parallel channels, with the chart continuing to follow the rising bullish channel , the red and green horizontal lines are S / R areas.
1 - In case the chart could not break the green support area , it may go up until it reaches the horizontal red resistance line, and if it does break it, we will manage to have a big move to the top.
2 - In case the chart breaks the horizontal green support line, it may go down until it reaches the bottom of the green channel, or the green support area , in case it breaks the trend of the channel , we can have a big downward movement.
Wait for confirmation.
FR:
Il y a un renversement de tendance dans la zone d'intersection des deux canaux parallèles, le graphique continuant à suivre le canal haussier remontant, les lignes horizontales rouges et vertes sont des zones S/R.
1 - Dans le cas où le graphique ne pourrait pas casser la zone de support verte, il peut monter jusqu'à ce qu'il atteigne la ligne horizontale de résistance rouge, et s'il la cassait, nous pourrions avoir un grand mouvement vers le haut.
2 - Dans le cas où le graphique casse la ligne horizontale de support verte, il peut descendre jusqu'à ce qu'il atteigne le fond du canal vert, ou la zone de support verte, dans le cas où il casse la tendance du canal, nous pouvons avoir un grand mouvement vers le bas .
Attendez la confirmation.

ZB Bullish Setup 12-06-21A little scalp in the market on a Monday for a 2:1 R-multiple. I am not risking more than a percent given it's Monday and price did not dig into the price zones I was expecting, I demand my price. The setup in NY open is a Turtle soup and OTE setup.
No USD news High or Medium today.

Reaping My RewardsThis is just to motivate myself to trust the process. Pure price action using the right tools to dissect the market is key.

ZB Bullish setupMy weekly setup for the 30 yr Bonds panned out. Although price didn't dip into the PD Array I was eyeing but I was quick to recognize the setup when it happened and that was the way price reacted to a short term low (previous day's NY session low).
A Turtle soup buy setup and 5 OTE setups were available an hour after NFP release.
Key take away: Wait for the OTE levels to be reached, monitor the lows if your bias is Bullish, PATIENCE.

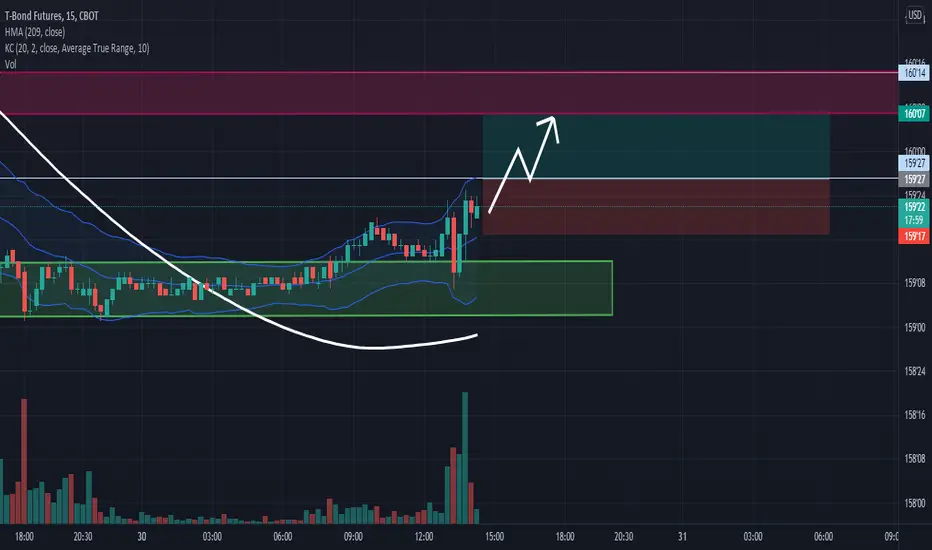
ZB short ZB is showing a really good sell signal, having a wick that long with such rejection with that volume is really an amazing signal for sell
in addition the wick is on the three HMAs
so SELL

T Bond Futures LONG ZB is breaking not one or two supports but three at once, one of them is really ancient.
we can wait for pullback on the 162'09 area where price surly will find it hard to break, it's just gonna use it as a pullback area, so it rises in the US session, as GOLD prices rise we can see that ZN and ZB are only showing sings off an uptrend, in addition that DX1 is dropping really well

Why are Bond Futures pushing up?I dont have the fundamental reason for why bonds are going up but I can report on the technicals.
We are breaking the trendline with volume while pushing up off a fib.
Also the oscillators look great as well with convergence to the upside.
Fed is supposed to taper so I dont know hoe reliable this analysis is.
Forgive me.
