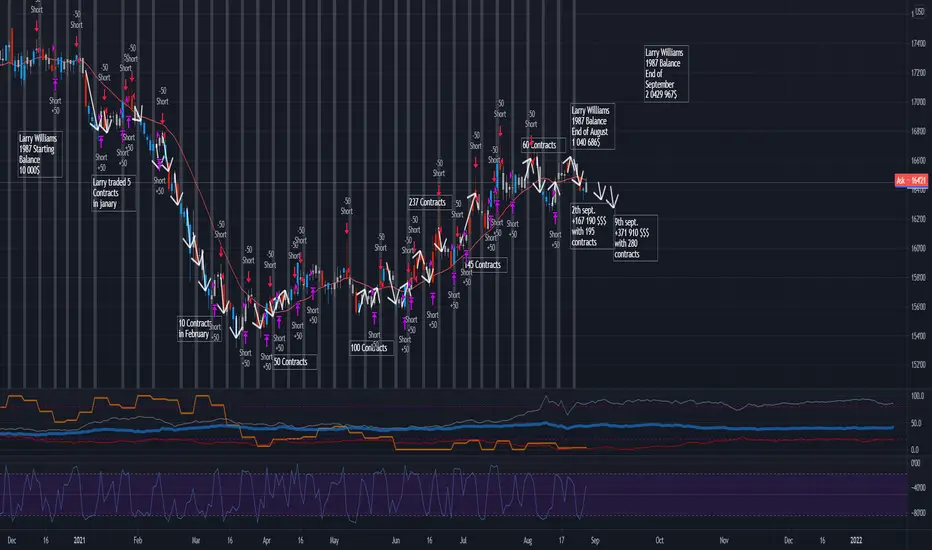
Bonds Strategy go short if PercentR is above 15 No investment advice but Larry Williams traded the Treasury Bonds pretty good in 1987 by relying on indicators like PercentR
Look for his trading record where he turned 10k into 2 mil by end of september 1987 with trading bonds and S&P 500.
On the Chart you can see his 1987 entry dates but applied on a 2021 chart, so there are plenty of opportunties to apply his strategy this year.
Obviouly the short entries if PercentR indicator was above -17 are only one part of the equation.
Position sizing is key, larry started with 1 contract but quickly went to 5,10, 50, 100 contracts to archive a 10.000%+ performance.
Going Long if PercentR is below -80 is also an option but first there needs to be an uptrend in place.
Back in 1987 larrys biggest winning trade was 1328$ profit per contract (280 contracts closed on 9th september)
Keep in mind that his biggest loosing trade was with 400 t-bonds on 19th october (629k loss)
To avoid bigger losses any strategy should be seen as a setup on a daily chart but then on the lower time frame you can place a much more reasonable trade with a pre-defined stoploss level.
ZB1! trade ideas
/ZB Overbought at Resistance/ZB right at price and 50 SMA resistance. With the jobs report Friday, this could drift lower.


Bond Curve - Long End where Fiscal Funding is FundedThe Dollar has very large Trendline support as well as the 50SMA.
The pressure this exerts can be extreme.
The rising trend indicates the potential for an extreme move
in the Rate of Change (ROC) once again.
The move will be very strong as 2 events are in play:
1. DX Hoarding
2. Net Drains @ FED and US Treasury
* Of Note, the future of stimulus was made clear this week as California
announced their intent to provide Universal Basic Income at a flat rate of
$1000/per person.
YCC remains active ahead of the September Federal Reserve Policy Statement.
Frankly, a non-event imho.
Since the end of March 2021, the 10Yr has dropped from 1.74.
The question being asked - What is the Bond Market indicating?
Answer - the FED smacked their noses for attempting to call them out on their
endless BS.

Weekly Analysis 08/23 - 08/28HTD Dollar looks like Bullish Setup, aiming for the Old Daily swing Highs, while US Equities is at overbought condition and possible SMT Divergence with Dow showing unwillingness to go higher while SP500 and NAS move higher. The Bonds are not really clear but I would say it's Bullish if I was told to walk the plank or project the Bonds.
No high impact news on Tuesday, but there is medium impact for USD on Wednesday then Thursday high impact USD news at 8:30 am est. It's going to be an interesting week, I see opportunity to learn price action like never before.
Stay safe dear viewers!

FOMC 08/18/2021My bias on US Equities is Bearish pre-news release. I read in Price action
1. Bearish Shift
2. OTE
Looking for OTE short setups at the news release and 5-30 mins after.

Bonds Trade Plan
This is the third post about Bonds in row.
This is important because what it says about the market in general - if you don't understand look at a chart of Ultra Bonds /UB (ultrabonds) in March of 2020 - then you'll understand.
All the cash aside being injected, things are slowing down again.
So here is actionable plan if my thesis is correct - long at the 50% retracement and out at .78% which is at the top of the triangle.
Bonds are raging on the Sunday open - we may straight to the 78% retrace without passing go and collecting $200.
FWIW - I'm only right 62% of the time

Bonds - Volume Profile and Fibs
Interesting chart I'm looking at - I'm sure its coincidence.
Old VPOCs and Fibs between them.
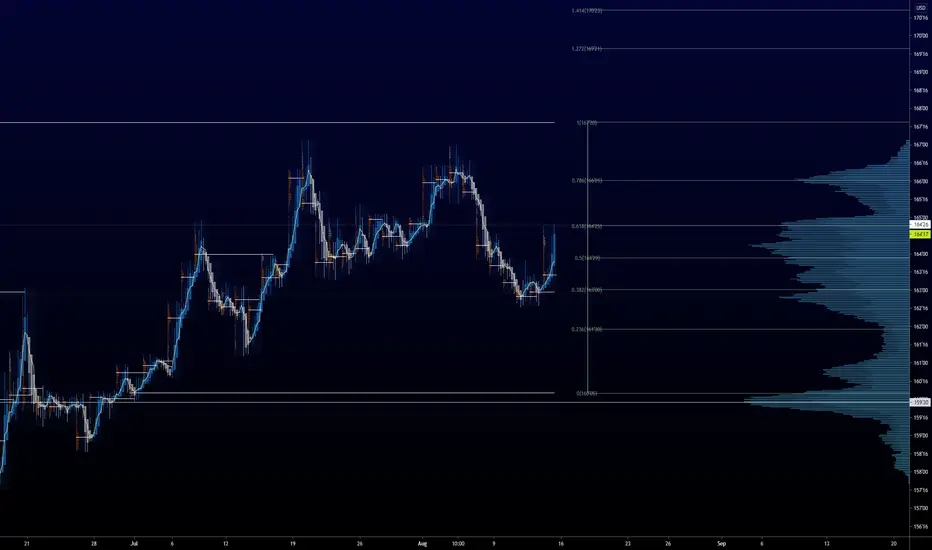
While the SPX is rallying the Bonds wouldn't be out
The Bond market staged its own rally today while SPX reached all time highs.
This is will be the third time Bonds have come up on this level.
Break the VPOC above and we're into the back into Covid maelstrom zone.
Most likely this gets breached no matter what - its there and it will scare the children - and be used for whatever purposes that need to be served.
One thing for sure - this will cause a sell-off in equities.
Trade Review 08-13-2021Awesome to see the setup pan out. Price action is the same on all class assets. Liquidity, Break in structure, OTE pattern recognition that's it!
ICT OTE Series is how I learned this stuff for free.

August Could Be The Start Of A Bumpy Period In MarketsLast week, in an interview on CNBC, legendary trader and investor Stanley Druckenmiller sounded an alarm. He told reporters on the financial news network, “I can’t find any period in history where monetary and fiscal policy were this out of step with the economic circumstances, not one…I will be surprised if we’re not out of the stock market by the end of the year, just because these bubbles can’t last that long.” He went on to say there is a “raging mania in all assets.”
Jackson Hole could send ripples across markets like in 2020
The market expects the beginning of tightening
The delta variant provides another excuse
What does “transitory” really mean?
Fasten your seatbelts for a very rocky ride in markets- The dollar and bonds have become risk barometers than the VIX
In 2021, cryptocurrencies rose in a parabolic move to record highs. Even though they corrected, prices remain far above last year’s levels. The explosive rallies reflect the decline in the faith in government and central bank control of the money supply.
The tidal wave of central bank stimulus and tsunami of government stimulus has weighed on fiat currency’s purchasing power. The stock market has risen to all-time highs because, for many investors, TINA, there is no alternative to stocks. As Leon Cooperman, the ex-Goldman Sachs partner and hedge fund manager, once said, “Buying bonds amounts to picking up pennies in front of a steamroller.” Commodity prices are trending higher in a bullish relay race that began at the March and April 2020 lows. Gold reached a record peak in August 2020. Grain and oilseed prices rose to eight-year highs earlier this year. In May, lumber, copper, and palladium reached record peaks. NYMEX crude oil futures recently rose to the highest level since 2014. Natural gas traded to highs above $4 for the first time since the peak winter season in late 2018. The last time natural gas was north of $4 per MMBtu was in 2014. Ethanol moved to its highest price since 2014, and coal to a level not seen since 2008. Last week, coffee futures traded at over the $2.15 level for the first time since 2014 before correcting. Commodities, stocks, cryptocurrencies, and other asset prices are trending higher. Residential real estate is not only a seller’s market, but prices have moved to insane levels in some regions. The bottom line is accommodative monetary and fiscal policies have planted turbocharged inflationary seeds, and markets have responded.
Stanley Druckenmiller knows it is not a question of if significant volatility grips markets across all asset classes, but when it occurs. August 2021 could be a very bumpy period in markets as the traditionally volatile fall season is on the horizon.
Jackson Hole could send ripples across markets like in 2020
The markets are anxiously awaiting word from the US central bank at its annual August gathering in Jackson Hole, Wyoming. Aside from fishing, hiking, and other outdoor activities, the Fed tends to use the offsite experience as an occasion to roll out monetary policy changes. Even though the 2020 summer meeting was virtual, the Fed took the opportunity to introduce a not-so-subtle change in inflation targets, shifting them from 2% to an average of 2%.
After the highly inflationary CPI data over the past three months and a slew of other validations that the economic condition is far above the “target,” the Fed’s tone changed. At the recent meetings, the rhetoric became subtly more hawkish than dovish. However, this week, the central bank took a dovish step back as COVID-19’s delta variant is causing infections to rise. The variant could be a convenient reason for the Fed to maintain the accommodative status quo.
The market expects the beginning of tightening
Recent Fed minutes told markets the central bank debated whether they would begin tapering quantitative easing with mortgage-backed securities or government bonds. When the tapering starts, the Fed Funds rate hikes will eventually follow.
The subtle change in the rhetoric increased market expectations that tighter credit is on the horizon. However, the market does not always get what it expects, and the Fed and US Treasury are notorious doves since 2008.
The delta variant provides another excuse
If the central bank digs deep into the excuse box, which sits next to the toolbox full of accommodative tools, it may come up with the rising number of COVID-19 delta variant cases as justification for the status quo. The powers in Washington DC will not mind as Democrats desperately want to hold onto and even expand the majority in the House of Representatives and the Senate. Liquidity and stimulus continue to prop up the economy, but the flood of the pair comes with a steep price tag.
If the Fed decides to delay tapering QE or set a schedule to increase the Fed Funds rate from zero percent, it will only push off the inevitable. The bottom line is that artificially low interest rates and $120 billion each month in debt purchases are transitory policies to stabilize economic conditions.
What does “transitory” really mean?
The Fed’s mantra in 2021 is “transitory” when describing rising inflationary pressures. After the May CPI data, all the focus turned to lumber prices and skyrocketing home prices. In the wake of the June CPI, bottlenecks in the supply chain causing a semiconductor shortage and lack of supplies of new and used cars were thrust to the center of the excuse stage.
Meanwhile, markets have been in an inflationary relay race to the top, with one asset passing the baton to the next. The stock market remains near record highs. Cryptocurrencies exploded, reaching incredible peaks in April and May, which is a direct challenge to the central bank and government control of the money supply. Commodity prices have been a merry-go-round of increasing prices. Real estate levels are out of this world. My wife and I bought a new home in late 2016. This week, smaller houses on our block were selling at over 100% above the price we paid.
“Transitory” means temporary, and that a condition will pass. The Fed refused to define its measurement period for the “average 2% inflation rate,” calling it “discretionary.” Uncertainty is growing, and markets appear ready to respond.
Fasten your seatbelts for a very rocky ride in markets- The dollar and bonds have become risk barometers than the VIX
The price of any asset is always the correct price because it is the level where buyers and sellers meet in a transparent marketplace. The Fed may control short-term interest rates via the Fed Funds rate, but long-term interest rates reflect the market’s perception of credit. Ironically, the bond market has been taking on the Fed since August 2020.
In a series of counter-intuitive moves, the US 30-Year Treasury bond futures fell from 183-06 in August 2020 to a low of 153-29 during the final week of March while the Fed purchased an average of $120 billion each month in debt securities. As inflation data began to make the Fed think about tightening over the past few months, the bonds have risen, reaching the most recent high at 167-04 in mid-July. The bond market has been moving contrary to the central bank’s signals with the futures near the highs at just below the 165 level as of July 30.
Meanwhile, the dollar index reflects the US currency’s value against other world reserve foreign exchange instruments. Since the euro is the second-leading reserve currency, the dollar index has a 57.6% exposure to the European currency. The dollar index tends to move higher and lower with interest rate differentials. In the wake of last year’s pandemic, the rate gap between the dollar and the euro narrowed substantially.
As the weekly chart illustrates, the dollar index fell from its highest level since 2002 at 103.96 in March 2020 to a low of 89.165 in early 2021, a drop of 14.2%, a substantial move for the US dollar. Since May, the index rallied, reaching the 93.195 level in July. The dollar index was at just over the 92 level on July 30. The index fell after the July FOMC meeting when the central bank appeared more dovish than the prior month.
The high in March 2020 was a flight to quality during the worst period of asset liquidation caused by the pandemic. The decline came as US rates fell. The latest rally is on the back of the prospects for rising US rates compared to European rates and the potential for volatile markets over the coming weeks and months. The dollar and bond market are likely to reflect volatility better than the VIX index. The VIX reflects implied volatility of put and call options on S&P 500 stocks. Since market participants tend to panic during downside corrections, the VIX rallies when stocks fall. However, the stock market’s rise could be a symptom of inflationary pressures where all asset prices are rising, and that could continue given the tidal wave of central bank liquidity and tsunami of government stimulus.
Even if the Fed bites the bullet and tightens credit, the process will be laborious. The central bank does nothing quickly unless it faces an unprecedented event, as we witnessed in 2008 with the financial crisis and 2020 on the back of the pandemic. Going from hawkish to dovish is a short-term affair while reversing course to a tighter approach to credit is done at a snail’s pace, in the interest of “market stability.” Meanwhile, with the 2022 midterm elections on the horizon and a green and progressive agenda in Washington DC, the spending will continue. Government stimulus in the trillions overwhelms any tweaks the Fed may make over the coming months.
The price tag for inflationary policies is massive. The market is waiting for the Fed to unwrap its plans at the August Jackson Hole event. The FOMC got a lot more inflation than it bargained for when it boosted its target to an unknown and unmeasurable “discretionary” level last year. Fasten your seatbelts; markets are in for a wild ride over the coming weeks and months. The fall tends to be a volatile time in the stock market. Corrections in 1929, 1987, and 2008 came during the fourth quarter. Follow those trends as they are your only friend. The central bank and government policies may have been friendly for markets since the early 2020 lows but feeding the inflation beast with liquidity and stimulus is like giving bigger fixes to a junkie. According to Stan Druckenmiller, a rude awakening could be on the horizon. I can’t disagree, as all the seeds of financial insanity have begun to bloom. Either raging inflation or raging stagflation would roil the markets, and one of the two conditions seems unavoidable.
We could look back at August 2021 as the beginning of an unprecedented and volatile period in markets. Fasten those seatbelts, hedge your bets and investments, and prepare for a head-spinning ride. It is far better to be safe and ready than unprepared and sorry when it comes to your assets.
Get free early access to articles using the designated link below. Sign up for the Monday Night Strategy Call using the link provided below.
Trading advice given in this communication, if any, is based on information taken from trades and statistical services and other sources that we believe are reliable. The author does not guarantee that such information is accurate or complete and it should not be relied upon as such. Trading advice reflects the author’s good faith judgment at a specific time and is subject to change without notice. There is no guarantee that the advice the author provides will result in profitable trades. There is risk of loss in all futures and options trading. Any investment involves substantial risks, including, but not limited to, pricing volatility, inadequate liquidity, and the potential complete loss of principal. This article does not in any way constitute an offer or solicitation of an offer to buy or sell any investment, security, or commodity discussed herein, or any security in any jurisdiction in which such an offer would be unlawful under the securities laws of such jurisdiction.

Mega crash set up of a lifetime!Tomorrow we are looking at a -400 point drop in SPX and 40+ on VIX. Thereafter, things will trade turbulently for a while so take your profits and stay in cash till PM’s move. The T-BondChart has been signaling this set up for a month - I used it as a timing mechanism by comparing the 2020 crash with current trends in my own style of Charting.

Long Bonds... and here's why?
As the stock market is blowing up its been the Bond Market that been rising as of late.
This is a chart I wished that I had seen sooner.
Clearly the market is saying hey maybe things aren't as great as we think and maybe we'll just put our money in low yield bonds rather than risk.
This backed off with rally this week but if you look at the direction and you think that we aren't going to push back what is VPOC and least touch it I would be surprised.
This means more uncertainly in the stock market so we might go now where quick from here as equity is distributed and or possibly a significant move downwards.
Hard to see the markets climbing higher with more conviction from the Bond market. However looking this profile even if everything is going to be ok - there going to scare the market - this a daily chart so this could be a couple weeks.
This visible point of control (pink line) runs there for about two years and that was deemed support.
Its not coincidence that there a a VPOC at the top and the bottom - this indicated to the market this is the turn. Its perfect if you know what look for - and that is the thing about bonds they do a good job of ticking back to the previous days VOC to strike it out.
If you don't strike it out - it means it may be revisited.
So I think you can go long bonds or TLT - maybe this could be a pretty good Iron Condor or straddle in the options market as most likely Bonds will sit here for a while they figure it out.
While in the US there has been growth and inflation this not true in the rest of the world. This is what it boils down too - so until growth picks up outside the US the markets will stall or at risk. Of course putting Covid behind would go long way.
There is a great video attached that explains what's going on the bond market from Jeff Snider. If you really want to know what's going out in broader scope it's incredibly informative.
www.youtube.com

Bonds - An Assured Negative Negative Return As M2 plateaued during 2006 / 2007 / 2008 - we saw an aggressive deflationary collapse.
A far more insidious Deflationary Event is approaching.
The absence of Collateral, A shortage of T-Bills, M1+M2's sudden reduction in May,
Geo-Political Risks (Extreme), Budgetary Crisis, Stimulus Bill(s) Passage Risk, the
End of the Moratorium on Mortgages, Rents, Subsidies - Jobless claims rising, Wages
rising and many more crosscurrents creating an undertow the Federal Reserve suggests
are "Transitory" with respect to "Inflation" with ZERO discussion of Health of their "System."
None.
Very ominous warnings appear and are ignored in this unusual environment.
Protection is bought every day, even though the VIX is trading a Large Daily Sell, Intra-day
there are clear signs there is a group whom is very concerned.

Long Bond Bull market of 2021-2022 Trend ChannelThe channel is at the lower end - levels of 180-200 on the long bond within reach of a new long bond bull market that may be just beginning. Last one was brief 306 days and ended with COVID19 starting in March 2020. Past bull markets have lasted between 12-18 months. Also possible that the current trend will fizzle out. The eurodollar futures curve seems to signal that the long bond bull market is a true phenomenon. Disclosures: Long TLT. Long ZB1 (30 year bond futures).

THE EGG TIMER: chasing interest and security in a crazy world So, this Bear has been down but not out. Look at the charts. Wiley coyote cannot dance upon the canyon air. The FED will fail. It appears they are failing - look at the $....This market is set up as the hallmarks for the greatest crash in all of human history. A repeat of 2020, on steroids...we’re trading now beyond the normal...

The Greatest Crash Ever: About to happen? Many have predicted a second, more severe, crash. It’s my contention it began weeks ago in preparation for today, the beginning of the greatest crash of world markets, ever. My predictions for 7/21/21: SPX 2400 and VIX 105.

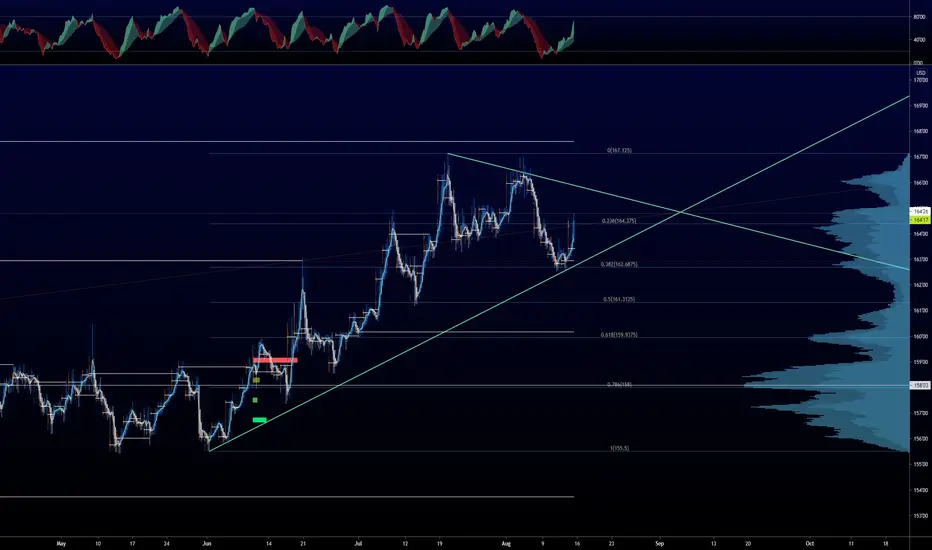
/ZB - T-Bond Futures - More upsideThoughts and ideas are for educational purposes only.
Similar to the TLT idea I posted not that long ago, I'm also expecting these T-Bond futures to have continues upside in the near future. Within the next month, I'm expecting a move into the mid 160s.
The entire corrective cycle is complete from what I can tell and we've attempted to break through this resistance at 158-159. Helen Keller herself can see this resistance (which I've labeled in green).
Once we break through this, it should be a clear path (after a small retest possibly) up to my targets. I'm expecting this to hit in the next 28-35 days.

Bullish setupWhen price is willing to go long from a key support area there are 3 signals to look out for
1. Wait for a lower low to form
2. Wait for price to take out the latest high
3. Then enter on the retest of the high candle placing stop loss below the very low that took out the that high.
If there is Divergence between its correlated class asset that should give more confidence in the buy setup.


Bonds are Ground Zero for Market's Battle with Fed and TreasuryThe bond market is the primary capital-raising marketplace. Market participants issue new debt or buy and sell debt securities in the secondary market. Bonds, notes, and bills are tools for public and private expenditures. Since the US is the world’s leading economy, the market for US government bonds is massive. The long-bond or 30-Year Treasury is a barometer for US interest rates.
The long bond has been trending lower since August 2020- The latest CPI data confirms the trend
Last August, the Fed made a subtle but significant shift
Monetary and fiscal policy remains accommodative
Conflicting signals for the bond market cause a bounce
Jackson hole could bring another shift
While the US central bank, the Federal Reserve, sets short-term interest rates via the Fed Funds rate, buyers and sellers establish rates further out along the yield curve. Following the 2008 global financial crisis and the 2020 worldwide pandemic, the Fed initiated a quantitative easing or QE program. QE is a tool to stimulate the economy via debt purchases that put a cap on rates further out along the yield curve.
Over the past year, the central bank has purchased $120 billion in government debt securities each month. The bond market has been dropping over the past year, despite the Fed purchases. Imagine where the long bond futures would be if the Fed were not buying each month. The bond market is taking on the Fed as it signals inflationary pressures are rising. The Fed may call inflation “transitory,” but this week, the latest consumer price index data from May was a warning sign that the bond market is correct, and the Fed is wrong.
The long bond has been trending lower since August 2020- The latest CPI data confirms the trend
The US 30-Year Treasury bond futures recently rolled from the June to the September contract.
The weekly chart of the long bond futures highlights the drop from 183-06 during the week of August 3, 2020, to the low of 153-29 in late March, early April 2021. While the nearby contract recovered over April, May, and early June, at the 161 level, it remains a lot closer to the low than last August’s peak level.
Bonds seem to have found a floor at just below the 154 level. Weekly price momentum and relative strength indicators have been trending higher since reaching oversold conditions in late March. Open interest, the total number of open long and short positions in the long-bond futures, moved from 1.106 million contracts when the bonds last August to the 1.207 level at the end of last week. Increasing open interest when the price declines is typically a technical validation of a bearish trend in a futures market. Weekly historical volatility at the 4.37% level as of June 11 was close to the lowest level in years.
While the long bond recovered from the lows, last week’s CPI data was bearish for the debt market. The 5% increase and 3.8% rise in core inflation was the highest level in nearly three decades. The Fed continues to call inflationary pressures “transitory” and has concentrated on its “fell employment mandate.” The trend in the bond market, raw material prices, the stock market, real estate, and most other asset classes points to rising inflation. Employment data could be the transitory outlier as low-wage earners continue to benefit from government stimulus and expanded benefits, which results in higher earnings from staying at home rather than returning to work. The latest CPI data confirms rising inflationary pressures.
Last August, the Fed made a subtle but significant shift
Last August, the US central bank told markets it adjusted its 2% inflation target to an average of 2%. The Fed has been encouraging inflation with low interest rates and quantitative easing. It is unclear what period the Fed is calculating the average rate, which makes a substantial difference. Inflation had been well below the target rate for years before it began to rise in recent months.
Economics is a social science. The models and formulas that the Fed watches and depends on are only as good as the variables, which are the inputs for the decision-making process. Individuals and companies are experiencing dramatic price increases and asset inflation. The Fed is taking a wait-and-see approach as it continues on the current course. The central bank was hoping inflation would rise last August. As the old saying goes, be careful what you wish for, lest it comes true.
Monetary and fiscal policy remains accommodative
The tidal wave of central bank liquidity created by low short-term interest rates is unprecedented. Quantitative easing to the tune of $120 billion per month in debt security purchases is an attempt to keep interest rates further out along the yield curve at low levels to stimulate borrowing and spending and inhibit saving. With the long-bond futures slipping from over 180 to the 161 level at the end of last week, QE may have only softened the inflationary blow over the past months. The Fed has a partner in crime, the US Treasury, and the Washington establishment.
If central bank liquidity is at an all-time high, fiscal stimulus is off the hook. Stimulus in the trillions has only exacerbated rising inflation. The price tag for the monetary and fiscal accommodation since the pandemic began is growing by leaps and bounds as it eats away at money’s purchasing power, the classic definition of inflation.
COVID-19 may be fading into the rearview mirror, but its legacy will remain an inflationary danger for many years to come.
Conflicting signals for the bond market cause a bounce
The Fed will meet this week for its June FOMC meeting. So far, the only thing the central bank has said is that it is “not thinking about thinking about” tapering the QE program or increasing the Fed Funds rate to address rising inflationary pressures.
The unemployment rate at 5.8% and core inflation at the highest level in decades are conflicting data for the central bank. Meanwhile, the administration and Congress keep spending with some politicians demanding even more stimulus and programs.
The bond market found a bottom in late March and has been recovering.
The pattern in the September long-bond futures contract illustrates a series of higher lows and higher highs since it traded at 152-16 on March 18, 2021. The latest high came last week at 159-29.
The bond market did not sell off after the latest CPI data, but it did rally on the weak employment numbers.
The bond market may have gotten ahead of itself in March when it fell to the lows. Speculative shorts pushing the long bond futures lower appear to have run out of patience and covered risk positions. However, if the Fed remains on its same accommodative path with help from the government’s tsunami of fiscal stimulus, the rally in bonds is likely to run out of steam sooner rather than later.
Jackson hole could bring another shift
The Fed Governors, economists, and others gather in Jackson Hole, Wyoming, each August. Over the past years, policy shifts have often created fanfare during the event. We could see the Fed begin to guide that QE tapering is on the horizon later this year or early 2022. Economic conditions and rising asset inflation make a shift towards tightening monetary policy logical as vaccines have created herd immunity to the virus, and conditions have not only improved but are robust.
However, if the central bank decides that it needs to keep the accommodative policy in place because of the unemployment rate, it will only pour more fuel on an already burning inflationary fire.
Expect lots of volatility in the bond market over the coming weeks and months. Increased price variance creates a nightmare for passive investors, but it is a paradise for nimble traders with their fingers on the pulse of moving markets. The bond market could be the Garden of Eden for traders over the second half of 2021 and beyond. The bond market is ground zero for the free market’s battle with the Fed and Treasury. Since August 2020, the bond market has been fighting the Fed and winning.
Sign up for the free Monday Night Strategy Call using the link below!
Trading advice given in this communication, if any, is based on information taken from trades and statistical services and other sources that we believe are reliable. The author does not guarantee that such information is accurate or complete and it should not be relied upon as such. Trading advice reflects the author’s good faith judgment at a specific time and is subject to change without notice. There is no guarantee that the advice the author provides will result in profitable trades. There is risk of loss in all futures and options trading. Any investment involves substantial risks, including, but not limited to, pricing volatility, inadequate liquidity, and the potential complete loss of principal. This article does not in any way constitute an offer or solicitation of an offer to buy or sell any investment, security, or commodity discussed herein, or any security in any jurisdiction in which such an offer would be unlawful under the securities laws of such jurisdiction.

Other Than MEME Stocks, the Most Important Chart I am WatchingIf bonds break down, it changes the dynamics of the positive equity rally.

