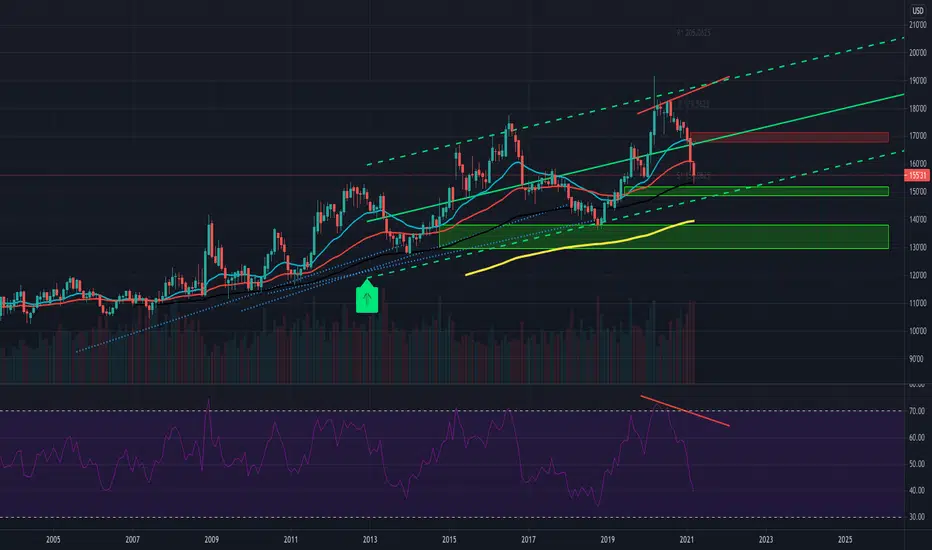
I ANALYZE FOR YOUR COMFORT - TREASURY BONDSOn the chart we have a “Hockey Cross” formation, which as we know is played down, at the ice level. The price of American bonds decreases, their yield increases, which shows us the inflation spectrum on the Horizon. I analyze bonds for investment less than for the effect that their decrease can have on the entire financial market. Dovish BONDS, means rising inflation, which means cheaper dollar, safer more expensive hats. This is only if the EDF does not intervene. Because if he does .... if he walks and millimeters at interest rates, then keep it .... If you find the analysis interesting, given that the impact of bonds is general in the market, leave comments and I will return periodically with update!
ZB1! trade ideas

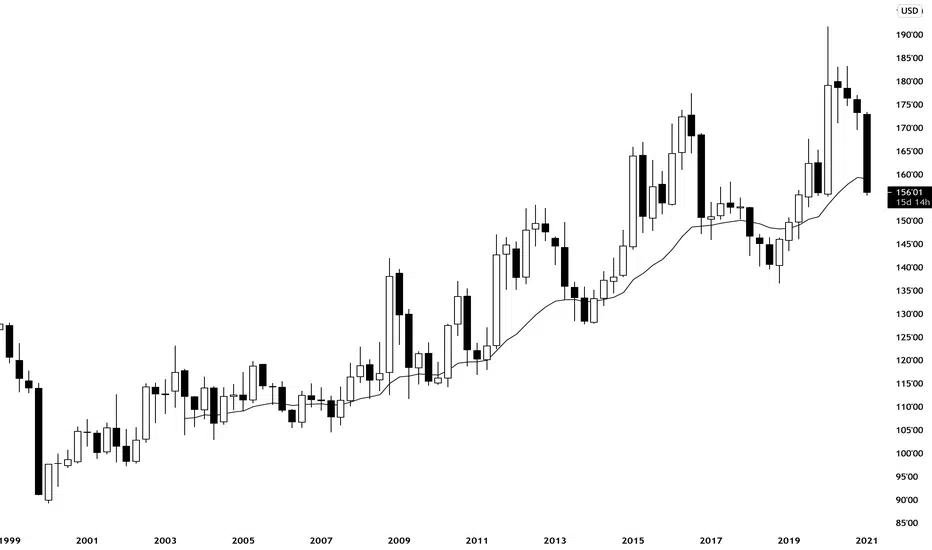
T-Bonds ... Waiting for the dropThe treasury markets have lots of faith in the Fed view that inflation will be transitory and rates will be held low. Bond prices continue to grind higher, ignoring housing prices, increased wages and prices for grains,industrial metals, and even coffee. The end to regulatory pandemic relief, the promised tapering of bond purchases and strong economic indicators are all bearish for bonds. Stellar economic news and job updates are bound to catch up to the long bond. But with Fed support still in place, patience is key. Pick your entry points and target prices in advance. First critical support for a potential reversal trade is 157-24 goes. The bigger trade if 155-28 goes.

ZB Short term Buy continues Day 4It's Thursday and my position on ZB for a buy was knocked out and price proceeded to take out the Friday High I was targeting, late in NY session. Today I saw the plan was still in play even with Friday High out there is still a pool of liquidity above which is my 2nd target. Right in NY Open I saw an opportunity to ride the train using the H4 ICT Bullish Orderblock.

ZB Short term Buy continuesAs explained in my previous ZB projection for long. It's the right time of the day and I see an ICT OTE pattern to deal from. If my projection is right, price is bullish and therefore it should respect the ICT Bullish Orderblocks. Friday's high is an objective I aim for to see price reach and breach then the next level will be the Liquidity pools on the Higher timeframe.

Short term Bullish targets on ZBInteresting how my plans over the weekend got executed to script except Friday's high wasn't raided. I expect the highs to be cleared on Wednesday or Thursday. Tuesday move was a false breakout and a Bullish Break in Structure and the NY Open right after 8:30 am Est was an OTE long of the Bullish OB. I want to see those highs violated with high velocity before the weekend.


... and as this bubble bursts; When and just how bad? ... (II.)... Feel free to come up with your own preferred narrative.
Here is the the Original Post;
This current post;
is generally just a cleaned up version of the original.

US TREASURY BOND ZB ANALYSISMonthly Time Frame -- rsi divergent. Look at that drop. Let's see how far it will go by looking at the lower time frame.
ZB1! / XAU - Short ZB1! often leads the way for golds move with a strong correlation. With this chart breaking out lower I would expect to see a fall back down the the swing lows and this means we can look for sells in GOLD (in the short term)


High probability ZB trade.after , the pullback on 190 MA, selling short the ZB seems to be a high probability trade.


A bearish week might be expected for the ZB and ZN market.Those who trusted treasury bonds have lost this trust, we can think of Asians who are the largest holders of treasury bonds.
The interest rate can only go up and up we can expect easy money. The weekly chart shows a significant bearish trend that may have room to extend.
Don't try to surf, just sell and wait.


The trend is your friend. etf or futures contract? Either way. here's an investible dip.
what are your other buy and hold options? stock indexes with this inflation risk? Bitcoin at these highs? this is all we got.

Investing in US T Bonds10 year moving average. 120 simple. months. no brainer. Stocks are way too high for buying
ZB Really need a bounce here.Looking for a bounce off this level to calm the market down a bit. From a charting perspective its completely normal for price to accelerate into levels like this. It would be surprising, however, if price went through this level easily. If it does that would imply extreme selling pressure which would be concerning. It OK for yields to rise slowly, but can be disastrous if they rise rapidly.

US 30-year Treasury Bonds; Get ready to buy them up.These will easily outperform US (and probably global) equities by a very wide margin! (3%-5% annually) - And so will the 10-year Notes, and the T-Bills, and ... Bet on it! (Inflation expectations = waiting for the Tooth Fairy)
... and when the head o JP Morgan Chase says; "I wouldn't touch 30- year treasuries!" ... You know it's time to load up!

ZB1!, Approaching Critical LevelsChart is inverted for clarity purposes. The price is approaching yearly S1 level. It is a rare opportunity for investors. How often one can enter at yearly levels? Be on a lookout.
03/07/2021

ZB1!, A Trend Reversal to WatchBonds were in the downtrend since March 2020. A larger H&S pattern is in play. Its right shoulder is being developed. The most recent retest of the 61.8% level provided a decent reaction. It means buyers are closely watching the price movement and took a shot to stop the bleeding. This could be an opportunity to enter the market on the long side and hold for a swing trade while the professionals enter the accumulation phase.
02/21/2020

Just how bad is THIS Financial Crisis going to be??...Well, let's try to measure it - and "time it", if anyway possible.
Look at the title chart!
OK, so we just did it. No?!...
(The title chart is the simple ratio of US 30-Year Treasuries / Russell2000)

BEWARE OF POTENTIAL REVERSAL - OBSERVATION WEEK COMING - ZB-30MNThe T-Bond 30 Years ZB is falling when the S&P500 is rising, Shouldn't it be the opposite when the economy is not going well?
Beware of the possible super return of trends that might come soon.
What about the timing at the moment?
We notice that at open or 2h after American open an acceleration of the price movement occurs. Also at London closing time.
What about the forces?
Forces are clearly dragging the prince down but no vision in where the price is going.
What about correlations?
Opposite correlation with S&P500, ES.
Same direction with Gold, GC.
The green vertical line is at the time in which tomorrow, Monday 21st, we probably should see some nice movements if the market price follow same pattern as during the week before.
We will still observe during next week. To repeat again, beware of trend sudden reversal. Probably, you can use this chart in combination of your S&P500 trading session, going in opposite direction.
