Wave 5 30Y Bond Short$TLT $VIX $SPX $SPY $XLF $KBE $KRE Perfect AB=CD wave 4 correction on Weekly Camarilla R3. Next leg down.Shortby mortdiggiddyUpdated 112
ZB Daily Medium Term 1-5 Wave Projection Target ZB Techincal View: From the Medium Term ZB View, My View is ZB just completed its Wave 1 Major Uptrend and now retrace for Wave 2. The Impulse move of Major Wave 3 is forming. I also projected the minor move VWXYZ in Major Wave 3 for reference. My charts is projected based on the FIBO level and all parameter are matching so far. This will be my guideline and reference chart to trade on ZB. Kindly feel free to comment of the reason for ZB to go Long or Short. Agreed my view please click Agreed button or follow me. Thank. Fundamental View Pro Reason : 1. Feb to pulse on Interest raising for 2019, 2. Market at historical high and Risk for correction is high. Bond will be risk aversion tool. 3. 4. Con : 1. 2. 3. 4. Longby TraderWorkFlow1
ZB zoom-inThink we could have a spike lower to 147 before we reverse on ZB. At this time, I still favour higher levels. Figuring out the path is the challenge though, but for the moment, keeping it simpleLongby Astatine0
ZB uptrend end 20190402Today with manufacturing PMI at 55.3, better than concensus, ended the uptrend since March 7, 2019. The sharp pull back is now oversold in RSI and KD. Further selling is not recommended. Since recent uptrend was strong, this pull back is more likely to form a sideway range 148~150'20. But a weak rebound might suggest a ABC correction further below today's low 148.by FinTasticTrading0
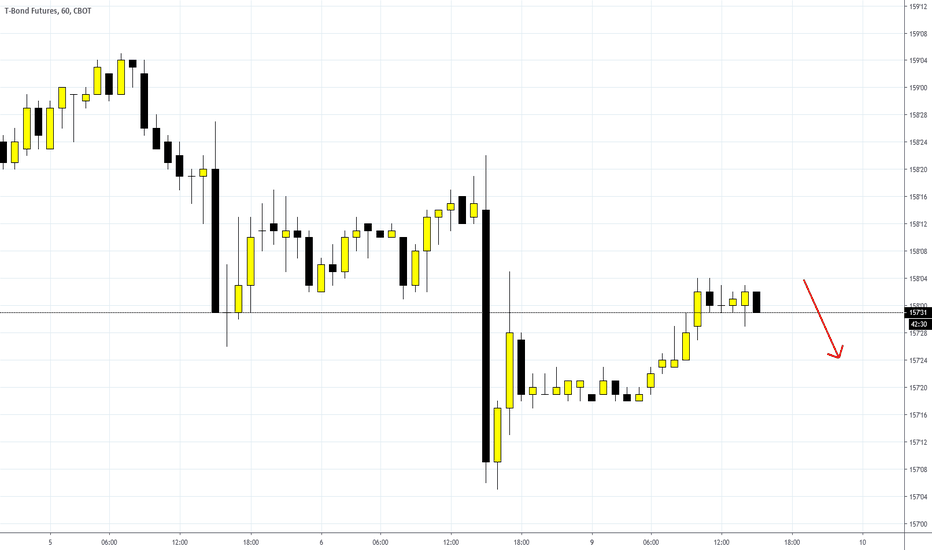
4H ZB Bond Short TradeZB Quick 4H ZB Bond Futures Short Trade with Head Formation and Steep Trend Line Break. by TraderWorkFlowUpdated 1
ZB Futures - Feb Day TradeT Bond Futures post Feb Day Meeting has bullish cycle in each meeting decision regardless Interest Rate Increase or Not. As long as the General Trend is up side, i will do LONG. Typically i use 4H Chart for T Bond ZB for Trend and Reversal observation. Longby TraderWorkFlowUpdated 111
30 year US bond breaking out from bull flagNegative momo divergence should be negated $ZB_F, $TYXLongby pantheo1
ZB trade long - 30 year futures contract Good Demand zone on the hourly chart. set and forget order Longby ShooooooootsUpdated 2
/ZB : UpdateWe hit 148.25 and are pB from that area. Support comes in at 145.29 and below 144 and then the 142 area. IF we get above the149.06 area then the 151.04 area comes into play.Longby BengalTigger0
Bonds to sink or flyThe last bond trade was perfect. Since my last post the futures have soared as well as the TLT etf. The 30 year yield fell as low as 2.90 percent. The yield curve inversion continues to stay towards the middle with the 2 and 5 year below the 1 year and 10 year. The long end has held its ground staying continuously higher. The bond looks as though it may have topped out short term. The sequential is sitting at an 8 on the weekly as well as being far from the 8 ema indicating oversold conditions. The stock market appears to have caught a bid short term so this may lead investors to exit safe havens for the time being. Fed chair Powell appears to be dovish on rates now which could drive up us stocks temporarily. I’m looking for another dip buying opportunity in bonds as I believe what ever news is being floated won’t hold stocks up for long. As soon as they crack bonds will be soaring again. I’m looking at 143 as a support due to prior price activity as well as the 50 week moving average sitting at that level. by ThelmaBrowns1
/ZN resistance hitWe hit the 146.26 area (red line) also a .23 fib area. Lets see if we get above this. IN the very short term support comes in at around the 145 area and below that in the 142 area. I am choosing only to highlight support on bigger time frames except for the 145 support area. IF we can get past this area then 149.06 area should come into playLongby BengalTigger1
/ZN :Is this for real?Pretty spectacular move off the long term trendline. Big ass falling wedge but can also be argued as a H&S. ANyways, pontificating on the pattern is not gonna make us any money. We hit the 23fib. now lets see what happens. Do we get a shallow PB before headed to the 149.07 area before a more meaningful PB to retest the Long term trend line or vice versa. By my estimates, a break of 144-144.13 will reveal more. More important question is what does yields backing off in a rising interest rate environment mean. 2/10 spread 100% delta move from lows..hmmm.Longby BengalTigger3
BewareLow volume on this last move. Needs a lot of volume to breakout. Beware of a false break and upthrust to reverse this move on low volume. Buyers are getting thin right at this point.by patricktapper1
A pull back in "safety"At last we are seeing a pullback in bonds. The stock market continues to have insane intraday volatility with the Trump trade exponent hanging high. I like bonds right now for this purpose. The pull back constituted nothing more than a small mean reversion in an extended market. Im looking for ZB to get between the 10 and 20 period moving averages. At this point I would feel comfortable taking a position. I will gain exposure through TLT options. The highest risk I see here is a deal being made with china. If that is the case I would imagine stocks will rally hard. Money flows out of bonds into stocks. As long as there is uncertainty about this trade deal I think bonds will be solid, at least until interest rates cannot take anymore of a drop.by ThelmaBrowns0
Bonds to resume downtrend$XJY Yen to possible resume downtrend with 30Y $TLT bonds. Tracking well together for October. $GLD $GDX $EURUSD $USDJPYShortby mortdiggiddyUpdated 2
Potential 30Y Bond ShortVolume capitulation on Month CAM S3 backtest. $USO $XLF $TLT $IEF $SPY $QQQ $IWMby mortdiggiddyUpdated 2
30 year bond at yearly low support $ZB_F, $TYX, $TNXBear market headlines about to pop up at -20% from 2016 highby pantheo2
ZB1! US 30-Year Treasury Bond..Bearish! Short and Long Entryswelcome to Geek ChartZ, Chart Reading Made Simple! As you can see we are very bullish and still have a chance to ride the Bear. I have identifed both short and Long Entrys! Enjoy short Entry 141'19 Long entry wide zone 136'26 135'13 Shortby WolfTalk2
[Long] $ZB Short-termEntry @ Market Target @ 143'25 Stop Loss @ 142'10 Success Rate: HighLongby ZLuUpdated 5
[Long] $ZB Mid-termEntry @ below 142'20 Target @ below 148'16 Stop Loss @ 140'24 or lower Success Probability: HighLongby ZLuUpdated 3